Cross-country Spillovers of Renewable Energy Promotion - The Case of Germany - ZEW
←
→
Page content transcription
If your browser does not render page correctly, please read the page content below
// NO.21-068 | 09/2021

DISCUSSION
     PAPER
         // JAN ABRELL AND MIRJAM KOSCH

Cross-country Spillovers of
Renewable Energy Promotion –
The Case of Germany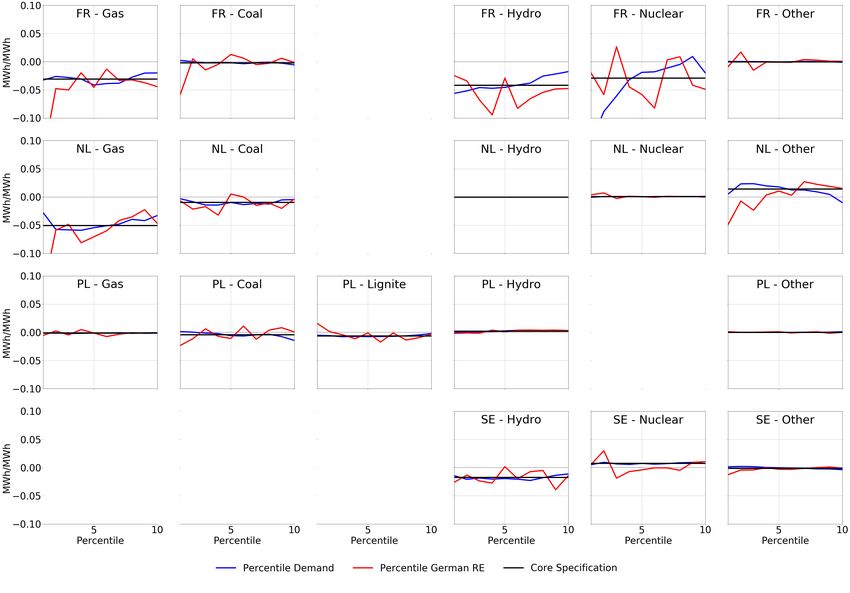
Cross-country Spillovers of Renewable Energy
               Promotion - The Case of Germany

                             Jan Abrella , Mirjam Koschb
       a ZEW    – Leibniz Centre for European Economic Research, jan.abrell@zew.de
  b PIK   – Potsdam Institute for Climate Impact Research, mirjam.kosch@pik-potsdam.de

Abstract
Electricity generation based on renewable energy (RE) sources such as wind
and solar replace the most expensive generators that often rely on fossil fuels.
In response to RE promotion, wholesale electricity prices and carbon emissions
are therefore expected to decrease. In interconnected electricity systems, this
so-called merit-order effect stimulates a change in electricity trade flows. There-
fore, conventional generation and prices in neighboring countries are also likely
to decrease. The impact of these trade reactions on carbon offsets is ambiguous
and depends on installed generation and interconnector capacities. Moreover,
the cross-border merit-order effect causes opposing effects on consumers and
producers: Generators’ profits decline, while consumers benefit from lower elec-
tricity costs and an increase in the consumer surplus. Using a rich data set of
hourly technology-specific generation and wholesale market price data for ten
central European countries, we estimate the domestic and cross-border impacts
of German RE for the years 2015 to 2020. We find that German RE generation
offset 79 to 113 MtCO2 per year. The major emission effect took place in Ger-
many (64 - 99 MtCO2 ). The average cost of emission offset of 212 to 321 e/t
were almost entirely borne by German market participants. Neighboring coun-
tries do not bear costs, but a significant shift from producer to consumer rents
is observed.
Keywords: Renewable promotion, Electricity prices, Merit-order effect,
Cross-border impacts, Carbon emissions
JEL: Q41, Q42, Q58

1. Introduction

    To combat climate change and limit global warming well below 2 degrees, a
soon and drastic reduction of greenhouse gas emissions is needed. Decarbonizing
the economy, the electricity sector is of particular importance as it is a major
emitter of CO2 ; and carbon mitigation strategies for mobility and heating largely
rely on electrification, e.g., electro-mobility or heat pumps. Regulations to mit-
igate these emissions come in two major forms: Carbon pricing and renewable
energy (RE) support (RES). In the European Union (EU), the European Emis-
sion Trading System (EU ETS) imposes a uniform price on carbon emissions of
electricity generation. In contrast, RES policies are delegated to member states
leading to different regulatory approaches and, in particular, subsidies for RE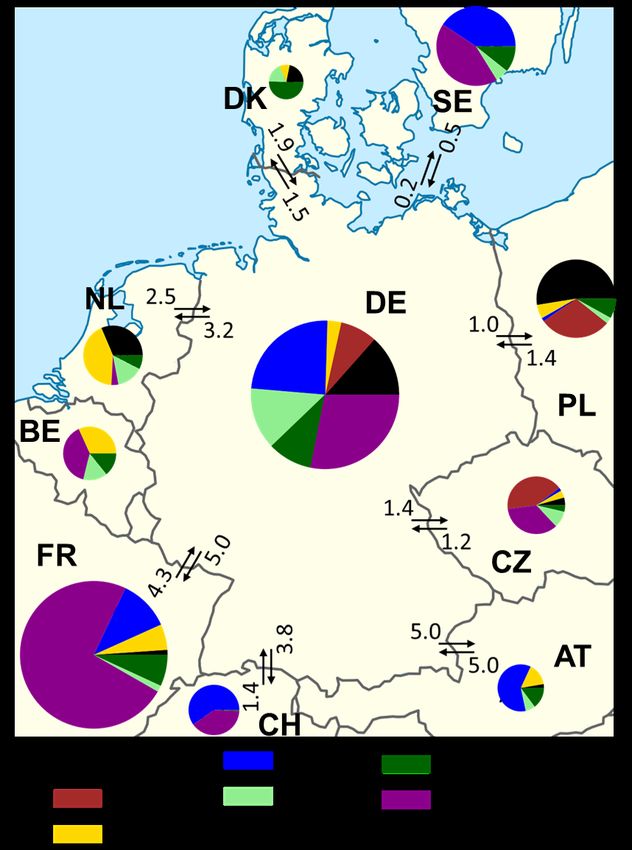
generation differing across countries and technologies. However, electricity gen-
eration does not occur in isolation as the European electricity grid is heavily
interconnected.
    These trade possibilities influence the impact of RES. Due to the low marginal
cost structure of RE generation, domestic prices fall with the increase in RE
generation (merit-order effect). In an interconnected electricity system this
price decrease likely stimulates net-exports to neighboring countries leading to
two major consequences: First, domestic renewable replace generation not only
in the home but also in neighboring markets. RES therefore induces a cross-
border abatement effect. Second, prices in neighboring countries are likely to
decrease as well. This cross-border merit-order effect causes opposing effects
on consumers and producers in neighboring countries. On the one hand, the
price decrease leads to a decline of generators’ profits. On the other hand,
consumers benefit from decreasing prices through an increase in the consumer
surplus. This implies that unilateral RES policies, which are usually paid for
by the consumers within the country itself, also impact neighboring electricity
markets.
    In this article, we empirically study these effects for Germany and its neigh-
bors. Relying on a rich data set of hourly technology-level generation, demand
and prices for the period 2015 to 2020, we calculate the emission effects and dis-
tributional impacts of the large increase of German RE generation. Specifically,
we pose three main questions: What was the impact of German RE generation
on the offset of carbon emissions in Germany and its neighbors?1 What were the
average program cost per emission offset? What was the impact on electricity
prices and how did it affect consumers’ electricity cost and producers’ profits in
domestic and surrounding electricity markets?
    We choose Germany as it is centrally located in Europe, well connected to
its neighbors, and produces a high amount of RE. From 2010 to 2020, German
wind and solar production increased from 38 to 131 TWh and 11 to 51 TWh,
respectively (AG Energiebilanzen, 2021). Moreover, with a total transmission
capacity of more than 20 GW, Germany (DE) is well connected to its neighbors.
We analzye impacts on Austria (AT), Belgium (BE), Switzerland (CH), Czech
Republic (CZ), Denmark (DK), France (FR), The Netherlands (NL), Poland
(PL), and Sweden (SE).2
    Our main findings are as follows: First, we find that German RE production
offset on average 79 to 113 MtCO2 per year in the period from 2015 to 2020.
The major part (80-90%) occurred domestically. Around one third of German
RE production is exported to neighboring countries, stimulating annual carbon
offsets of 15 to 113 MtCO2 in neighboring countries. This impact is rather divers
across neighbors. The major part of foreign abatement took place in the Czech
Republic and the Netherlands, where electricity markets are characterized by a
large share of fossil generation. In the remaining countries the emission offset
is relatively small as these countries are either largely characterized by carbon
neutral generation assets (Austria, France and Sweden) or have very limited

   1 Due to the EU ETS the decrease of carbon emissions through RE generation is at least

partly offset as the overall emission target is constant. Due to the Market Stability Reserve
(MSR) at least part of the emission decrease in that period is translated into emission abate-
ment, i.e., a decrease of the number of allowances under the EU ETS (Perino, 2018).
   2 ISO 3166-2 codes are used to abbreviate country names.

                                              2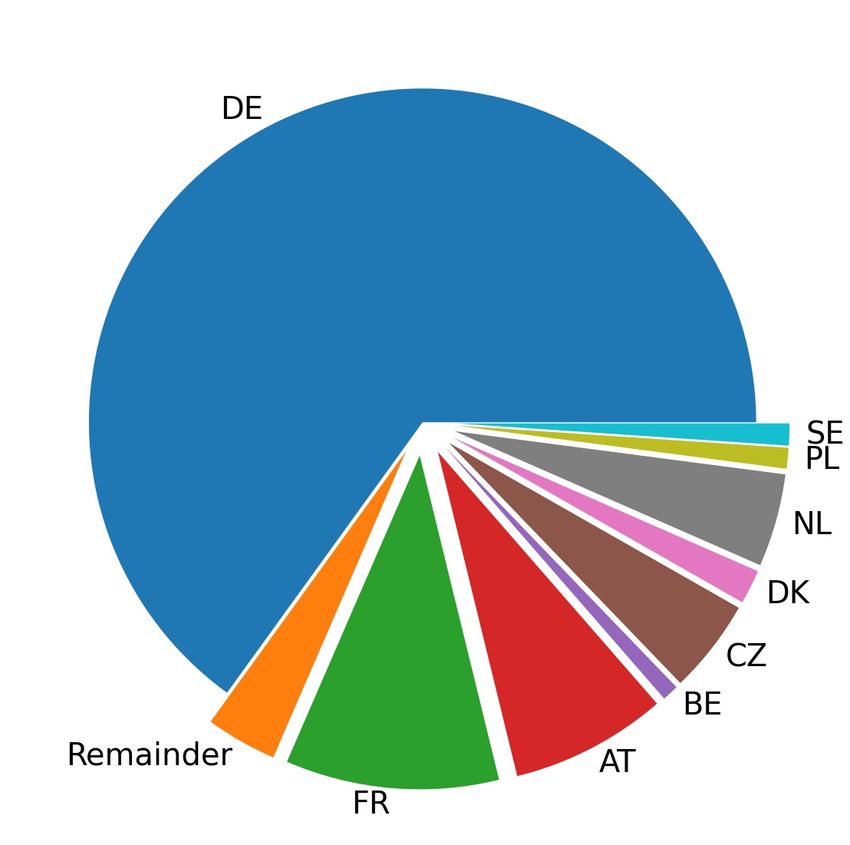
interconnector capacities to Germany (Poland and Belgium).
     Second, these results of our core estimation are robust to a large set of alter-
native specifications. Only the re-sampling of our data set to weekly (instead
of hourly) values leads to a substantially higher carbon offset. This can be ex-
plained by the behavior of hydro power plants: While at the hourly level RE
replace a substantial amount of hydro generation, it is likely that in the case of
reservoirs and pump-storage plants, this generation is shifted to another hour of
the same week. This increase of hydro generation in other hours then replaces
fossil generation and leads to an additional offset of carbon emissions. This
effect cannot be observed at an hourly level, but is only accounted for when
re-sampling the data to weekly values.
     Third, RE generation decreased German electricity prices by 14 e/MWh
on average. The cross-border merit-order effect of German RE is smaller, but
nevertheless substantial for some countries: Prices in the Czech Republic and
Denmark decrease around 10 e/MWh (23%), in all other countries except for
Poland, prices decrease by 6 to 13%. Only in Poland, the price effect is with less
than one percent very low - again this is due to very limited trade capacities.
     Fourth, in surrounding countries German RES schemes leads to a decrease
in conventional generators’ profits and to an increase in the consumer surplus.
The overall effect is rather modest. In net-importing countries, the increase in
consumers’ benefits exceeds the decrease in producers’ profits, leading to a slight
net benefit from German RE. In contrast, in net-exporting countries German
RE induce a slight net loss.
     Fifth, the average program costs add up to 212 to 321 e/tCO2 and are almost
entirely borne by German market participants. As these costs mainly consist
of the refinancing surcharge of RE promotion, German consumers carry the
major financial burden with about two third of total costs—although the costs
of purchasing electricity on the wholesale market decrease. German producers,
in contrast, bear about one third of total costs.
     We contribute to the literature in three important ways. First, most studies
concentrate either on the generation and emission or price impacts of RE gen-
eration. Combining both of these effects allows us to estimate the impact of RE
generation on producers profits and consumers’ cost of electricity not only in
Germany but also in neighboring countries. We thus contribute to the literature
by extending Abrell et al. (2019) to include cross-border effects of German RE
promotion.
     Second, We contribute to the literature on empirically estimating the envi-
ronmental effectiveness of RE generation. Most of these studies (e.g. Cullen,
2013; Novan, 2015; Abrell et al., 2019; Gugler et al., 2021) concentrate on the
domestic emission offset. In the US context, Callaway et al. (2018) estimate the
spatial variation of marginal emission offsets of RE generation by region. Fell
et al. (2021) and LaRiviere & Lu (2020) estimate the impact of grid congestion
on the environmental effectiveness of wind power in Texas and the Midconti-
nent Independent Market Operator (MISO). Most similar to our work, Schnaars
(2019) estimates the impact of German solar and wind power on domestic gen-
eration and export flows. Whereas Schnaars (2019) estimates the impact of RE
generation on export flows, we directly estimate the impact of RE on genera-
tion by fuel source in neighboring countries. We contribute to this literature by
providing an assessment of the total emission offset of German RE generation,
i.e., the impact on emissions in Germany and its neighbors.

                                         3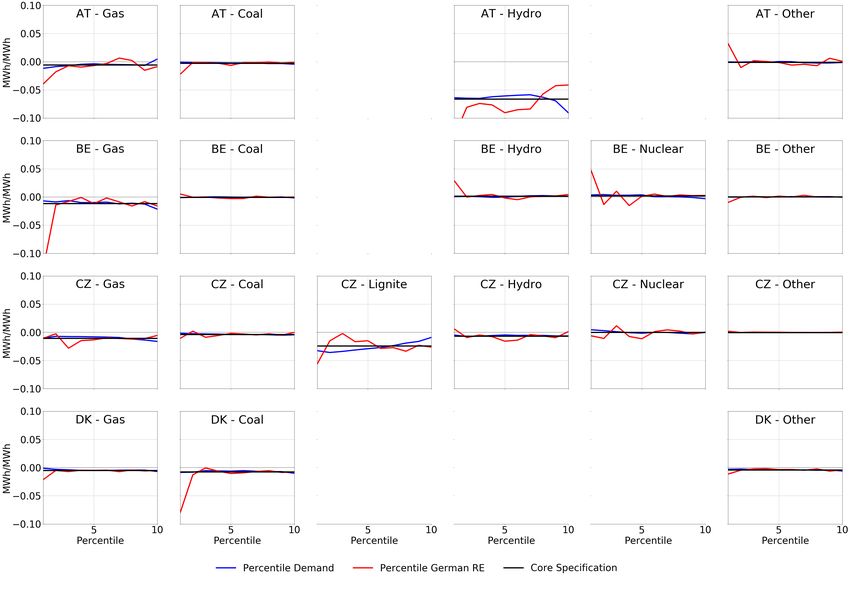
Third, we contribute to the literature estimating the decreasing price effect
of RE promotion (merit-order effect). Most studies (e.g. Wuerzburg et al., 2013;
Cludius et al., 2014; Abrell et al., 2019) concentrate on the domestic price effect
of RE promotion. Phan & Roques (2015) and Haxhimusa (2018) analyze the
cross-border merit-order effect for the case of German RE and French price
levels. Likewise, Gugler & Haxhimusa (2019) look at price convergence between
Germany and France. We complement the current literature providing the total
merit-order effect of German RE, i.e., we estimate the domestic as well as cross-
border price effect for Germany and its neighbors.
    The remainder of this paper proceeds as follows. In the next section, we
present some background on electricity markets in Germany and its neighbors,
as well as data sources and construction. In Section 3 we present our estimation
strategy. Sections 4, 5, and 6 show the results and Section 7 concludes.

2. Context and Data

    In its 2020 climate & energy package, the EU set a target to provide 20%
of energy from renewables. The current target—specified in the 2030 climate &
energy framework —is to reach a share of 32% of RE by 2030. To increase their
share of RE generation, all European countries have implemented RES schemes.
While these schemes significantly differ in the type and magnitude of subsidies,
they have induced substantial changes in many European electricity markets.
    Next to the developments in the electriciy markets themselves, also the data
availability has increased in recent years. Since 2015, the European Network of
Transmission System Operators for Electricity (ENTSO-E) transparency plat-
form3 provides hourly data on electricity generation per technology and country,
as well as wholesale market prices. Our analysis makes use of this rich set of
data, which we complement with daily data on fuel and carbon prices as well
as country-specific temperatures. In the following, we provide an overview of
central European electricity markets, their interconnections, and how RE gen-
eration has recently developed.
    RENEWABLE ENERGY GENERATION—–For central European countries, RE
generation increased by about 60% between 2015 and 2020 (Table 1). In abso-
lute terms, the largest increase is observed in Germany. In 2020, the country
produced 176 TWh of wind and solar energy, which is more than all its neigbors
together. Due to Germany’s central location and the transmission infrastructure
(see Figure 1), the large amount of German RE generation likely affects elec-
tricity trade and with that neighbors’ electricity generation, carbon emissions,
and prices.
    ELECTRICITY TRADE—–German RE impacts neighboring countries through
a change in electricity flows. Germany has interconnectors to Austria (AT),
Switzerland (CH), Czech Rebublic (CZ), Denmark (DK), France (FR), Nether-
lands (NL), Poland (PL) and Sweden (SE) (Figure 1).4 We also include Belgium
(BE) in our analysis, although no direct connection to Germany exists, but only

  3 https://transparency.entsoe.eu/
   4 In Spring 2021, GreenLink a direct current connection between Germany and Norway

became operational.

                                         4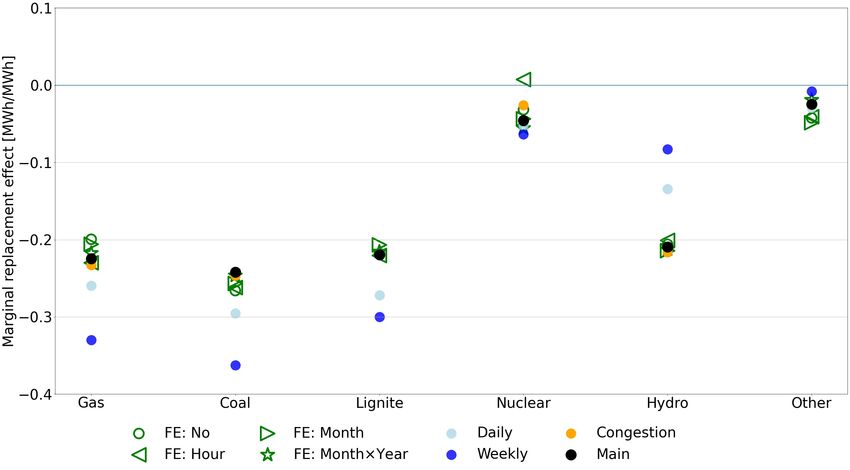
Table 1. Wind and solar generation by country [TWh]

         DE        AT      BE        CZ         DK        FR      NL      PL     SE      total
2015    111.95    5.73      8.02     2.83   14.25       26.62     6.99   10.61   16.41   203.69
2016    110.26    6.25      7.48     2.62   12.64       27.51     4.43   11.61   15.60   198.79
2017    138.55    7.87      8.31     2.72   15.17       31.75     6.38   14.41   17.31   242.98
2018    149.80    7.82      9.82     2.94   14.91       36.52     6.53   12.33   16.30   257.38
2019    165.72    9.31     11.56     2.94   16.90       44.09     7.16   14.57   19.50   292.24
2020    175.79    8.49     15.20     2.85   17.66       50.75     7.53   16.98   26.87   324.61

Note: Annual generation of wind and solar generation by country is derived from hourly values
obtained from (ENTSO-E, 2021).

                  Table 2. Annual net-imports from Germany [TWh]

          DE        AT        CZ          DK         FR         NL       PL       SE     total
2015     31.35     4.82      -3.65      -3.30         9.49      16.17    -0.70   -1.79   52.40
2016     27.97     7.89      -3.42      1.72          9.74      11.07    -0.65   -0.66   53.65
2017     31.79     8.55      -2.54      -2.37        13.73       9.58    -1.03   -1.91   55.81
2018     25.18     4.22      -2.18      -0.13         8.34      14.54     0.88   -0.85   50.00
2019     19.61     -0.59      1.94      1.92          2.45       4.02     2.33   -0.75   30.94
2020     18.47     -1.38      3.77      -6.94         1.61      -1.60     2.92   -2.14   14.70

Note: Data are annual aggregates of hourly scheduled commerical exchanges (ENTSO-E,
2021). The total is interpreted as total commerical exchange of Germany with its neighbors
in a given year, i.e., German net-exports to its neighbors. Belgium is not shown, as no
electricity line between Germany and Belgium exists.

a 220kV line between Belgium and Luxembourg. The latter forms a common
price zone with Germany, and is thus not included.
    Table 2 shows the yearly net-imports of the neigboring countries from Ger-
many. In 2015 Germany exported about 52 TWh and exports slightly increased
until 2017. Although in later years one could expect further raising exports
due to increasing RE generation, exports decreased after 2017. One likely
explanation can be found in the reconfiguration of electricity price zones in
central Europe (Bundesnetzagentur (BNetzA), 2019). Since October 1st 2018,
Germany and Austria are separate electricity price zones and congestion pric-
ing has been introduced at the German-Austrian border. Most neighbors are
net-importers on an annual level. For Southern (Austria and Switzerland) and
western (France and the Netherlands) neighbors, annual imports from Germany
decreased in recent years. In contrast, Eastern neighbors (Czech Republic and
Poland), turned from exporting to importing electricity from Germany. Finally,
countries in the North (Sweden and Denmark), are net-exporters with increas-
ing exports to Germany over time. Overall, the picture of net-imports from
Germany is rather diverse as trade flows are impacted by several factors such as
renewable generation, capacity and load developments, and the reconfiguration
of price zones.
    MARKET SIZE AND PLANT PORTFOLIO—–How generation, emissions, and
prices react to a trade change is determined by the generation portfolio and
market size of the respective country (Table 3 and Figure 1). Within central
Europe, Germany and France are the largest electricity markets with close to

                                                 5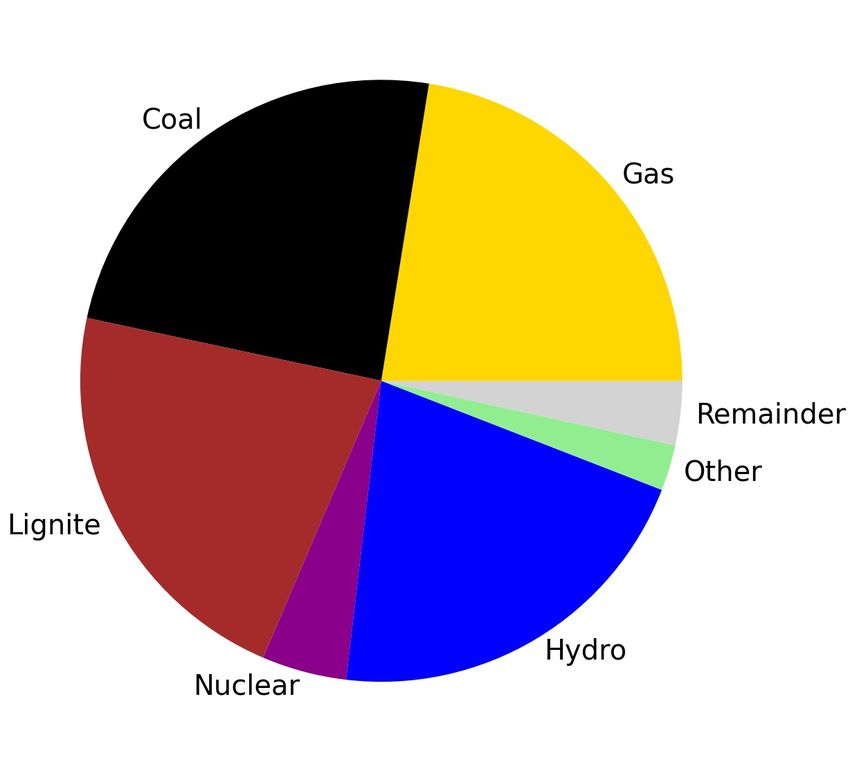
Figure 1. German Electricity Trade Capacities [GW]
Notes: The figure shows the average hourly net transfer capacity (Bundesnetzagentur
(BNetzA), 2019) and generation shares by technology (ENTSO-E, 2021) for the year 2018.
The size of the pie charts is scaled to reflect total generation in the respective country. Mean
hourly demand in Germany was about 58 GW. As Luxembourg and Germany form a common
price zone, we do not show values for Luxembourg. No direct connection between Belgium
and Germany exists but a 220kV line between Luxembourg and Belgium which is omitted in
the graph.
500 TWh of annual demand. They are followed by Poland, Sweden and the
Netherlands. Annual load in Belgium, the Czech Republic, Austria, Switzer-
land, and Denmark are below 100 TWh.
Countries are rather diverse in their production profiles and carbon inten-
sity: Despite a high share of RE generation, Germany largely relies on carbon-
intense lignite and coal as well as nuclear power plants. A similar pattern is
observed in Denmark, although without nuclear. In the Netherlands gas and
coal generation provide most of the electricity, in Belgium it’s mostly nuclear
and gas. Consequently, the carbon intensity of electricity generation in these
four countries is neither very high nor very low. In contrast, very carbon intense
generation is observed in Poland and the Czech Republic, which are character-
ized by large shares of coal and lignite generation and very low shares of RE.
Finally, Sweden, France and Austria almost entirely rely on carbon free hydro
and/or nuclear power; complemented by some gas plants in France and Austria
to cover peak load.
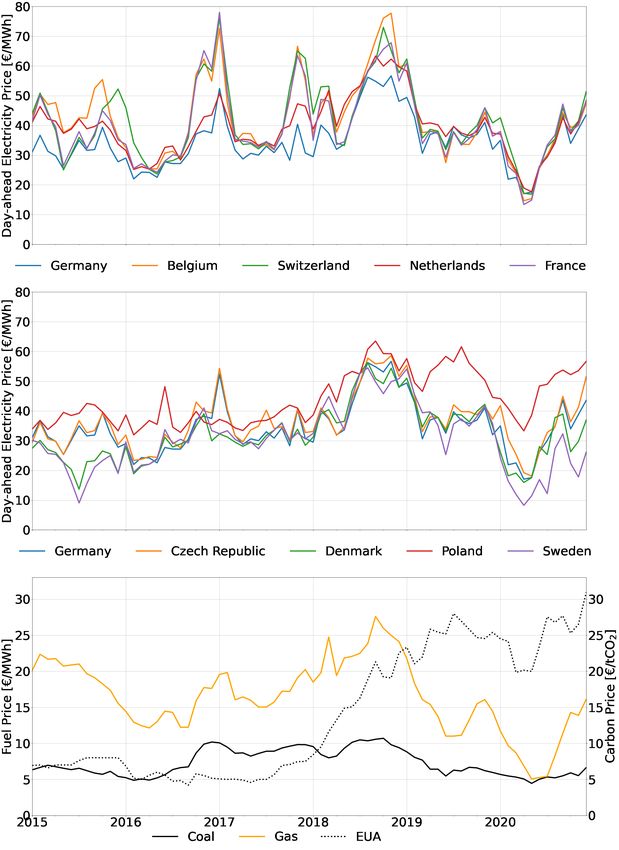
ELECTRICITY PRICES—–Figure 2 shows wholesale electricity market prices
for Germany and its neighbors. We observe that prices generally develop very
similarly across countries, especially in the last few years of our sample. An
exception is Poland which in recent years had higher prices than the other
countries.
Although—due to the near-zero marginal cost structure—the increase in
RE generation exerts a decreasing impact on European electricity prices, most
6Table 3. Mean of annual generation, demand and net-imports [TWh]
DE AT BE CZ DK FR NL PL SE
Gas 36.87 8.78 22.26 3.74 2.94 33.66 36.39 7.81 -
Coal 63.55 1.29 0.49 3.54 6.10 5.69 22.17 77.21 -
Lignite 117.80 - 0.00 31.78 - - - 43.28 -
Hydro 16.57 32.62 -0.17 1.54 - 54.70 0.00 2.45 66.36
Nuclear 73.28 - 34.65 26.65 - 379.65 3.67 - 59.11
Other 69.16 3.67 9.78 7.52 4.30 6.68 13.44 3.87 7.76
Renewable 142.01 7.58 10.07 2.81 15.26 36.21 6.50 14.89 -
Load 471.48 74.36 77.85 72.06 28.26 500.12 92.98 149.98 151.16
Net-import -5.33 1.11 0.24 -0.61 -0.02 -1.59 1.18 0.25 -0.07
Note: Shown is the the mean of annual generation by technology over the years 2015 to 2020.
Other is a technology aggregate mostly containing biomass generation. Annual values are
derived from houry data provided by (ENTSO-E, 2021), load is calculated as the sum of total
generation and net-imports. Generation data for Switzerland are known to be incomplete and
thus not used in our analysis.
countries show a slightly increasing trend until 2019 and a decline afterwards.
This can be explained by developments of fuel and carbon prices (Figure 2, lower
panel). They determine generation cost, and are thus another main driver of
electricity prices together with load and RE generation. We observe that coal
prices are rather constant over our sample period from 2015 to 2020, but gas
prices are volatile with a peak in 2018 followed by a large decline. Moreover,
carbon prices started to increase in mid 2017 from a level of 5 to over 30e/tCO2
in 2020.
SUMMARY AND OUTLOOK—–Summarizing, we observe an increasing trend
of RE generation in all central European countries. By far Germany had the
largest increase in absolute terms. As electricity generation and prices do not
only depend on renewable generation the descriptive evidences of a cross-country
impact of German RE on neighboring countries are rather weak. In the next
section we thus introduce our econometric approach to estimate the impact of
German RE while controlling for changes in fuel prices and load conditions.
3. Empirical Framework
3.1. Empirical Specification
To disentangle the effect to German RE on generation in central Europe,
our basic regression specification takes the following form:5
qitr = αr + βir rt(DE) + γ1ir rtr + γ2ir dtr + γ3ir dt(DE)
+ γ4ir φtctg + γ5ir φtltg + γ6ir ttr + Ft δir + itr . (1)
We regress hourly generation of technology i in hour t and country r, qitr ,
on German RE generation, rt(DE) . To account for electricity demand in the
respective country and Germany, we include load of both countries, dtr and
5 For a formal derivation of the estimation model, we refer to Abrell et al. (2019).
7Figure 2. Electricity, fuel and carbon prices
Notes: Upper two panels show monthly means of hourly day-ahead electricity prices obtained
from (ENTSO-E, 2021). For Poland, ENTSO-E (2021) prices are incomplete and we thus
used dayhead prices from EIKON (2017). The lower panel shows monthly average of daily
fuel prices (measured on the left axis) and the EU Allowance (EUA) forward price (ICE,
2021).
8dt(DE) , as well as RE generation in the respective country, rtr .6 The output of
technology i depends on its marginal cost relative to the marginal cost of all
other generators in the market. We therefore include the coal-to-gas price ratio,
ctg ltg
φtr , and the lignite-to-gas price ratio, φtr , to control for changes in relative
marginal cost. Both of these price ratios are carbon price inclusive, i.e. include
the EU Emissions Allowance (EUA) price.7 Further, we control for ambient
temperatures (ttr ) as they affect the efficiency of power plants and capacity
of the transmission lines. Since we observe available capacities by technology
only at the annual level, they are omitted from the estimation due to missing
variation. We also do not observe the net-transfer capacities at the hourly
level. To control for changes in these variables, we include month-of-sample
(month × year) fixed effects (F ). Finally, to control for the impact of seasonal
and daily cycles, we additionally include month-of-year (month) and hour-of-
day (hour) time fixed effects. All variables and fixed effects are described in
Table 4.
Table 4. Estimation variables
Variable Description
pele
tr Hourly electricity price in country r [e/MWh]
ttr Hourly RE production in country r [GWh]
ttr Daily mean temperature in country r [◦ C]
dtr Hourly system demand in country r [GWh]
pcoal
t Daily coal price [e/MWhth ]
pgas
t Daily gas price [e/MWhth ]
pEU
t
A Daily price of European Emissions Allowances [e/tCO2 ]
φctg
t Daily carbon price inclusive coal-to-gas price ratio
φltg
t Daily carbon price inclusive lignite-to-gas price ratio
month × year Month-of-sample fixed effects
month Month-of-year fixed effects
hour Hour-of-day fixed effects
Notes: See Section 2 for detailed description of source data. Daily mean temperatures taken
from ECAD (2020). MWhth refers to thermal energy.
To determine the effect of German RE on electricity prices in central Europe,
we regress the electricity price on German RE and a similar set of controls:
pele
tr = αr + βr rt(DE) + γ1r rtr + γ2r dtr + γ3r dt(DE) (2)
+ γ4r ptcoal + γ5r ptgas + γ6r ptEU A + γ7r ttr + Ft δr + tr .
In a competitive electricity market, prices are equal to the generation cost of
the marginal supplier. These cost depend on the level of fuel and carbon prices
rather than on relative prices. We thus include absolute fuel prices, ptcoal and
6 For the case of Germany (r = DE), we include renewable generation and demand of all
countries within our sample.
lignite
7 φctg pcoal
t +θ
coal EUA
pt p +θ lignite pEUA
t := gas
pt +θ gas pEUA
and φltg
t := t pgas +θgas pEUA t
. pcoal
t , pgas lignite
t , and pt are respec-
t t t
tive fuel prices and pEUAt the carbon price. θ is the fuel specific carbon content. For gas we
use 0.2, for coal 0.34, and for lignite 0.39 tCO2 /MWhth (IPCC, 2006). Lignite extraction
is mostly integrated with power generation and therefore not obtained on the international
market. In the calculation of the lignite-to-gas price ratio, we therefore use a constant price
level of 1.5 e /MWh as proxy for extraction cost (UBA, 2017).
9ptgas , and the carbon price, ptEU A , to control for changes in generation cost.
In the quantity regression our main coefficients of interests are βir , i.e., the
impact of German RE on generation of technology i. Likewise, in the price re-
gression we are interested in βr , the impact of German RE on electricity prices
in region r. The identification of these coefficients relies on two crucial assump-
tions. First, we assume that RE generation is exogenous. This assumption can
be justified as the marginal cost of RE are near zero. Thus, once the capacity is
installed, RE generation is driven by natural conditions such as wind speed and
solar radiation. Second, we assume demand to be inelastic. This assumption is
justified by our time horizon as we investigate hourly electricity markets.
3.2. Alternative Specifications
To test the robustness of our results, we provide sensitivity analyses in four
dimensions: (i) different sets of time fixed effects, (ii) a congestion dummy to
account for congested interconnectors, (iii) different functional forms to account
for non-linear effects, and (iv) changes in temporal resoultion by re-sampling to
daily and weekly data.8
FUNCTIONAL FORM—– Our core specifications rely on linear functional forms.
However, the reaction of conventional generation and electricity prices to changes
in RE generation might be non-linear. We thus estimate alternative semi-
parametric specifications allowing coefficients to flexibly adjust depending on
the level of load and renewable production:
X
qitr = Binb αbr + βbir rt(DE) + γb1ir rtr + γb2ir dtr + γb3ir dt(DE) (3)
b
i
+γb4ir φtctg + γb5ir φtltg + γb6ir ttr + Ft δir + itr ,
X
pele
tr = Binb αbr + βbr rt(DE) + γb1r rtr + γb2r dtr + γb3r dt(DE) (4)
b
+γb4r ptcoal + γb5r ptgas + γb6r ptEU A + γb7r ttr + Ft δr + tr .
Binb represents an indicator for the bth decile of a variable. We estimate equa-
tions (3) and (4) in two different versions: First, Binb representing the load
deciles of the respective country; second, Binb representing the deciles of Ger-
man RE generation.
CONGESTION—–As shown by Fell et al. (2021) and LaRiviere & Lu (2020),
congestion might affect the impact of RE on generation and prices. As con-
gestion is not observed, we construct a measure of congestion of cross-country
interconnectors: We define the interconnection between country r and r0 as con-
gested (Ctrr0 = 1) if the relative price difference exceeds two percent in hour
t: ele ele
0 if ptr −pele
tr 0
< 0.02
ptr
Ctrr0 = ele ele
1 if ptr −p tr 0
≥ 0.02 .
pele tr
Interacting the congestion dummy with German RE, we test the impact on
8 In case of the price estimation (2), we only test robustness with resepct to different time
fixed effects and functional forms.
10our coefficient of interest, i.e., we alternatively estimate:
qitr = αr + β1ir rt(DE) + β2ir Ctr(DE) rt(DE) + γ1ir rtr + γ2ir dtr + (5)
+ γ3ir dt(DE) + γ4ir φtctg + γ5ir φtltg + γ6ir ttr + Ft δir + itr
(6)
The average marginal impacts are then calculated as:
βi = β1ir + β2ir C tr(DE) ,
where C tr(DE) is the share of congested hours between country r and Germany.
We find the highest share of congested hours for Poland (91.7%), followed by
Switzerland, Sweden and the Czech Republic (83.5, 80.6, and 78.7%). Lower
congestion shares are observed for Denmark, France and the Netherlands (58.7,
54.9, and 48.8%). Since Austria was in the same price zone as Germany for
most of our sample period and Belgium does not have a direct interconnector
to Germany, we do not report congestion for these two countries.
TEMPORAL RESOLUTION—– German RE might offset hydro generation in
some hours. In the case of hydro storage, this generation is merely shifted to
another hour, i.e., it might decrease fossil generation and emissions in another
hour. Depending on the type of storage, this effect might occur on a daily
or a larger cycle. We thus perform additional regressions by re-sampling our
hourly data set to average daily and weekly data. This reduces the impact of
very short-run impacts of RE generation as it accounts for the shift of hydro
generation to another hour of the same day or week.
3.3. Annual Impacts and Emission Offsets
We calculate annual effects by evaluating estimated marginal effects at the
annual average of German RE over our sample period 2015 to 2020:
∆pr := βr rDE , (7)
∆qir := βir rDE , (8)
where βir and βr refer to the coefficient in equations (1) and (2), and RDE is
mean annual RE production in Germany.
Multiplying the average annual generation change with the technology-specific
emission coefficient ei , we obtain the average annual emission offset:9
∆Eir : = ∆qir ei . (9)
4. Replacement and Emission Impact of German RE
4.1. Marginal Impacts on Generation
What is the impact of an additional MWh of German RE generation on
conventional generation in the domestic and neighboring markets? Table 5 and
Figure 3 show the average marginal replacement effect of German RE by country
technology and country.
9 We use average emission coefficients of 1.17/0.95/0.37 tCO2 /MWh for lignite/coal/gas.
11Figure 3. Share of replacement impacts by country and technology
Notes: Figures are based on total values in Table 5.
An additional MWh of German RE reduces German generation by 0.65 MWh,
while 0.32 MWh are exported to neighboring markets. With 0.10 and 0.08 MWh
the largest foreign replacement effect is observed in France and Austria as they
have the largest interconnectors (see Figure 1). Around 0.05 MWh of con-
ventional generation are replaced in the Czech Republic and the Netherlands,
respectively. Generation in Belgium, Denmark, Poland, and Sweden only shows
a minor reaction.
At the technology level, one MWh of German RE replaced on average 0.69
MWh of fossil generation inducing an offset of carbon emissions. Coal gener-
ation (0.24 MWh) is affected most, followed by gas (0.23 MWh) and lignite
(0.22 MWh). Furthermore, we find an impact of 0.21 MWh on hydro gener-
ation, and a minor impact of 0.05 MWh on nuclear and 0.03 MWh on other
generation. As expected, generation impacts follow a merit-order logic. The
impact on fossil generators with high marginal costs is larger than the impact
on generators with low marginal costs such as nuclear. However, concerning
hydro power, a closer analysis is needed. As hydro generation includes both,
non-dispatchable run-of-river generation with low marginal cost and dispatch-
able generation from reservoirs and pump-storage plants with high opportunity
cost, indirect impacts of shifting generation in time can be expected. In the next
section, we address this issue with two alternative specifications using different
temporal resolutions of our data set.
At the country level, the replacement effects mirror the respective generation
portfolio: In Austria, France and Sweden mostly hydro power is affected, in
Belgium and the Netherlands mostly gas generation is replaced and in the Czech
Republic and Poland, lignite producers show the largest reaction.
Under our assumption of inelastic demand, one MWh of German RE should
replace one MWh of generation. With 0.97 MWh (per MWh of RE generation)
the total replacement is therefore close to one. The remaining deviation is likely
to be explained by three main reasons: First, Germany also trades electricity
with Switzerland. Due to missing generation data, we are unfortunately not
able to estimate this impact. As Swiss electricity generation is based on carbon-
neutral hydro and nuclear power, this does not affect our estimate of the emission
offset. Second, it is possible that German RE stimulate additional re-exports,
12Table 5. Average marginal replacement effect of German RE [MWh/MWh]
DE AT BE CZ DK FR NL PL SE total
Gas -0.109 -0.006 -0.012 -0.011 -0.005 -0.031 -0.051 -0.001 - -0.225
(0.004) (0.001) (0.001) (0.000) (0.000) (0.002) (0.002) (0.000) - (0.005)
Coal -0.212 -0.003 -0.000 -0.004 -0.007 -0.002 -0.010 -0.004 - -0.242
(0.007) (0.000) (0.000) (0.000) (0.001) (0.001) (0.001) (0.001) - (0.007)
Lignite -0.189 - - -0.024 - - - -0.007 - -0.219
(0.006) - - (0.001) - - - (0.001) - (0.006)
Hydro -0.081 -0.066 0.002 -0.007 - -0.042 0.000 0.002 -0.017 -0.210
(0.003) (0.002) (0.000) (0.000) - (0.002) (0.000) (0.000) (0.002) (0.004)
Nuclear -0.027 - 0.002 0.000 - -0.029 0.001 - 0.008 -0.046
(0.003) - (0.001) (0.000) - (0.005) (0.000) - (0.001) (0.006)
Other -0.033 -0.001 0.000 -0.000 -0.004 0.000 0.014 0.000 -0.001 -0.025
(0.004) (0.000) (0.000) (0.000) (0.000) (0.000) (0.001) (0.000) (0.000) (0.004)
Total -0.650 -0.076 -0.008 -0.046 -0.017 -0.103 -0.045 -0.010 -0.011 -0.965
(0.011) (0.002) (0.001) (0.001) (0.001) (0.006) (0.002) (0.001) (0.002) (0.029)
Notes: Numbers correspond to the coefficients βir of equation (1). Heteroscedasticity robust
standard errors in parentheses.
e.g. via Austria to Italy. Some replacement will therefore realized outside our
country scope. Third, the ENTSO-E data underlying our estimation only report
generation of units with an installed capacity above 100 MW, and we therefore
miss some generation impacts.
4.2. Robustness Checks
As described in Section 3.2, we provide four types of robustness checks: (i)
different fixed effects, (ii) a congestion dummy to account for congested transfer
capacities, (iii) changes in the functional form to account for non-linear effects,
and (iv) changes in temporal resolution by re-sampling to daily and weekly data.
The estimation results per technology and country are provided by Tables A.2
to A.6 in the Appendix. Figure 4 provides an overview of robustness results by
technology.
FIXED EFFECTS AND CONGESTION—–We find that our results are generally
very stable to various specifications: The marginal replacement effects do not
react substantially to the inclusion of different sets of time fixed effects. Also
the impact of congestion is relatively low, i.e., there is no substantial change
in results when including a dummy that accounts for hours when transfer lines
between two countries are congested.
TEMPORAL RESOLUTION—–The blue dots in Figure 4 show the results of
our specifications with daily and weekly temporal resolution. It becomes visi-
ble, that the impact on hydro generation decreases while the impact on fossil
technologies (gas, coal and lignite) increases compared to estimates based on
hourly data. As hydro generation includes dispatchable generation from reser-
voirs and pump-storage plants, we expect hydro plants to shift generation from
hours with high RE production and, thus, low prices to hours with low RE pro-
duction and correspondingly higher electricity prices. Therefore, on the hourly
level, German RE leads to a decrease of hydro generation. As this decrease
likely leads to an increase of hydro generation in other hours, the impact on
hydro decreases when evaluated at daily or weekly levels. In contrast, the im-
pact on gas, coal and lignite generation increases, as hydro power is likely to
replace fossil generation. As the shift of hydro generation in time likely leads
13Figure 4. Marginal Replacement Effect by Model Specification
Notes: Shown are marginal replacement effect for different model specification. FE are spec-
ification with different fixed effects. Congestion includes the congestion dummy. Weekly and
Daily are estimates based on resampled data. Main denotes aour core estimate.
to an additional emission offset, we also report the emission offset based on the
sample with weekly resolution to provide an upper bound on the emission offset.
FUNCTIONAL FORM—–Figures A.1 to A.3 in the Appendix show how the
impact of German RE on conventional generation depends on (i) the demand
level in each country, and (ii) the level of RE generation in Germany. We make
three main observations. First, our core estimate mostly lies within the range of
our semi-parametric results, indicating that a more flexible functional form that
accounts for non-linear effects does not substantially alter our results. Only in
the case of hydro power in Germany and Austria, there is no overlap between the
core and the semi-parametric estimate, but the latter suggest a larger impact
of German RE on hydro power. Second, we find that the impact on gas and
coal increases in demand while the impact on lignite and nuclear decreases in
demand. This agrees with our expectation as in high demand hours the more
expensive technologies, i. e., gas or coal are marginal, while in low demand hours
lignite and nuclear are the marginal technologies. Third, regarding the impacts
of different levels of German RE, we find that values are often significantly
different for the first decile. However, as RE generation values in this decile
only go up to 3.5 GWh (compared to maximum values of more than 60 GWh
in the highest decile), it is likely that these very low values lead to a distortion
of marginal impacts.
4.3. Impacts on Emissions
Table 6 shows the average impact of German RE on annual carbon emissions
over the period. We distinguish between two cases: The first two rows show
the results for our core specification using hourly data. The second two rows
provide the results for an alternative specification using weekly data and thus
taking into account inter-temporal impacts of hydro power generation. This can
be interpreted as an upper bound of the total emissions impact.
14Table 6. Annual emission offset of German RE by technology and country [MtCO2 ]
DE AT BE CZ DK FR NL PL Total
Hourly 63.84 0.65 0.65 4.93 1.22 1.83 3.84 1.67 78.62
sample (1.34) (0.05) (0.06) (0.16) (0.07) (0.16) (0.20) (0.18) (2.00)
Weekly 99.10 1.19 - 6.45 1.23 1.89 2.81 0.15 112.83
sample (9.87) (0.27) - (0.67) (0.46) (0.63) (0.60) (0.07) (11.35)
Notes: The average annual offsets correspond to ∆Eir as defined in equation (9). Sweden has
no fossil generation and is thus not shown here. Heteroscedasticity robust standard errors in
parentheses.
In our core specification, German RE induced an average annual emission
offset of 78 million tons of CO2 in the years form 2015 to 2020, i.e., around
one ton of carbon per German inhabitant. The emissions impact was highest in
Germany, where more than 80 % of the total offset took place. The cross-border
emission impact is the largest in countries with high coal and lignite capacities,
i.e., the Czech Republic and the Netherlands. Although the Polish generation
mix is rather emission intense, the cross-border impact is limited due to the
limited interconnector capacity. In France we observe a relatively large impact
on gas generation leading to a moderate emission impact. In Denmark and
Belgium the impact of German RE on conventional generation is generally low.
Finally, in Austria mostly hydro power is replaced, leading to a small emissions
impact.
Alternatively using the weekly resolution of our sample, the total emission
impact increases to an average offset of 112 million tons of CO2 per year. The
increase is mostly caused by an increase of the offset in Germany followed by
the Czech republic and Austria. For Denmark and France altering the sample
resolution does not affect the emission impact. For the remaining countries
the emission impact even decreases. One should however note that in these
countries hydro capacities are rather limit (see Table 3).
5. The Merit-Order Effect: Impact of RE on Electricity Prices
5.1. Marginal and Total Impacts
What was the impact of German RE on domestic and neighbourings elec-
tricity prices? Table 7 presents the marginal impacts, i. e., the impact of one
GWh of German RE, as well as total impacts on hourly wholesale market prices
(see equation 7). To put them into perspective, we also show the relative price
impacts compared to a hypothetical situation without German RE. These price
effects have a close connection to the replacement effects presented in the pre-
ceding section. First, price impacts are naturally increasing in the absolute and
relative amount of generation replaced. Second, as the merit-order curve usually
has a convex shape, the price impact becomes larger in countries where fossil
generation is replaced.
As the replacement effect mostly affects German generation, we observe the
highest impacts on domestic electricity prices, which decrease by 14e/MWh. In
the surrounding countries, the highest cross-border merit-order effect takes place
in the Czech Republic (11e/MWh) followed by Denmark (10e/MWh). In both
15Table 7. Price impacts of German RE
DE CH BE CZ DK FR NL PL SE
βr [e/MWh per GWh] -0.88 -0.39 -0.18 -0.70 -0.62 -0.28 -0.34 -0.03 -0.24
(0.02) (0.01) (0.03) (0.02) (0.02) (0.02) (0.01) (0.01) (0.01)
∆pr [e/MWh] -13.92 -6.11 -2.88 -10.98 -9.78 -4.35 -5.32 -0.46 -3.76
(0.38) (0.24) (0.41) (0.28) (0.32) (0.25) (0.23) (0.20) (0.20)
∆p%
r [%] -40.18 -12.75 -6.42 -23.03 -23.21 -9.74 -11.85 -1.02 -10.90
Notes: βr refers to the coefficients of equation (2). ∆pr is given by equation (7). The relative
∆pr
impact is definded as ∆p% r := p −∆p , where pr are annual means of observed prices.
r r
countries, we observe—relative to their market size—a substantial replacement
of fossil generation, inducing a large price impact.10
Somewhat smaller but still substantial impacts are observed in all other
countries except for Poland: In the Netherlands and France, the price decreases
by 5 and 4e/MWh, respectively. Although the total replacement effect in these
countries is similar or even higher compared to the Czech Republic, it is smaller
relative to the market size. This can explain the lower price impact. The
price impacts in Sweden (4e/MWh) and Belgium (3e/MWh) are also lower.
Relying and hydro and nuclear power, Swedish wholesale market prices are
generally low. Belgium is not directly connected to Germany, leading to a low
replacement and, thus, low price impact. For Switzerland, we observe an impact
of 6e/MWh per GWh. As we do not observe Swiss electricity generation, we
have no information about the replacement effect. However, Swiss electricity
prices are usually determined by its neighbors. This explains the price impact,
which is between the impact on German and French prices.
Finally, the impact on the Polish price is very low (less than 1e/MWh). This
is consistent with the very low replacement effects due to limited interconnector
capacities. In addition, Poland is one of the largest electricity markets, and
Polish electricity prices seem to develop independently of other central European
countries (see Figure 2).
Also in relativ terms we find the highest impact on Germany itself: With-
out RE generation, the average electricity price would have been around 40%
lower. Again, Germany is followed by Denmark and the Czech Republic (23%).
For Switzerland, Belgium, France, the Netherlands, and Sweden, the impact of
German RE lies between 6 and 13%. For Poland it is with around 1% negligible.
5.2. Robustness Checks
We provide two types of robustness checks: different fixed effects, and changes
in the functional form to account for non-linear effects.
FIXED EFFECTS—–Table A.7 in the Appendix shows the results for alterna-
tive specifications using different sets of fixed effects. We would like to point
out three issues: First, our results seem rather stable to the inclusion of dif-
ferent time fixed effects. Second, compared to the specifications without fixed
effects, month-of-sample (month x year) fixed effects have the biggest impact
10 Although the absolute replacement effect in Denmark is very low, this can have a sub-
stantial impact on the price, as the Danish electricity market is comparably very small.
16on the results. As we include them them to control for unobserved variables
such as installed capacities as well as reconfiguration of the Austrian-German
price zone, the impact on the results is expected. Third, for Poland we observe
positive impacts on the price for different specifications. The Polish impact is
small in all cases and varies around zero. We therefor conclude, that there is no
robust impact of German RE on Polish wholesale market prices.
FUNCTIONAL FORM—–Figure A.4 shows the results of the semi-parametric
estimations for all countries. The results are generally close to our core esti-
mates. As in the case of the replacement effect, the coefficients on German RE
become very volatile in the lowest decile for German RE. In this decile, RE
generation is very low and even near zero, which likely distorts the coefficient.
6. German Renewable Support and the Cost of Offseting Carbon
Emissions
6.1. Measuring Consumer and Producer Impacts
An increase in German RE generation leads to a decrease of electricity prices
and conventional generation in Germany and its surrounding countries. More-
over, German consumers are affected by a surcharge on electricity consumption
to refinance the cost of RE subsidies.11 To determine the impact of German
RE on the rents of consumers and producers, and to provide an estimate of the
average cost of carbon offsets, we calculate the different cost components.
We define the change in consumer rents, ∆π C as the decrease in annual costs
of purchasing electricity, which is calculated by evaluating the estimated merit-
order effect at the average annual electricity demand. In the case of Germany,
we add the refinancing cost paid by consumers, R:
∆πrC := ∆pr dr [+R]if r=DE ,
where dr is the average of annual load over the period 2015 to 2020. Again,
we rely on the assumption of inelastic short-term electricity demand. Annual
payments of German consumers to refinance RE subsidies, R, are provided by
Netz-Transparenz (2021).12
Changes in producers’ profits are determined by both, decreasing prices and
generation. As the generation decrease also leads to an unobserved decrease in
generation cost, we follow Abrell et al. (2019) approximating profit losses with
a lower and an upper bound:
(
∆pele
P
P Lower bound: r q ir
∆πr := Pi ele
,
Upper bound: i ∆p r (q ir + ∆qir )
where q ir is the observed mean annual generation of technology i over the year
2015 to 2020. The lower bound assumes that producers are only affected by the
decreasing wholesale price, ∆pr . In contrast, the upper bound of profit losses
includes additional losses due to the reduction of output (∆qir < 0).
11 These cost are known as differential cost and defined as the cost of RE subsidies net of
the income obtained from selling RE to the market.
12 At the time of writing, data for 2020 are not available. We therefore use data from the
17Table 8. Cost of German RE Promotion [Billion e]
DE CH BE CZ DK FR NL PL SE Total
Cost -6.56 -0.3 -0.22 -0.79 -0.28 -2.18 -0.49 -0.07 -0.57 -11.46
Refinancing 23.3 - - - - - - - - 23.3
Consumers
Total 16.74 -0.3 -0.22 -0.79 -0.28 -2.18 -0.49 -0.07 -0.57 11.84
Lower 7.22 - 0.22 0.85 0.28 2.24 0.44 0.07 0.57 11.89
Producers Upper 8.47 - 0.22 0.92 0.3 2.3 0.47 0.07 0.58 13.33
Lower bound 23.96 -0.3 0 0.06 0 0.06 -0.05 0 0 23.73
Total Upper bound 25.21 -0.3 0 0.13 0.02 0.12 -0.02 0 0.01 25.17
Notes: The table provides estimates of the average annual cost of German renewable energy
support over the period 2015 to 2020. For consumers, we provide decreases in the cost of
electricity purchases together with payed surcharges to refinance RE subsidies. For producers,
we show profit losses.
6.2. The Impact of German RE on Consumers and Producers
Table 8 provides our estimates of the average annual cost of German RE
support on consumers and producers in Germany and its neighbors over the pe-
riod 2015 to 2020. Total costs are the sum of changes in consumer and producer
rents. In total, German RES caused annual costs of about 23.7 to 25.2 billion e.
These costs are roughly equally split between consumers and conventional pro-
ducers. Producers incurred losses between 11.9 up to 13.3 billion e. Consumers
cost of electricity decrease by 11.5 billion e, but due to the annual refinancing
charge of 23.3 billion e payed by German consumers, consumers incurred an
overall average cost of 11.84 billion e per year.
With domestic costs of 24 to 25.5 billion e per year, Germany carries almost
the entire cost. Looking at the distribution between producers and consumers,
we find that—although the cost of purchasing electricity at the wholesale market
decreases—German consumers carry the major financial burden with about two
third of the total cost as they are paying the refinancing surcharge.
In contrast, the total cost impact of German RE on surrounding countries is
negligible. As changes in consumer and producer rents are almost equally high,
total costs are close to zero for most countries. For net-importing countries (see
Table 3), the increase in consumers’ benefits exceeds the decrease in produc-
ers’ profits, leading to a net benefit. This can be observed in the case of the
Netherlands. In contrast, in net-exporting countries, the decrease in producers’
profits exceeds the increase in consumers’ benefits from German RE, inducing
a net loss for the country’s electricity sector. This result can be observed in the
Czech Republic and France.
While the total cost impacts in neighboring countries are very low, the shift
of rents between consumers and producers is substantial. In total, the cross-
border merit-order effect induces a consumer surplus of 4.9 billion e by reducing
the cost of purchasing electricity, but this effect is offset by a decrease of profits
of about the same size.
income side of the so called EEG account provided by the same source.
18Table 9. Average Cost of Emission Offset by German RE support [e/t CO2 ]
Hourly Sample Weekly Sample
Lower bound 304.76 212.35
Upper bound 320.66 223.43
Notes: Annual average abatement cost are derived as the ration of the total cost of German
RE and the estiamted average annual emission offset.
6.3. Average Cost of Emission Offset
Provided the annual emission offset (Table 6) and the cost of German RES
(Table 8), we derive the average annual cost of emission offset with German
RES as the ratio of the two. In our estimate, we ignore the beneficial effect
of carbon reduction as well as other positive effect of RE deployment such as
learning effects.
Table 9 shows our estimates. We provide values for the upper and lower
bound of the cost impacts as well as for the case of the hourly and the weekly
sample used to approximate the effect of shifting hydro power generation in
time.
For our core specification, we estimate average abatement cost of German
RES of between 305 and 321 e/tCO2 . Approximating the intertemporal effect of
hydro power, the average annual emission offset increases from 79 to 112 MtCO2
per year. Thus, average offset cost decrease to range from 212 to 223 e/tCO2 .
Our cost estimates fit well into the existing literature. Depending on the
assumption on the carbon offset by hydro generation, Abrell et al. (2019) esti-
mate a range of 105 to 276 e/tCO2 and 638 to 973 e/tCO2 for wind and solar,
respectively, for the sample period from 2010 to 2015. Gugler et al. (2021) rely
on a sample ranging from beginning 2017 to mid 2018. They find average cost
of 182 to 206 and 744 to 978 e/tCO2 for wind and solar power, respectively.
Given that during our sample period German solar power accounted for one
quarter to one third of total German RE production, and that we estimate the
combined effect of wind and solar power, our estimate is naturally at the lower
end compared to the existing literature.
7. Conclusions
Climate policies have induced a large increase in renewable energy genera-
tion across Europe, and in particular in Germany. Whereas the program cost of
renewable energy support policies were borne by the country itself, the raise in
German RE generation also affected neighboring electricity markets: Renewable
energy (RE) sources such as wind and solar replace the most expensive genera-
tors that often rely on fossil fuels and thus at the same time induce a decrease
in electricity sector emissions and wholesale market prices. In interconnected
electricity systems this so-called merit-order effect stimulates an increase in net-
exports. Thus conventional generation and prices in neighboring countries are
also likely to decrease. The impact of these trade effects depend on installed
generation and interconnector capacities.
To estimate these impacts, this paper makes use of hourly data on technology-
specific generation and wholesale market prices for ten central European coun-
tries. Using a variety of econometric specifications, we come to the following
19three main conclusions. First, German RE induced a yearly CO2 emission off-
set of around one ton per inhabitant of Germany, at an average cost of 212 to
321 e/t. In total, German RE offsets on average 79 to 113 MtCO2 per year.
Second, the major part of emission offsets was realized in Germany itself.
80 to 90% (64 to 99 MtCO2 ) of the total annual emission offset took place in
Germany itself, the rest (14 to 15 MtCO2 ) was offset in neighboring countries.
Third, German consumers bear the largest cost share of RE promotion
followed by German producers. Surrounding electricity markets were mainly
affected by decreasing wholesale market prices due to cheaper imports from
Germany. This (cross-border) merit-order effect caused a significant shift of
economic rents from producers to consumers: generators’ profits declined, while
consumers could benefit from lower costs for electricity. These effects nearly bal-
ance, but net-importing countries have a tendency to realize a slight economic
benefit from German RE as the cost of imports are decreasing.
20References
Abrell, J., Kosch, M., & Rausch, S. (2019). Carbon abatement with renewables: Eval-
uating wind and solar subsidies in germany and spain. Journal of Public Economics,
169 , 172–202.
AG Energiebilanzen (2021). Stromerzeugung nach Energietraegern 1990 - 2020 (Stand
February 2021).
Bundesnetzagentur (BNetzA) (2019). Monitoringbericht 2019 . Technical Report.
Callaway, D. S., Fowlie, M., & McCormick, G. (2018). Location, location, location:
The variable value of renewable energy and demand-side efficiency resources. Jour-
nal of the Association of Environmental and Resource Economists, 5 , 39–75.
Cludius, J., Hermann, H., Matthes, F. C., & Graichen, V. (2014). The merit order
effect of wind and photovoltaic electricity generation in germany 2008-2016: Esti-
mation and distributional implications. Energy Economics, 44 , 302 – 313.
Cullen, J. (2013). Measuring the environmental benefit of wind-generated electricity.
American Economic Journal: Economic Policy, 5(4), 107–133.
ECAD (2020). European Climate Assessment & Data.
EIKON (2017). Thomson reuters EIKON database.
ENTSO-E (2021). Transparency platform.
Fell, Harrison, D., Kaffine, K., & Novan (2021). Emissions, transmission, and the
environmental value of renewable energy. American Economic Journal: Economic
Policy, 13 , 241–72.
Gugler, K., & Haxhimusa, A. (2019). Market integration and technology mix: Evi-
dence from the german and french electricity markets. Energy policy, 126 , 30–46.
Gugler, K., Haxhimusa, A., & Liebensteiner, M. (2021). Effectiveness of climate
policies: Carbon pricing vs. subsidizing renewables. Journal of Environmental Eco-
nomics and Management, 106 , 102405.
Haxhimusa, A. (2018). The Effects of German Wind and Solar Electricity on French
Spot Price Volatility: An Empirical Investigation. Department of Economics Work-
ing Papers wuwp258 Vienna University of Economics and Business, Department of
Economics.
ICE (2021). ICE EUA Futures.
IPCC (2006). Revised 1996 IPCC Guidelines for National Greenhouse Gas Inventories.
IPCC.
LaRiviere, J., & Lu, X. (2020). Transmission constraints, intermittent renewables and
welfare.
Netz-Transparenz (2021). www.netztransparenz.de/eeg/jahresabrechnungen.
Novan, K. (2015). Valuing the wind: renewable energy policies and air pollution
avoided. American Economic Journal: Economic Policy, 7 , 291–326.
Perino, G. (2018). New EU ETS Phase 4 rules temporarily puncture waterbed. Nature
Climate Change, 8 , 262–264.
Phan, S., & Roques, F. (2015). Is the depressive effect of renewables on power prices
contagious? a cross border econometric analysis. Cambridge Working Papers in
Economics, .
Schnaars, P. (2019). The real substitution effect of renewable electricity: An empirical
analysis for germany. In Available at SSRN .
UBA (2017). Daten und Fakten zu Braun- und Steinkohle.
Wuerzburg, K., Labandeira, X., & Linares, P. (2013). Renewable generation and
electricity prices: Taking stock and new evidence for Germany and Austria. Energy
Economics, 40 , S159–S171.
21You can also read