Urban Development and Land Markets in Chennai, India
←
→
Page content transcription
If your browser does not render page correctly, please read the page content below
142 Urban Development and Land Markets in Chennai, India

                    INTERNATIONAL REAL ESTATE REVIEW
                                               2008 Vol. 11 No. 2: pp. 142 – 165

Urban Development and Land Markets in
Chennai, India
David E. Dowall ∗
Director, Institute of Urban and Regional Development, Department of City and
Regional Planning, the University of California, Berkeley, CA 94720-1870; Tel: (510)
642-6579; Fax: (510) 642-9576; E-mail: dowall@berkeley.edu

Paavo Monkkonen
Department of City and Regional Planning, the University of California, Berkeley, CA
94720-1870; Tel: (510) 338-9251; Fax: (510) 642-9576; E-mail: paavo@berkeley.edu

The metropolitan area of Chennai, India, presents an interesting case study
on India’s transforming economy because it has a unique urban structure for
an Indian city of its size. It has an extremely high population density at the
city center that is becoming even more crowded. It is also experiencing rapid,
but low-density, expansion at the periphery. This paper documents Chennai’s
spatial development with detailed data on land use, population density, and
land values. A hedonic regression on the price of land suggests that de facto
policy differences between political jurisdictions have had a significant effect
on land prices. However, the data presented in this paper suggest that land
policy reforms in Chennai have been successful in reducing some of the
sprawling urban development patterns evident in the 1970’s and 1980’s.
Nevertheless, policymakers in Chennai continue to face the double challenge
of an extremely dense urban core combined with extensive urban growth.

Keywords
South Asia; India; Urban Spatial Structure; Population Density; Land Markets; Land
Policy

∗
    Corresponding author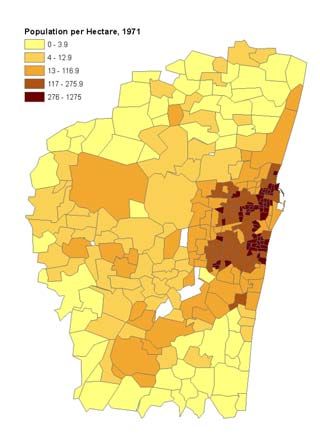
Dowall and Monkkonen          143

1.     Introduction

A growing amount of research has been done on urban land and housing markets in
India in recent years. 1 Over the past five years alone, detailed studies have been
carried out on urban land market dynamics in the cities of Mumbai, Bangalore, and
Delhi. Taken together, these studies provide detailed assessments of urban land
development in India. They also explore the various effects of urban planning and
development control regulations on the spatial development of the country’s leading
urban regions. This paper adds to this discussion by providing an assessment of the
land market from data on land values rather than focusing on policy. In addition, it
provides four decades of detailed, spatially disaggregated information on land use,
population, and land values for the metropolitan area. The research presented in this
paper uncovers evidence that Chennai exhibits a unique pattern of spatial
development for an Indian city of its size; the population in its already dense city
center continues to grow, while, simultaneously, the metropolitan area expands in a
low density pattern on the periphery.

Research for this paper was conducted as a land market assessment in the Chennai
Metropolitan Area (CMA) as a joint effort of the World Bank, the Chennai
Metropolitan Development Authority (CMDA), and the Department of Geography at
the University of Madras. The study was initiated in June 2003, and the underlying
methodology and approach was provided by Dowall (1995). 2 The CMDA was
responsible for compiling detailed land use archival information for the metropolitan
area and interpreting IKONOS satellite images for 2001. The CMDA also built the
socio-economic and housing database, linking together information on population,
households, and dwelling units from Government of India Censuses. The University
of Madras’s Department of Geography was responsible for carrying out the extensive
surveys of real estate brokers in the metropolitan area.

The paper is divided into four sections. The first section provides a brief background
on the city of Chennai in the context of contemporary Indian urbanization. The
second section explores population trends and spatial patterns of population density,
comparing Chennai to other Indian cities. Following that, the trends and spatial
patterns of land use are described and analyzed. The next section presents data on the
price of residential and industrial land, including a hedonic regression on the price of
land in residential plots. The paper concludes with a summary of key findings.

1
  See for example Bertaud and Bruekner (2005); Sivam (2002); Besley and Burgess (2000);
and Bertaud, Buckley and Owen (2003).
2
  For the detailed study design and work program for the Chennai project see Dowall (2003).
144 Urban Development and Land Markets in Chennai, India

2.       Background
Chennai is the fourth largest metropolitan area in India, with a population of about 7
million in 2001. Located in the state of Tamil Nadu, Chennai is the most important
city in southern India. In its formative years, Chennai served as the capital of the
Madras Presidency and was its main administrative and commercial center. In more
recent times, Chennai has been designated as the capital of the state of Tamil Nadu.
The city has a diversified economic base, with well-developed industrial and tertiary
sectors. Chennai is the main automobile production and assembly center in India,
and it is gaining momentum as a back-office and IT center.

Chennai is located on the southeastern coast of India on the Bay of Bengal. The
metropolitan area comprises the Chennai City Corporation (CCC), 16 municipalities,
20 Special Grade Village Panchayats, and 214 villages. The total land area is 1,189
square kilometers. The urbanized area extends approximately 50 kilometers from
north to south and 30 kilometers from east to west. The area of the Chennai City
Corporation is much smaller, about 20 kilometers from north to south and about 12
kilometers from east to west.

Like other large India cities, Chennai is growing fast economically and
demographically (see Tables 1 and 2). The economy of Chennai grew by 13% per
year at an annual compound average basis between 1990-1901 and 2002-2003.
Population growth in Chennai and other large Indian cities has also increased
rapidly. Between 1981 and 2006, the population of Chennai grew by 2.3% per
annum. While this figure is robust, it is less than the overall growth rates for Indian
cities, which is 2.99%.

Table 1           State Net GDP in Current Prices (Millions of USD of Selected
                  Indian States)

                                                                             Annual %
                                    1990-       1995-      2000-    2002-     Change
       State             City       1991        1996       2001     2003     1991-2003
      Gujarat         Ahmedabad     5,388       13,755    20,025    26,406       13.0
     Karnataka         Bangalore    4,579       11,147    20,796    22,371       12.9
Andhra Pradesh        Hyderabad     6,655       15,997    28,146    32,352       12.9
     Tamil Nadu        Chennai      6,166       15,534    28,087    30,135       13.0
       Delhi             Delhi      2,282       5,667     12,826    15,318       15.8
 Maharashtra        Mumbai         12,954       31,356    46,834    57,717       12.2
Source: Reserve Bank of India, www.rbi.org.in
Note: The website of the Reserve Bank of India informs that because of differences in the
      method of compilation, these are not “strictly comparable” between states.
Dowall and Monkkonen 145
In many ways, Chennai, like Mumbai, Delhi, and Bangalore, is a globalization
“hotspot.” It is a magnet for considerable foreign direct investment and economic
transformation. However, in addition to global forces, the metropolitan restructuring
of Chennai and other Indian cities also depends on local agencies to manage growth
(Shaw and Satish, 2006). In return, the manner in which Indian cities accommodates
new businesses and migrants, while trying to improve environmental quality and
housing affordability, will determine their future regional competitiveness. Those
that fail to manage urban growth as well as foreign investment will see congestion,
land and real estate inflation, and declining urban service quality, factors that will
reduce urban productivity.
Table 2 Population and Compound Annual Growth Rates of Selected Cities
in India, 1981 – 2006
City/Area 1981 1991 2001 2006 CAGR
Ahmadabad 2,548,057 3,312,216 4,519,278 5,600,000 3.20%
Hyderabad 2,545,836 4,344,437 5,533,640 6,700,000 3.95%
Bangalore 2,921,751 4,130,288 5,686,844 7,100,000 3.62%
Chennai 4,289,347 5,421,985 6,424,624 7,600,000 2.31%
Delhi 7,456,474 11,679,596 17,829,980 19,700,000 3.96%
Mumbai 9,281,877 12,596,243 16,368,084 19,850,000 3.09%
All urban
India* 158,851,000 217,254,000 288,283,000 331,729,000 2.99%
Source: City Population website, Brinkoff http://www.citypopulation.de/India.html and UN-
Habitat Global Urban Observatory http://www.unchs.org/programmes/guo/guo_citibase.asp
*These figures are from 1980, 1990 2000, and 2005, respectively.
Most large cities in India have had very restrictive land use policies and regulations,
including the urban land ceiling act, rent control, the uniform low floor space index
(FSI), public sector dominance of the real estate market, and an inadequate provision
of urban infrastructure (CMDA, 2004). Chennai is somewhat different because it has
partially liberalized its land policies, and it recognizes the role of the private sector in
the development of housing and real estate. At the same time, it still has rent control
and a very low FSI (1:1.5). These regulations, combined with inadequate
infrastructure service coverage, are especially problematic in the areas more than 10
kilometers outside the CMA (Dahiya, 2003). They might even be one of the key
causes of the city’s unusually high density trends. Another possible factor is that
during the colonial period, the British subdivided Chennai, then known as Madras,
into large plots for colonial administrators (Evanson, 1989).
2.1 Trends in Spacial Distribution of Population and Density
The population of the CMA doubled between 1971 and 2001, from 3.5 million to 7
million. However, over the 30-year period, the rate of population growth actually146 Urban Development and Land Markets in Chennai, India
fell. Owing to suburban growth, Chennai’s metropolitan population became less
concentrated in the center of the city. In 1971, the CCC accounted for 75% of the
region’s population, but by 2001, that share had decreased to 62%.
Table 3 Population Trends in Chennai City, Its Suburbs and the
Metropolitan Area, 1971 - 2001
Area 1971 1981 1991 2001
Chennai City Corporation 2,642,000 3,285,000 3,843,000 4,343,000
Suburbs 860,000 1,313,000 1,964,000 2,690,000
Total Chennai
Metropolitan Area 3,502,000 4,598,000 5,807,000 7,033,000
Source: CMDA, 2006.
The core of Chennai, the area within five kilometers of the central railway station,
accounted for 50% of the region’s population in 1971. By 2001, the core’s share had
declined to 31%, but in absolute terms, its population increased by more than
400,000 (see Table 4). In contrast, the ring just beyond the core, extending out to a
distance of 10 kilometers, increased in both absolute terms, by 1.44 million people,
and, in percentage terms, from 27% to 34%.
Table 4 Population by Distance from the City Center and Percent
Distribution in 1971 – 2001
Distance 1971 % 1981 % 1991 % 2001 %
0-5 1,757,206 50 1,998,165 43 2,053,829 35 2,189,532 31
6-10 943,368 27 1,427,785 31 1,978,301 34 2,383,203 34
11-15 273,622 8 418,661 9 701,407 12 1,026,238 15
16-20 279,008 8 406,985 9 603,205 10 804,368 12
21-25 178,565 5 265,031 6 355,195 6 463,233 7
26 + 79,210 2 85,529 2 145,865 3 173,643 3
Total 3,510,979 4,602,156 5,837,802 7,040,217
Thus, the already dense center of Chennai continues to absorb population. This may
be due to the fact that there has been little redevelopment in the center city that
would have displaced population. It also suggests that housing conditions are
deteriorating, owing to overcrowding and the subdivision of existing apartments. The
population in the area six to 10 kilometers from the city center seems to have stoppedDowall and Monkkonen 147
increasing in relative terms. This leveling-off of growth might indicate that the area
has reached its density limits, and further population growth is likely to slow down.
It may also reflect the effects of more stringent FSI (1:1.50) regulations in the area.
Although Chennai is suburbanizing, the decentralization process is not due to a loss
of population in the city center, as with the decentralization patterns typical of North
American cities. Rather, the decentralization pattern observed in Chennai is the result
of the filling-in of available land, which is leading to greater density.
Table 5 Population, Urban Land Development, and Gross Population
Density, 1971 – 2001
Year Population Urbanized land (ha) Gross population density
1971/1973* 3,505,502 25,766 136
1980/1981* 4,601,566 35,097 131
1991 5,818,479 40,743 143
2001 7,040,696 46,389 152
*The population data are from 1971 and 1981, and the land use data are from 1973 and
1980.
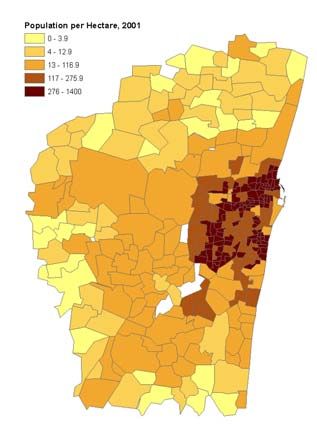
Figure 1 Diagram of Population Density (Persons per Urbanized Hectare) in
19791 and 2001148 Urban Development and Land Markets in Chennai, India
The decentralization of a city’s population is often associated with a decrease in
overall population density and a decrease in population density in the central areas of
the city. However, in the case of Chennai, the population has grown in the areas
furthest from the center, but the overall gross density has also increased. The average
gross density of the city, measured by the number of persons per urbanized hectare 3
of land, increased from 136 in 1971 to 152 in 2001, indicating that the city is
supporting a larger number of residents per hectare of land.
As demonstrated in Figure 1, the overall density of the city has increased because the
city is expanding, but in terms of density, the increase has not been large in the areas
further than 10 kilometers from the city center. Many zones have seen slight
increases from very low densities of less than 13 persons per hectare to between 13
and 120 persons per hectare. However, the population density of the CCC has
increased dramatically, especially in the areas from six to 10 kilometers from the
center of the city, where it has almost doubled. Some areas of Chennai have more
than 1,000 people per hectare, which is as high as in the centers of much larger
Indian cities such as Mumbai and Kolkata.
2.2 Density gradients
A more sophisticated measure of the distribution of gross density would be the
density gradient. The density gradient is based on the standard model of urban
structure, the mono-centric city model, and empirical evidence from cities around the
world (for a review, see Mills and Tan, 1980). The density gradient describes the
density patterns of a city as falling at a negative exponential rate. It is written with
the equation:
D(x ) = d 0 e − gx
D(x) is the density at any distance x from the city center, d0 is the predicted density
at the center of the city multiplied by the exponential term, and g is the density
gradient. Thus, density falls from the predicted density of the center of the city at a
rate equal to the distance times the gradient: the larger the gradient, the faster the
density drops from the city center. Gradients in developed countries tend to be flatter
than those in developing countries, owing to higher incomes and more efficient
transportation systems. This results from an increased expenditure on lot size
(because housing is a normal good) and the higher technology and quality of
transportation systems decreasing the cost of commuting.
Table 6 illustrates two important trends in the population density of Chennai. First,
unlike most cities in developed countries, the estimated intercept (predicted
population density in the center of the city) has increased over the last 30 years. In
1971, the density was estimated at 464 persons per hectare, and by 2001, it had
3
Urbanized land is land devoted to residential, commercial, industrial, and institutional use.Dowall and Monkkonen 149
increased to 720 persons per hectare. The other, more typical, trend is that the
metropolitan region’s population density gradient has flattened out, declining from -
.207 to -0.183 in 2001. Individual t-tests of means for the coefficients of decade pairs
show that they are significantly different from one another at the 0.01 level.
Table 6 Population Density Gradients, 1971 – 2001
Year Intercept (d0) Gradient (g) R2
-0.207
1971 464 0.741
(-28.766)
-0.206
1981 613 0.763
(-30.540)
-0.190
1991 648 0.759
(-30.123)
-0.183
2001 720 0.717
(-29.940)
Note: All coefficients significant to the .01 level. T-statistics are in parenthesis. The
t-test of the difference of means between decade pairs yields the following t-ratios:
1971 and 1981, 10.3; 1981 and 1991, 187.6; and 1991 and 2001, 90.7,
In Chennai, the flattening of the density gradient occurs together with an increasing
density in the center of the city. This combination suggests that the flattening of the
gradient is due to population growth and increased availability of transportation,
rather than from growth in household income and the suburbanization documented in
developed countries.
2.3 Comparison density gradients
According to Brush (1968), Chennai had a lower density gradient than other Indian
cities of a comparable size in 1961 (see Table 7). During that time, it also had a
lower gross density at the city center than the comparable cities of Hyderabad and
Ahmedabad. In Brush’s study of the spatial structure of Indian cities, he
demonstrated that the larger cities in India tended to have lower density gradients,
finding an average gradient of 0.376 for the larger 12 urban areas studied, and an
average gradient of 0.779 for the smaller 12 urban areas studied.
Over the last 40 years, the population density of Chennai has changed in a very
different way from that of comparable Indian cities. It has gone from having a much
lower central city density and density gradient than Hyderabad or Ahmedabad to
having a much higher central city density and density gradient. This change is due to
increasing density in the central city. In fact, in some parts of central Chennai, the
gross density is even higher than that of Mumbai, a city almost three times its size.150 Urban Development and Land Markets in Chennai, India
Table 7 Population and Density Data for Selected Indian Cities in 1961
Persons per acre in
City Population city center Density gradient
Bombay 4,152,056 390 .099
Madras 1,729,141 270 .164
Hyderabad 1,129,345 332 .243
Ahmedabad 1,155,344 437 .504
Bangalore 864,203 224 .273
Source: Brush, 1968.
Over the same period, the central city density of Chennai has increased at a faster
rate than the population has suburbanized while in comparable cities, populations
have suburbanized significantly. Chennai’s density gradient has a much higher
intercept value (more than 600 persons per hectare) than those of Hyderabad,
Ahmedabad, or Bangalore. The curve of the gradient is also much steeper. Figure 2
presents the density gradients for these cities.
Figure 2 Density Gradients for Chennai, Hyderabad, Ahmedabad, and
Bangalore
Chennai Hyderabad
800 800
Density (persons per hectare)
Density (persons per hectare)
600 600
400 400
;
200 200
0 0
0 5 10 15 20 25 30 0 5 10 15 20 25 30
Distance from City Center (km) Distance from City Center (km)
Ahmedabad Bangalore
800 800
Density (persons per hectare)
Density (persons per hectare)
600 600
400 400
200 200
0 0
0 5 10 15 20 25 30 0 5 10 15 20 25 30
Distance from City Center (km) Distance from City Center (km)Dowall and Monkkonen 151
3. Land Use
Together with population growth and density trends, land use is another key
determinant of land market outcomes and performance. The overall land use patterns
of the Chennai Metropolitan Area (CMA) are comparable to those found in other
large coastal plain areas – a dense center district with radial development along
principal transportation corridors. As with trends in population growth, the CMA has
experienced a steady decrease in the rate at which it urbanizes land. Although these
numbers should not be used as a comparison of the last 20 years, 4 it is clear that the
rate of growth in hectares of urban land has decreased.
Table 8 Total Land Area and Urbanized Land Areas in Chennai from 1973 to 2001
Compound
Average
Percent of Absolute annual
Total annual
Urbanized total land increase in growth
land increase in
land (ha) urbanized urbanized rate of
(ha) urbanized
(%) land (ha) urbanized
land (ha)
land (%)
1973 115,333 25,766 22
1980 115,333 35,097 30 9,331 1,333 4.5
1991 115,333 40,743 35 5,646 513 1.4
2001 115,333 46,389 40 5,646 565 1.3
Currently, about 40% of the total land area within the Chennai Metropolitan Area is
urbanized. Within the Chennai City Corporation, however, between 80% and 100%
of the land is urbanized (Figure 3), and it has probably reached the upper limits of
urbanization because of zoning, land use regulations, and government ownership.
There has been a sharp drop in the percentage of urbanization beyond the area of the
old city, which is due to the dominance of the fort area (which is mostly open space),
the river corridor, and the coastal strand. The percentage of urbanized land flattens
out between five and 10 kilometers from the city center and then declines, indicating
that peripheral land is mostly undeveloped.
4
An important caveat about this table is that the data recorded by the CMDA for 1991 were
not consistent with methods used in 1981 and 2001. So the data we present here for 1991 are
actually a calculated average between 1981 and 2001. This means that we cannot comment
with certainty about recent trends in land use.152 Urban Development and Land Markets in Chennai, India
Figure 3 Percentage of Zone Urbanized by Distance from the City Center in
1971 and 2001
100%
90%
Percent of land urbanized
80%
70%
1971
60%
1981
50%
1991
40%
2001
30%
20%
10%
0%
1 3 5 7 9 11 13 15 17 19 21 23 25 27 29 31
Distance from city center (km)
The vast majority of urban land conversion over the last four decades occurred
outside of the CCC. Between 1973 and 1980, the areas between 11 and 15 kilometers
and between 21 and 25 kilometers from the city center underwent the most drastic
changes, together making up about 60% of the land converted to urban use. During
this period, land in the 16 to 20 kilometer zone was converted to urban use at a
disproportionately low rate. However, from 1981 to 2001, the pattern of land
conversion was more in line with what would be expected. Almost a third of the
urbanized land in the CMA was between 11 and 15 kilometers of the city center,
directly outside the CCC. Beyond this distance, the rate of conversion decreased
proportionately. It seems that the areas furthest from the city center were still not yet
being urbanized at an appreciable rate.
The result of these trends in population and conversion of land to urban use is that
the number of people per hectare urbanized has increased. If the present trend
continues, with the amount of land urbanized per person continuing to decrease, the
current decade should see less land converted to urban use per person. In the current
decade, only about 2,500 hectares of land will be converted to urban use in Chennai,
about half as much as the previous decade.
3.1 Residential Land
About 72% of urbanized land on average is devoted to residential use, and this ratio
increases significantly the further away from the city center one gets (see Figure 4).
While a higher ratio of the urbanized land in the city center is devoted to institutional
and commercial use, land devoted to residential use still predominates with the
exception of those areas within two kilometers of the city center. Less land at aDowall and Monkkonen 153
distance of 12 kilometers from the city center is devoted to residential use because
more of it is used for industrial purposes.
Figure 4 Percentage of Urbanized Area Dedicated to Residential Use by
Distance from the City Center
120%
Percentage of urbanized area
dedicated to residential use
100%
80% 1973
1980
60%
1991
40% 2001
20%
0%
1 3 5 7 9 11 13 15 17 19 21 23 25 27 29 31
Distance from city center
3.2 Industrial Land
The spatial pattern of industrial land use in the CMA seems very erratic (Figure 5).
Until recently, there were appreciable concentrations of land dedicated to industrial
uses at four, 12, and 15 kilometers from the city center, the largest by far being at 12
kilometers, where more than half the urbanized area was dedicated to industrial use.
In recent years, industrial centers have sprung up at much further distances from the
city center. This reflects the suburbanizing trend of industrial activity throughout
India. In 2001, industrial use took over a significant percentage of urban areas at a
distance of 17, 21, 24, and 27 kilometers from the city center. Industrial activity in
the center of the city has also increased in recent decades.
3.3 Agricultural Land
The observed amount of agricultural land per zone by distance from the center of
Chennai is consistent with the theoretical intuition that land is converted from
agricultural to urban use when potential rents from urbanization exceed current
agricultural rents (Figure 6). Thus, as Chennai increases in population, more land is
needed for housing and other urban uses. It is therefore subsequently converted away
from agricultural uses to residential and other uses. Although land is not converted in
a direct linear relationship by distance from the city center, there is an observable
trend.154 Urban Development and Land Markets in Chennai, India
Figure 5 Percentage of Urbanized Area Dedicated to Industrial Use by
Distance from the City in 1979 and 2001
80%
Percentage of urbanized area
dedicated to industrial use
60%
1973
1980
40%
1991
2001
20%
0%
1 3 5 7 9 11 13 15 17 19 21 23 25 27 29 31
Distance from city center
The conversion of land to urban use is often influenced by government regulation.
The doubling of the percentage of land used in agriculture at the border of the CCC
between 1981 and 1991 suggests that there was a non-market force preventing the
conversion of land away from agricultural use beyond the CCC. This was no longer
the case in 2001. The pattern of land use in 2001 was more similar to that predicted
by economic models of urban areas, i.e., a gradual increase by distance from the
center city, rather than a jump between two levels at the border of the CCC.
Figure 6 Percentage of Zone Dedicated to Agriculture by Distance from the
City Center in 1971 and 2001
Percentage of zone Agricultural
100%
80%
60% 1980
1991
40%
2001
20%
0%
1 3 5 7 9 11 13 15 17 19 21 23 25 27 29 31
Distance from city centerDowall and Monkkonen 155 Much more land was converted away from agricultural use between 1991 and 2001 than in the previous decade. Additionally, more land has been taken out of agricultural use than has been incorporated into urban use, roughly 41,000 hectares versus about 6,000 hectares. While some of this large discrepancy might be due to problems with the data (see footnote 7), this is a potentially significant problem. One possible cause is land speculation – the purchase of land for later development – which can be problematic for even urban growth. More detailed research in this area is needed to clarify matters. 3.4 Discussion The urbanization patterns of the most recent decade, 1991 – 2001, follow the theoretical predictions of land use driven by market forces more closely more than those of previous years. Chennai went through a period of significant sprawl between 1971 and 1991, when less land was urbanized in the zone 11 to 15 kilometers from the city center than the area beyond, possibly reflecting the influential role of the state. However, in the more recent 20-year period, this was the area that experienced the most rapid rate of conversion from agricultural to urbanized use. This makes sense, as it is the area directly outside the CCC, which should absorb urban growth as the central city reaches its full capacity. Also, industry has finally started suburbanizing to areas more than 12 kilometers from the center of the city. There is no longer a huge increase in the amount of land dedicated to agriculture in the area directly outside the CCC. Rather, there has been a gradual increase outward. However, the fact that almost seven times more land was taken out of agricultural use than was converted to urban use between 1991 and 2001 might be cause for concern. In addition to less government intervention, investments in infrastructure may have had an impact on the spatial pattern of urban land development. 4. The Price of Land The price of land in Chennai varies considerably by location, the level of infrastructure, and surrounding land use. The most expensive land is that purchased in serviced residential plots in the city center, while the cheapest is in un-serviced residential parcels on the outskirts of the city. Industrial land falls somewhere in between. In the following sections, we compare the effects of different attributes on the price of land in residential and industrial use. The significant factors that influence land prices are distance, access to infrastructure, development approval, and some elements of the zone in which land is located – its jurisdiction, the level of urbanization, and recent growth. The University of Madras’s Department of Geography was responsible for carrying out the extensive surveys of real estate brokers in the metropolitan area. The survey methods followed procedures and guidelines outlined in Dowall (1995). At least three brokers were interviewed in each analysis zone. The median value of the three responses was utilized in the statistical analysis.
156 Urban Development and Land Markets in Chennai, India

4.1   Residential Land

The mean price of land in a residential plot in the CMA in 2003 was about 8,200
rupees per square meter, and in 2004, it increased to 9,250 rupees per square meter.
Unfortunately, we do not have a more complete historical dataset, and a comparison
of land prices over two years does not lead to conclusive evidence of trends because
land prices often fluctuate significantly. We will therefore focus on prices in 2004.
We can draw several conclusions from the land price dataset that we have generated.
One relates to the effects of distance from the city center on land prices. Another
relates to the effects of infrastructure and development regulations on land values.
We will start with distance.

Decreasing land values based on distance from the city center is the most widely
accepted and demonstrable insight of the mono-centric city model. In the CMA, the
price of land drops increasingly the further it is located from the city center (Figure
7). Residential land prices in the city center (within the 0 to 5 kilometer range),
however, are lower than in the next ring. This runs contrary to the general notion that
land is most valuable in the center of a city. It is probably due to the poor
environment and the poor conditions of the housing stock in the older parts of town.
The rapid decline in land price beyond 10 kilometers from the city center may be
because being located in the CCC is considered a positive factor associated with
urban services of a higher quality. Additionally, it could reflect the higher market
potential for plots inside the central 10 kilometers of the region.

Figure 7                           Mean Price of Land in Residential Plots by Distance from the City
                                   Center in 2003 and 2004

                                 14,000.0
       Rupees per square meter

                                 12,000.0
                                 10,000.0
                                  8,000.0                                                 2004
                                  6,000.0
                                  4,000.0
                                  2,000.0
                                      0.0
                                            0-5    6-10   11-15   16-20   21-25    26+
                                                  Distance from city center (Km)

The available data show that the average cost of land in residential parcels for the
area outside of the CCC in 2003 was about 1,000 rupees per square meter and 1,250
in 2004, a marginal increase of 25%. Data were not available on the price of
residential parcels within the CCC. This most likely resulted from a lack of parcel-
Dowall and Monkkonen 157
sized tracts of land in the central 10 kilometers of the CMA. Complete data were not
available on all zones outside of the CCC, probably for the same reason.
Figure 8 shows that parcel prices decrease with distance. Although the pattern seems
quite different from the price of land in residential plots, it should be noted that
Figure 8 shows data only for land outside the central 10 kilometer zone. Both
residential plots and parcels fit into three price ranges by distance. The first is land
directly outside the CCC, between 11 and 15 kilometers from the center; the second,
between 16 and 20 kilometers, and the last, the area beyond 20 kilometers.
Figure 8 Mean Price of Land in Residential Parcels by Distance from the
City Center in 2003 and 2004
2,000
Rupees per square meter
1,500
1,000 2004
500
0
11 15 16 - 20 21 - 25 26+
Distance from city center
In addition to the distance from the center of the city, the potential to develop the
land is also an important factor in determining its price. Generally, in the developing
world, the potential for development of a piece of land is indicated by its having a
clear property title and whether it is connected to infrastructure. In the case of
Chennai, approval for development and connection to infrastructure seem to be
almost inseparable, indicated by the minimal variation in price between lots that have
received development approval, infrastructure, or both.
Figure 9 shows the mean price of land in residential plots by infrastructure and
development approval. There is a very large premium on having development
approval, infrastructure, or both versus not having any formal recognition of
development potential. This is likely due to tendencies in the consolidation of
irregular housing. Once a neighborhood is able to obtain approval for development,
it becomes much easier to get infrastructure installed, and vice versa. The premium
on land with development approval and infrastructure is quite different for land sold
in parcels.158 Urban Development and Land Markets in Chennai, India
Figure 9 Mean Price of Land in Residential Plots by Infrastructure and
Development Approval in 2003 and 2004
12,000
Rupees per square meter
10,000
8,000
6,000 2004
4,000
2,000
0
Both Develop and No develop Neither
no infra and infra
Figure 10 shows the mean price of land in residential parcels by infrastructure and
development approval. There is a relatively smaller premium on infrastructure and
development approval for parcels as compared to plots though both of these factors
have an almost identical effect. This is likely due to the relatively smaller cost of
obtaining development approval and/or infrastructure for parcels than plots because
of the economies of scale.
Figure 10 Mean Price of Land in Residential Parcels by Infrastructure and
Development Approval in 2003 and 2004
2,500
Rupees per square meter
2,000
1,500
2004
1,000
500
0
Both Develop and No develop Neither
no infra and infraDowall and Monkkonen 159
4.2 Regression Analysis of Land Value of Residential Plots
Land price data were collected for different zones from surveys of real estate
brokers. Brokers listed a price of different types of land according to whether it had
infrastructure, development approval, both, or neither. Table 9 displays the summary
statistics of the data used in the regression analysis. Owing to an excess of missing
observations, land price data for parcels are not included in this section.
Table 9 Description of Land Price Data
Variable Mean Standard Deviation Minimum Maximum
Price per square foot in 2004 10,258 10,994 76.24 112,124
Infrastructure .42 .493 0 1
Development approval .38 .487 0 1
Distance from City Center 12.4 8.68 .491 31.79
Chennai Corporation .46 .499 0 1
Municipality .02 .137 0 1
Town .12 .327 0 1
Percent urban land .65 .348 .007 1
Urban change 1991 – 2001 .12 .235 -.47 .926
Percent commercial land .06 .109 0 .865
Percent industrial land .05 .106 0 .965
Three hedonic regression models were generated using the natural log of the price of
land in residential plots as the dependent variable. The first model includes only
characteristics of the plot, the second adds the jurisdiction in which the plot is
located, and the third includes characteristics of the zone in which the plot is located.
Regression coefficients for the three models run on 2004 land price data are reported
in Table 10. The models are of a log-linear form. Thus, the coefficients can be
interpreted as percentages. For example, a plot with infrastructure or development
approval has a roughly 50% higher price, all other things being equal. The models
are parsimonious and robust, explaining between 56% and 69% of the variation in
the natural log of land prices for the city of Chennai. Overall, the independent
variables have the expected signs and are consistent with urban land economic
theory. The price of land in Chennai decreases as it gets further from city center and
when it is located near industrial areas. It increases when there is access to160 Urban Development and Land Markets in Chennai, India
infrastructure, if there is development approval, and when it is located in a highly
urbanized zone.
Table 10 Hedonic Price Regression Results: Land in Residential Plots in
2004, Natural Log of the Price of Land per Square Foot in Rupees
Variables Model 1 Model 2 Model 3
.935 .808 7.17
Intercept
(77.9) (39.40) (33.18)
-.107 -.057 -.039
Distance from City Center
(-22.86) (-6.59) (-4.52)
.650 .523 .462
Infrastructure
(5.89) (4.93) (4.89)
.627 .495 .439
Development approval
(5.62) (4.64) (4.63)
1.22 .75
Chennai City Corporation
(7.55) (4.51)
.469
Municipality
(.281)
.759 .58
Town
(6.15) (4.48)
1.43
Percent urban land
(7.34)
1.06
Urban change 1991 – 2001
(6.37)
.579*
Percent commercial land
(1.66)
-1.99
Percent industrial land
(-5.93)
N 577 577 577
2
Adjusted R .56 .61 .69
*Significant to the 0.1 level;t-statistics in parenthesis
The notable feature of the land price models is the large and significant coefficient
on the two jurisdictional dummy variables for the CCC and towns. The first model
shows land prices decrease by about 11% per kilometer from the center of the city.
However, the second model shows that some of that effect is due to being within theDowall and Monkkonen 161 CCC, which is roughly the central 10 kilometers of the CMA. The coefficient of the dummy variable for the CCC shows that being under the jurisdiction of the corporation is associated with an increase of 120% in price though it drops to 75% when it is controlled for the level of urbanization, growth, and land use. In the second model, the coefficient on distance decreases significantly. Though there is some correlation between the distance from the city center and being within the CCC, the large and significant coefficient on the latter demonstrates its effects separately from the distance alone. Additionally, being located in a town also affects the price of land significantly, raising it by about 75% without controls and about 60% when controlled for land use and growth. These coefficients suggest that in addition to its location relative to the center of the city, land in these two jurisdictions has other benefits unmeasured in this regression. For example, despite the fact that the de jure FSI is constant at 1:1.5 across the CMDA region, actual observed land prices combined with previous evidence of population density, seem to indicate that de facto land use controls might be different. Moreover, higher levels of infrastructure investment or more responsive public services might be responsible for a share of the price premium. Finally, neighborhood characteristics affect the price of land significantly. Land in areas that are highly urbanized and growing tends to be more expensive than land in other areas. Plots in areas with industrial activity also have a lower price. The coefficients of these final three variables seem large because the independent variable is 1%. Thus, for example, for each percent of land area that is urbanized in a given zone, the price of land increases by about 1.5%. Similarly, for each percent of growth in urbanization of a given zone during the 1990’s, the price of land increased by about 1%. The negative coefficient of the industrial use of land shows that for each percent of an area dedicated to industrial use in a given zone, the price of land decreases by about 2%. 4.3. Industrial Land Data on the price of land in industrial plots were only available for about 40 of the 291 zones of the CMA so we cannot make generalized statements about the price of industrial land with certainty. As with the data for residential parcels, price data for industrial land inside the CCC were much less available than outside the CCC. This is logical as we have seen previously that not much land is dedicated to industrial use in the central 10 kilometer zone. Additionally, there is little or no price data available for industrial plots in this zone without development approval or infrastructure, which is also logical since most of this land is already urbanized, and previously undeveloped land is not likely to be as available. The overall price for industrial land was significantly lower than that of residential land, but higher than that of residential parcels at 2,820 rupees per square meter in 2003 and 3,380 rupees per square meter in 2004. The price gradient for this land was quite steep, perhaps steeper than that of residential plots. However, we were not able
162 Urban Development and Land Markets in Chennai, India

to regress it owing to insufficient data. Figure 11 shows the mean price of land in
industrial use by distance from the city center.

Figure 11                                       Mean Price of Land in Industrial Plots by Distance from the Ciy
                                                Center in 2003 and 2004

                                      6,000
            Rupees per square meter

                                      5,000

                                      4,000

                                      3,000                                                                2004

                                      2,000

                                      1,000

                                            0
                                                    11 15        16 - 20        21 - 25         26+
                                                              Distance from city center

We expect infrastructure and development approval to be more important for
industrial land because industrial activity needs infrastructure more than residential
land. The government is also more likely to overlook informal housing than informal
industrial use. The pattern of premium on infrastructure and development approval
seen in Figure 12 corroborates this theory though with a caveat. Having only
infrastructure or development approval does not add much value to the land.
However, having both increases the price of land by about six times.

Figure 12                                       Man Price of Land in Industrial Plots by Infrastructure and
                                                Development Approval in 2003 and 2004
                                 8,000
   Rupees per square meter

                                 6,000

                                 4,000                                                                       2004

                                 2,000

                                        0
                                                    Both      Develop and no   No develop and    Neither
                                                                   infra            infra
Dowall and Monkkonen 163 5. Conclusion This study has focused on the Chennai Metropolitan Area, which has an urban form distinct from other Indian cities of its size. Unlike other cities, it has a very dense center that continues to add population. Meanwhile, changes in land use indicate that the region is simultaneously growing in a sprawling pattern. The population growth at the periphery of the city is evident along transit corridors to the north, south, and west. In addition to the analysis of trends in the spatial form of Chennai, this paper demonstrates that it is feasible and practical to conduct detailed urban land market assessments in Indian cities and that the method can be extended to nonresidential uses. The analysis presented in this paper has two central policy implications. First, the extremely high population density in the central area of Chennai is unlike the high- rise density found in such Asian cities as Tokyo and Hong Kong. Chennai’s increasing central city population density is more a reflection of limited redevelopment and modernization. Existing residential flats now house more people, and they occupying less space. Secondly, it seems that very restrictive floor space index (FSI) regulations across the metropolitan area seem not to profoundly affect residential land price patterns, raising the question of de jure versus de facto FSI regulatory control. Factors such as development approval and infrastructure provision have a highly significant positive effect on land prices, especially for industrial use, and the combination of these characteristics increases the value even more. The level of urbanization and recent growth near the plot in question has the expected effect on land price, and nearby industrial use decreases the price of land for residential use. Although land within five kilometers of the city center is less expensive than the land in the adjacent areas, the general price gradient is similar to empirical findings in other Indian cities. Finally, there are price effects of being located within the jurisdiction of the Chennai City Corporation or a town, which suggests that de facto land policies in these areas might be different from de jure land policies. This is an area that should be explored further. An additional direction for research concerns the possibility of rent seeking behavior on the part of landlords or other interest groups in the de facto policy. In the terminology of institutional economics, land is an asset that is highly specific. Asset specificity refers to the degree to which an asset’s value is transaction specific and often leads to problems of holdups or the possibility of extracting economic rents from an asset because of its specificity. This phenomenon has been extensively studied in literature on industrial organizations (Williamson, 1983). In the case of land, a classic example is the owner of one small parcel in a larger redevelopment area being able to sell it for many times the actual value of the land. Further work on the connection between areas could follow recent models of rent seeking in economic growth models or land titling agencies (Leung, et al., 2006; Monkkonen, 2008). This is related to work in the United States on the connection between the
164 Urban Development and Land Markets in Chennai, India

local regulation of land use based on incentives to raising home values (Fischel,
2001).

The data presented in this paper suggest that some trends have been are changing in
recent years. Land policy reforms in Chennai seem to have been successful in
changing some patterns of urban development during the 1990’s. However,
policymakers in Chennai continue to face a double challenge: an extremely dense
urban core and a sprawling pattern of development.

Acknowledgements

We received excellent technical support and cooperation from the Master Plan Unit
of the Chennai Metropolitan Development Authority, and from the Department of
Geography at the University of Madras as well as from Peter Ellis, Sonia Hammam,
and Abha Joshi-Ghani at the World Bank. An anonymous reviewer also provided
useful comments on the paper. Research support for this paper was provided by
Cities Alliance, a joint World Bank-United Nations program.

References

Bertaud, A., Buckley, R., and Owens, K. (2003). Is Indian urban policy
impoverishing? World Bank Urban Symposium: Washington, D.C.

Bertaud, A. and Brueckner, J. (2005). Analyzing building-height restrictions:
Predicted impacts and welfare costs, Regional Science and Urban Economics 35, 2,
109-125.

Bertaud, A. and Malpezzi, M. (1999). The spatial distribution of population in 35
world cities: The role of markets, planning and topography, Center for Urban Land
& Economic Research, University of Wisconsin: Madison, WI.

Besley, T. and Burgess, R. (2000). Land reform, poverty reduction, and growth:
evidence from India, The Quarterly Journal of Economics, 115, 2, 389-430.

Brush, J. (1968). Spatial patterns of population in Indian cities, Geographical
Review, 58, 3, 362-391.

Chennai Metropolitan Development Authority. (2004). Development control rules
for Chennai Metropolitan Area, CMDA: Chennai.
Dowall and Monkkonen        165

Chennai Metropolitan Development Authority. (2005). Second Master Plan for the
Chennai Metropolitan Area. CMDA: Chennai.

Dahija, B. (2003). Peri-urban environments and community driven development:
Chennai, India, Cities, 20, 5, 341-352.

Dowall, D. (1995). The land market assessment: A new tool for urban management,
Washington and Nairobi: Urban Management Program.

Dowall, D. (2003). Chennai urban land market assessment study design and scope
of work, prepared for the World Bank: Washington, D.C.

Energy and Infrastructure Unit, South Asia Regional Office. (2002). India: Urban
sector strategy, The World Bank: Washington, D.C.

Evenson, N. (1989). The Indian metropolis: A view toward the west, Yale University
Press: New Haven, CT.

Fischel, W. (2001). The home voter hypothesis, Harvard University Press:
Cambridge, MA.

Leung, C., Tang, S., and Groenewold, N. (2006). Growth volatility and technical
progress: a simple rent-seeking model, Journal of Economics (Zeitschrift fur
Nationalokonomie) 88, 2, 159-178.

Mills, E. and Tan, J. (1980). A comparison of urban population density functions in
developed and developing countries, Urban Studies, 17, 313-321.

Monkkonen, P. (2008). Land regularization in Tijuana, Mexico, Institute of Urban
and Regional Development Working Paper 2008-01.

Shaw, A. and Satish, M. (2006). Metropolitan restructuring in post-liberalized India:
Separating the global and the local, Cities (forthcoming).

Sivam, A. (2002). Constraints affecting the efficiency of the urban residential land
market in developing countries: A case study of India. Habitat International 26,
523–537.
You can also read