Coastal Hazard Vulnerability Assessment - The Beach, Apollo Bay Australian Tourism Investments No. 5 Pty Ltd - Colac Otway Shire
←
→
Page content transcription
If your browser does not render page correctly, please read the page content below
Coastal Hazard Vulnerability
Assessment
The Beach, Apollo Bay
Australian Tourism Investments No. 5 Pty Ltd
27 March 2019

Document Status
 Version Doc type Reviewed by Approved by Date issued
 V01 Report CJB EAL 27/03/2019

 Project Details
 Project Name The Beach, Apollo Bay
 Client Australian Tourism Investments No. 5 Pty Ltd
 Client Project Manager Bernard Stewart
 Water Technology Project Manager Chris Beadle
 Water Technology Project Director Elise Lawry
 Authors Oliver Nickson
 Document Number 3300-39_R01v01

 COPYRIGHT

 Water Technology Pty Ltd has produced this document in accordance with instructions from Australian Tourism
 Investments No. 5 Pty Ltd for their use only. The concepts and information contained in this document are the copyright of
 Water Technology Pty Ltd. Use or copying of this document in whole or in part without written permission of Water
 Technology Pty Ltd constitutes an infringement of copyright.

 Water Technology Pty Ltd does not warrant this document is definitive nor free from error and does not accept liability for
 any loss caused, or arising from, reliance upon the information provided herein.

 15 Business Park Drive
 Notting Hill VIC 3168
 Telephone (03) 8526 0800
 Fax (03) 9558 9365
 ACN 093 377 283
 ABN 60 093 377 283
3300-39_R01v01

 Australian Tourism Investments No. 5 Pty Ltd | 27 March 2019
 The Beach, Apollo Bay Page 1
CONTENTS
 GLOSSARY AND DEFINITIONS 4

 1 INTRODUCTION 5
 1.1 Site Details 5

 2 GEOMORPHOLOGY AND COASTAL PROCESSES 9
 2.1 Geomorphology 9
 2.2 Land Subject to Inundation Overlay 10

 3 REGIONAL EXPOSURE ASSESMENT 11
 3.1 Mean Sea Level 11
 3.1.1 Shoreline Response to Sea Level Rise 11
 3.2 Astronomical Tide 13
 3.3 Storm Tides 14
 3.4 Waves & Wave Run-up 17

 4 HISTORICAL SHORELINE CHANGE 20

 5 COASTAL HAZARDS 21
 5.1 Coastal Erosion 21
 5.2 Coastal Inundation 24
 5.3 Stormwater & Runoff 25

 6 COASTAL HAZARD RISK ASSESSMENT 27
 6.1 Overview 27
 6.2 Coastal Inundation Hazard 27
 6.3 Coast Erosion (including Short Term & Long-Term Coastal Recession) 28

 7 MITIGATION OPTIONS 30

 8 CONCLUSION 31

 9 REFERENCES 32

 10 DEFINITIONS AND DISCLAIMERS 33

 APPENDICES
 Appendix A Risk Assessment Definitions

 LIST OF FIGURES
 Figure 1-1 Site Location 6
 Figure 1-2 Great Ocean Road Cross Section: Marriners Lookout Rd Chainage 0 to Wild Dog Creek
3300-39_R01v01

 Road Chainage 1240 6
 Figure 1-3 View of Site Looking North-East along Great Ocean Road (Image Courtesy of Google
 Streetview (15/03/2019) © 7
 Figure 1-4 Site Layout (Beveridge Williams, 2018) 8

 Australian Tourism Investments No. 5 Pty Ltd | 27 March 2019
 The Beach, Apollo Bay Page 2
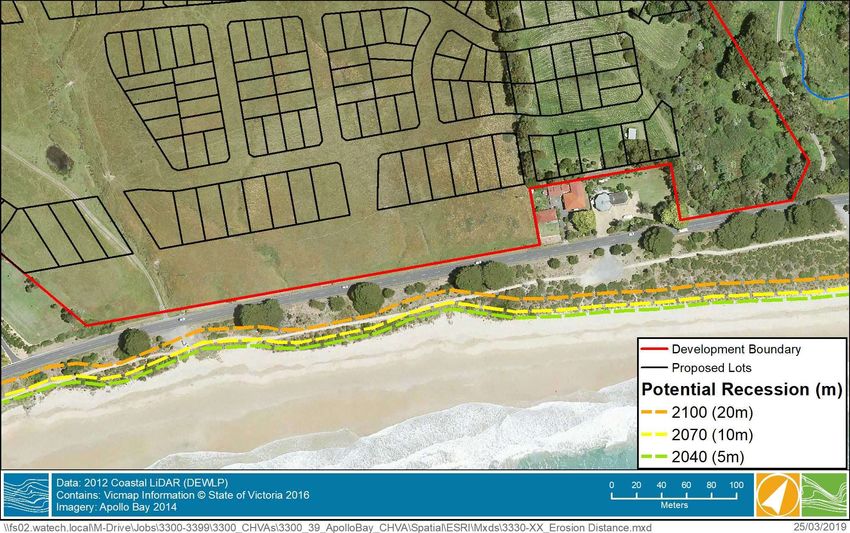
Figure 2-1 Overview of Coastal Geomorphology (Water Technology, 2012) 9
 Figure 2-2 Land Subject to Innundation Overlay for the Region Surrounding the Site 10
 Figure 3-1 Bruun Rule – Potential Future Shoreline Recession \ 12
 Figure 3-2 Predicted MHHW Extents at the Proposed Development for Various Sea Level Rise
 Scenarios (excluding wave run-up) 13
 Figure 3-3 Storm Tide Components (CSIRO, 2009) 14
 Figure 3-4 1% AEP Storm TIde Levels and Cross Section Locations 15
 Figure 3-5 Cross Section 1 Profile and 1% AEP Storm Tide Levels 15
 Figure 3-6 Cross Section 2 Profile and 1% AEP Storm Tide Levels 16
 Figure 3-7 Cross Section 3 Profile and 1% AEP Storm Tide Levels 16
 Figure 3-8 Cross Section 4 Profile and 1% AEP Storm Tide Levels 16
 Figure 3-9 Wave Sources and Directions Affecting Victorian Coastline 17
 Figure 3-10 Estimated “Rare” Wave Run-UP Extents for Various Sea Level Rise Scenarios 19
 Figure 4-1 Vegetation Lines 1952, 1980, 1997, 2004 (CES, 2005) 20
 Figure 5-1 Coastal Erosion Impacting Car Parks and Walking Paths in Apollo Bay in 2005. 21
 Figure 5-2 Coastal Inundation Impacting the Great Ocean Road in Apollo Bay (G. Mc Pike 2005) 22
 Figure 5-3 Surveyed Cross section comparison - Apollo Bay between Milford St & Joyce St (Image
 source: GHD,2018) 23
 Figure 5-4 Development Access Points (image couresty of Beveridge Williams, 2019) 24
 Figure 5-5 Development Access Routes (image couresty of Beveridge Williams, 2019) 25
 Figure 5-6 Site Contours and Development Drainage Network (Beveridge Williams, 2016) 26

 LIST OF TABLES
 Table 3-1 Sea Level Rise Scenarios (VCC, 2014; DPCD, 2012) 11
 Equation 3-1 Bruun Rule Equation 11
 Table 3-2 Recession due to Sea Level Rise (metres) 11
 Table 3-3 Estimate of High Water Levels for Different Sea Level Rise Scenarios (m AHD) 13
 Table 3-4 CSIRO Storm Tide Levels Incorperating Mean Sea Level Rise Sceanarios 14
 Table 3-5 Offhsore Significant Wave Heights 17
 Table 3-6 Wave Run-up 18
 Table 5-1 Storm Erosion at Apollo Bay (GHD, 2018) 23
 Table 6-1 Coastal Inundation Risk Assesment Results (Residential Lots) 28
 Table 6-2 Coastal Inundation Risk Assesment Results (Access Roads) 28
 Table 6-3 Coastal Erosion Risk Assessment Results (Residential Lots) 29
 Table 6-4 Coastal Erosion Risk Assessment Results (Access Roads) 29
 Table 7-1 Potential Climate Change Adaption Pathwyas 30
 Table A-10-1 Likelihood Ranking 35
 Table A-10-2 Consequence Ranking 35
 Table A-10-3 Risk Assessment Matrix 35
 Table A-10-4 Risk Profile Definition 35
3300-39_R01v01

 Australian Tourism Investments No. 5 Pty Ltd | 27 March 2019
 The Beach, Apollo Bay Page 3
GLOSSARY AND DEFINITIONS
 AHD Australian Height Datum. 0m AHD approximately corresponds to mean sea level
 AEP Annual Exceedance Probability: The measure of the likelihood (expressed as a
 probability) of an event equalling or exceeding a given magnitude in any given year
 Astronomical tide Water level variations due to the combined effects of the Earth’s rotation, the
 Moon’s orbit around the Earth and the Earth’s orbit around the Sun.
 Exceedance The probability of an extreme event occurring at least once during a prescribed
 probability period of assessment is given by the exceedance probability. The probability of a 1
 in 100 year event (1% AEP) occurring during the first 25 years is 22%, during the
 first 50 years the probability is 39% and over a 100 year asset life the probability is
 63%.
 HAT Highest Astronomical Tide: the highest water level that can occur due to the effects
 of the astronomical tide in isolation from meteorological effects.
 Holocene Geological epoch beginning approximately 12,000 years ago. It is characterised by
 warming of the climate following the last glacial period and rapid increase in global
 sea levels to approximately present day levels.
 MHHW Mean Higher High Water: the mean of the higher of the two daily high waters over a
 long period of time. When only one high water occurs on a day this is taken as the
 higher high water.
 MSL Mean Sea Level: the long-term average level of the sea surface.
 Significant wave The average of the highest one third of all waves.
 height
 Storm surge The meteorological component of the coastal water level variations associated with
 atmospheric pressure fluctuations and wind setup.
 Storm tide Coastal water level produced by the combination of astronomical and
 meteorological (storm surge) ocean water level forcing.
3300-39_R01v01

 Australian Tourism Investments No. 5 Pty Ltd | 27 March 2019
 The Beach, Apollo Bay Page 4
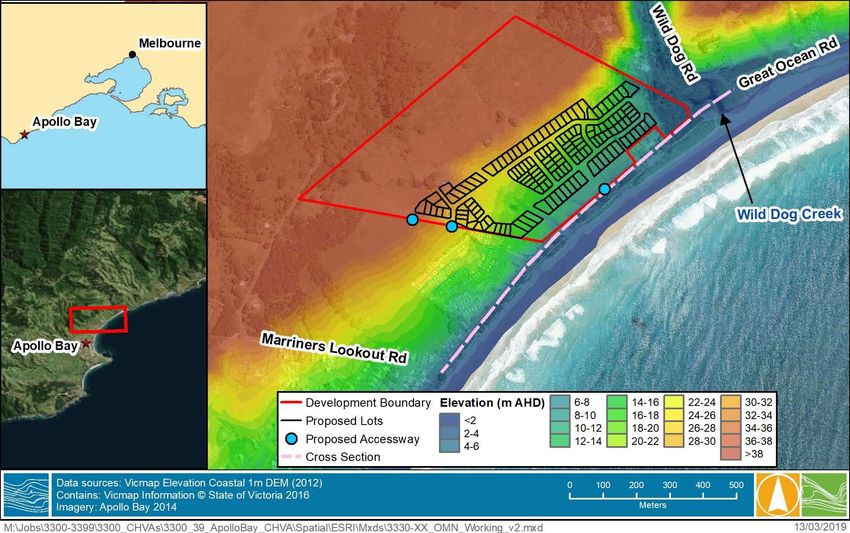
1 INTRODUCTION Water Technology was engaged by the owner of the property at The Beach Development, Apollo Bay, Victoria to undertake a Coastal Hazard Vulnerability Assessment (CHVA) to define the extent of existing coastal hazards and potential future coastal hazards associated with climate change and sea level rise at the proposed new development site. The assessment has been undertaken in accordance with the following advisory documentation and information: The Marine and Coastal Act 2018 Victoria's Marine and Coastal Reforms Final Transition Plan (DELWP, 2018) The Victorian Coastal Strategy (VCC, 2014) Derivation of Revised Victorian Sea-Level Planning Allowances Using the Projections of the Fifth Assessment Report of the IPCC (Hunter, 2014) How to consider sea level rise along the Victorian Coast (DSE, 2008) The Effect of Climate Change on Extreme Sea Levels along Victoria’s Coast (CSIRO, 2009) State Planning Policy Framework, Amendment VC148 Clause 13.01 The Victorian Coastal Hazards Guide (DSE, 2012) Practice Note 53: Managing Coastal hazards and the Coastal Impacts of Climate Change (DPCD, 2012) Guidelines for Coastal Management Authorities: Assessing Development in Relation to Sea Level Rise (DSE, 2012) Coastal Hazards Management Plan for Marengo to Skenes Creek (Water Technology, 2012) Marengo to Wild Dog Creek Sand Management Plan (Water Technology, 2017) Apollo Bay – Coastal Protection Study (GHD, 2018) 1.1 Site Details The proposed development (site) is located in Apollo Bay on Victoria’s western coastline as illustrated in Figure 1-1. The development comprises a series of residential building lots, open spaces, drainage ways and roads as detailed in Figure 1-4. The site is situated immediately landward of the Great Ocean Road (GOR) and is bounded by Wild Dog Creek to the north and an existing developed holiday park to the south. Along the sites seaward boundary the development contains a 50m wide buffer zone of open grassed space and undeveloped drainage reserve that rises from an elevation of around 4 – 5m AHD to an elevation of around 7m AHD or higher. It should be noted that the north-eastern corner of the site contains a drainage reserve that is intended to provide a buffer to the low lying flood plain of Wild Dog Creek. The development site is situated beneath Mariners Lookout and slopes upwards in a landwards direction to 158m AHD on the sites north western boundary. The residential lots within the proposed development are to be situated between elevations of 6.5 – 40m AHD. The proposed buildings are to be constructed on land which is no lower than 6.5m AHD, resulting in Finished Floor Levels (FFL) greater than this elevation as a minimum. The main access way to the site is from the Great 3300-39_R01v01 Ocean Road as shown in Figure 1-1, the pink dotted line represents the cross section presented Figure 1-2. To the west of the site the elevation of the Great Ocean Road to Marriners Lookout Road is 3.5 – 4.4 m AHD whilst to the east of the site the elevation of the Great Ocean Road to Wild Dog Road is 3.3m AHD to 4.1m AHD (see Figure 1-2). Two new roads/accessways are proposed on the southern site boundary at elevations of 25m AHD and 40m AHD respectively (see Figure 1-1). Australian Tourism Investments No. 5 Pty Ltd | 27 March 2019 The Beach, Apollo Bay Page 5
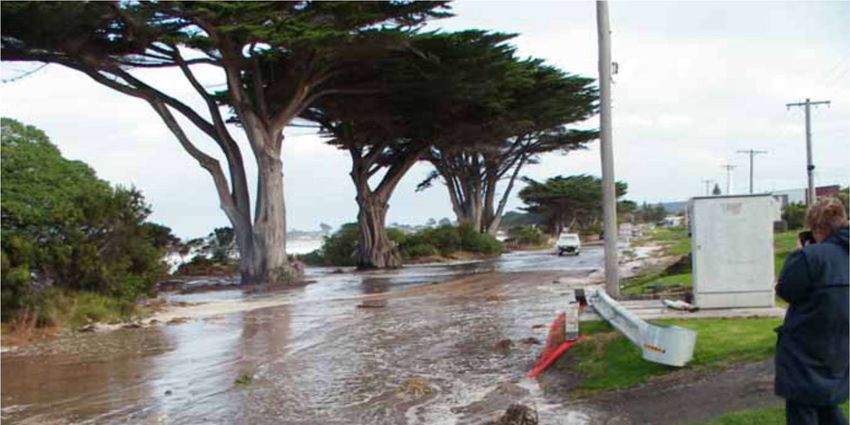
FIGURE 1-1 SITE LOCATION

 FIGURE 1-2 GREAT OCEAN ROAD CROSS SECTION: MARRINERS LOOKOUT RD CHAINAGE 0 TO WILD DOG
 CREEK ROAD CHAINAGE 1240
3300-39_R01v01

 Australian Tourism Investments No. 5 Pty Ltd | 27 March 2019
 The Beach, Apollo Bay Page 6
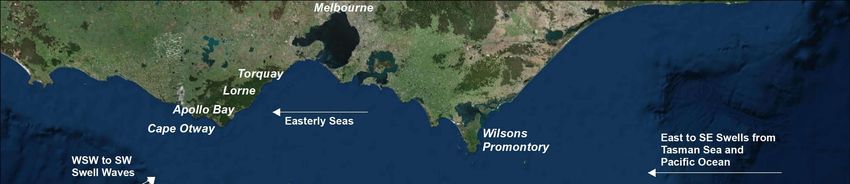
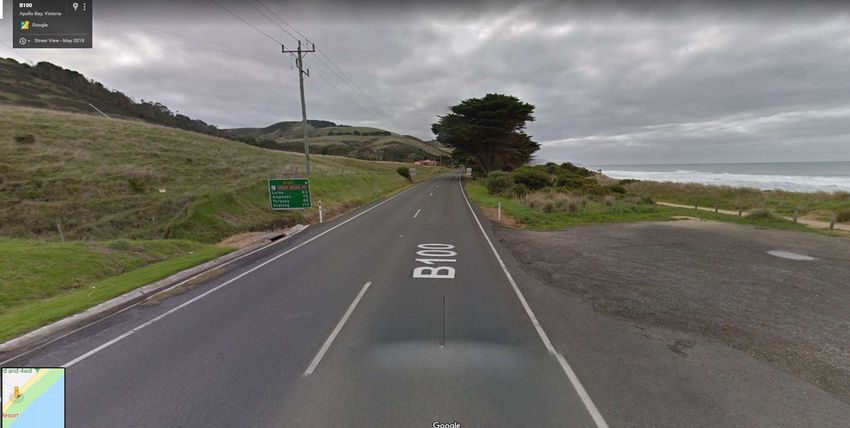
FIGURE 1-3 VIEW OF SITE LOOKING NORTH-EAST ALONG GREAT OCEAN ROAD (IMAGE COURTESY OF
 GOOGLE STREETVIEW (15/03/2019) ©
3300-39_R01v01

 Australian Tourism Investments No. 5 Pty Ltd | 27 March 2019
 The Beach, Apollo Bay Page 7

3300-39_R01v01

 FIGURE 1-4 SITE LAYOUT (BEVERIDGE WILLIAMS, 2018)

 Australian Tourism Investments No. 5 Pty Ltd | 27 March 2019
 The Beach, Apollo Bay Page 8
2 GEOMORPHOLOGY AND COASTAL PROCESSES
 2.1 Geomorphology
 To provide context to the coastal vulnerability assessment the underlying geomorphology of the area has been
 reviewed in conjunction with the coastal and riverine processes impacting the development site.

 Apollo Bay is located at the foot of the Otway Ranges which are comprised of uplifted Cretaceous sedimentary
 formations that sit at an elevation of roughly 300m above sea level. The Cretaceous sediments contain a large
 concentration of feldspar, the eroded sediments of which do not supply large quantities of sand sized
 sediments to the coastline. As such, the sediments found within the littoral zone of the sand bars, beaches and
 dune system in the region are predominately comprised of marine sediment that has drifted shoreward from
 the floor of Bass Straight following the end of the last glacial phase and subsequent marine transgression.

 Between Apollo Bay and Wild Dog Creek, a crenulate shaped bluff exists behind the present-day shoreline
 which was likely formed during the relatively higher sea level conditions of the mid Holocene (6,000-7,000
 years before present). The fall in mean sea level which occurred after the mid Holocene has birthed the
 present-day dune and beach system located seaward of this earlier shoreline this is shown in Figure 2-1. The
 net sediment transport along the present-day coastline is in a north east direction, predominantly driven by
 south westerly swell waves.
3300-39_R01v01

 FIGURE 2-1 OVERVIEW OF COASTAL GEOMORPHOLOGY (WATER TECHNOLOGY, 2012)

 Australian Tourism Investments No. 5 Pty Ltd | 27 March 2019
 The Beach, Apollo Bay Page 9
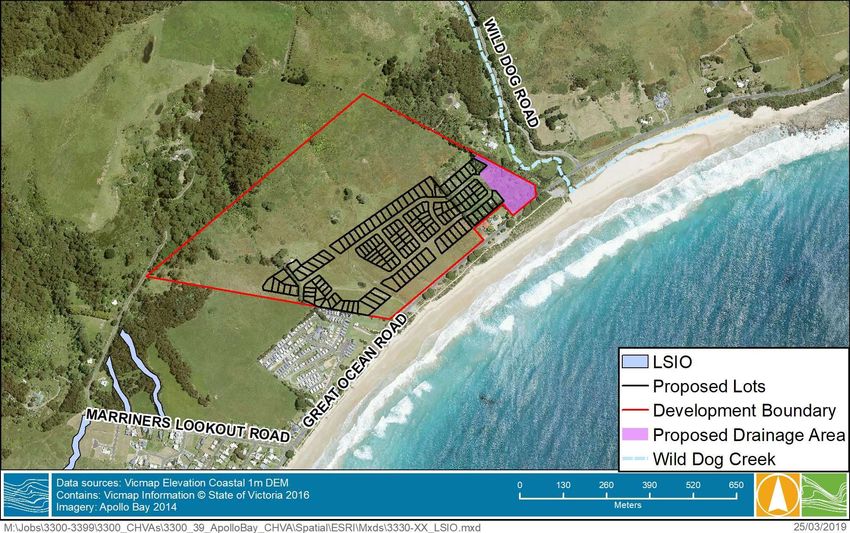
2.2 Land Subject to Inundation Overlay
 An overview of the Colac Otway Planning Scheme (2018) indicates that the property is situated outside of the
 Land Subject to Inundation Overlay (LSIO) (Victorian State Government, Planning Maps Online). A portion of
 land to the south west of the site within the vicinity of Mariners Lookout Road is covered by the overlay as
 shown within Figure 2-2. The absence of the LSIO near Wild Dog Creek may indicate that there has been no
 flood study completed for this area. However, given the close proximity of the development to the creek
 entrance, it is likely that creek flood levels in the vicinity of the development would be dictated by the
 downstream (storm tide) flood levels. The area of the development adjacent to the creek entrance has been
 reserved as a drainage basin, with elevations up to 6.5 m AHD. Consequently, the development is not expected
 to be adversely affected by ocean flooding via Wild Dog Creek.

 FIGURE 2-2 LAND SUBJECT TO INNUNDATION OVERLAY FOR THE REGION SURROUNDING THE SITE
3300-39_R01v01

 Australian Tourism Investments No. 5 Pty Ltd | 27 March 2019
 The Beach, Apollo Bay Page 10
3 REGIONAL EXPOSURE ASSESMENT
 The following assessment identifies the magnitude and frequency of the main oceanographic processes
 impacting the coastline in the region under existing conditions and under the 2040, 2070 and 2100 climate
 change predictions.

 3.1 Mean Sea Level
 Table 3-1 provides a summary of relevant sea level rise scenarios for planning. Estimates of sea level rise by
 Hunter (2014), incorporating the IPCC 2014 A1F1 climate change scenario, predict an increase in the mean
 sea level of 0.8 m by 2100. This scenario is considered to meet the minimum sea level rise scenario for
 planning as per the Victorian Coastal Strategy (VCC, 2014).

 Practice Note 53 from the Department of Environment, Land, Water and Planning (DELWP, 2015) also notes
 the following amendment to the State Planning Policy Framework:

 “In planning for possible sea level rise, an increase of 0.2 metres over current 1 in 100 year flood levels by
 2040 may be used for new development in close proximity to existing development (urban infill)”.

 TABLE 3-1 SEA LEVEL RISE SCENARIOS (VCC, 2014; DPCD, 2012)

 Scenario and Year
 2040 High 2070 High 2100 High
 Global Mean Sea Level Rise (m) 0.2 0.47 0.82

 3.1.1 Shoreline Response to Sea Level Rise
 To investigate potential future coastal recession due to sea level rise, the Bruun Rule (Bruun, 1962), Equation
 3-1, has been used. This equation considers the active beach profile to be in equilibrium; with sea level rise
 S (m) accompanied by an equal rise in the bed elevation. The Bruun Rule and resulting setback distances
 should be used with caution and considering the limitations listed below. The setback is indicative and
 approximate only and is calculated for an idealised undisturbed beach profile.

 The active profile is defined by a length, L (m), and maximum depth, or depth of closure h d (m), beyond which
 sediment transport is not considered to occur. The additional cross sectional area of sand on the bed is taken
 from the dry beach and dune of height, f (m), resulting in a recession of R (m). The results of the Bruun Rule
 analysis are presented in Table 3-2 along with the estimated active beach slope which was derived from
 existing topographic data and extrapolated to the depth of closure.

 EQUATION 3-1 BRUUN RULE EQUATION
 = ( . )/(ℎ + )

 TABLE 3-2 RECESSION DUE TO SEA LEVEL RISE (METRES)

 Recession (m) Scenario and Year
 Active Profile 2040 High 2070 High 2100 High
3300-39_R01v01

 Active Beach Slope = 1:21 (V:H) 5 10 20

 A graphical representation of the Bruun Rule results is presented below within Figure 3-1.

 Australian Tourism Investments No. 5 Pty Ltd | 27 March 2019
 The Beach, Apollo Bay Page 11
FIGURE 3-1 BRUUN RULE – POTENTIAL FUTURE SHORELINE RECESSION \

 These results should also be considered within the limitations in the application of the Bruun Rule (from Mariani
 et al, 2012):
 1. The rule assumes that there is an offshore limit of sediment exchange or a ‘closure depth’, beyond which
 the seabed does not rise with sea level.
 2. The rule assumes no offshore or onshore losses of sand.
 3. The rule assumes instantaneous profile response following sea level change.
 4. The rule assumes an equilibrium beach profile where the beach may fluctuate under seasonal and storm-
 influences but returns to a statistically average profile (i.e. the profile is not undergoing long-term
 steepening or flattening). This being stated, the precise configuration of the profile is irrelevant provided it
 is maintained as the water level changes (SCOR, 1991).
 5. The rule does not accommodate variations in sediment properties across the profile or profile control by
 hard structures such as substrate geology or adjacent headlands or engineered structures such a the
 Great Ocean Road.
3300-39_R01v01

 Australian Tourism Investments No. 5 Pty Ltd | 27 March 2019
 The Beach, Apollo Bay Page 12
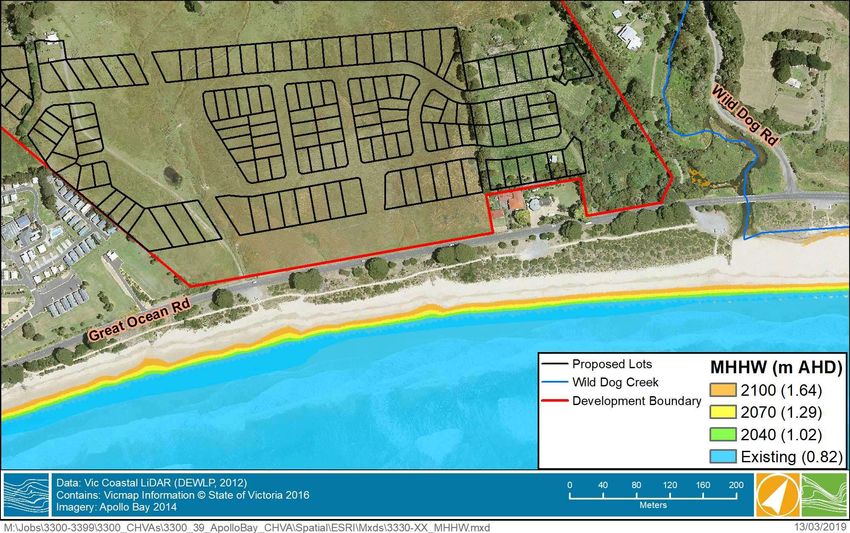
3.2 Astronomical Tide
 Astronomical tide refers to the rise and fall of the sea surface due to the gravitational attraction between Earth,
 Moon and Sun. Water level variations in coastal areas due to the astronomical tide can be reliably predicted
 provided a reasonable length of continuous water level observations is available.

 Tidal plane information from Apollo Bay was adopted as listed in the Victorian Tide Tables (VRCA, 2018). The
 Mean High High Water (MHHW) and the Highest Astronomical Tide (HAT) have been combined with the
 applied sea level rise scenarios for 2040, 2070 and 2100 shown in Table 3-1 and are listed in Table 3-3.

 TABLE 3-3 ESTIMATE OF HIGH WATER LEVELS FOR DIFFERENT SEA LEVEL RISE SCENARIOS (M AHD)

 m AHD Existing 2040 2070 2100
 HAT 1.09 1.29 1.56 1.91
 MHHW 0.82 1.02 1.29 1.64

 The predicted extent of the MHHW tidal planes under existing, 2040, 2070 and 2100 sea level scenarios on
 the Victorian Coastal LiDAR (2012) topographical elevation for the proposed development site are presented
 below in Figure 3-2. Note that these are still water inundation extents, and can be considered as indicative
 only, as the extent of inundation will depend on the shape of the beach profile, which evolves and fluctuates
 over time.

 FIGURE 3-2 PREDICTED MHHW EXTENTS AT THE PROPOSED DEVELOPMENT FOR VARIOUS SEA LEVEL
3300-39_R01v01

 RISE SCENARIOS (EXCLUDING WAVE RUN-UP)

 Australian Tourism Investments No. 5 Pty Ltd | 27 March 2019
 The Beach, Apollo Bay Page 13
3.3 Storm Tides
 The term storm tide refers to coastal water levels produced by the combination of astronomical and
 meteorological ocean water level forcing. The meteorological component of the storm tide is commonly
 referred to as storm surge and collectively describes the variation in coastal water levels in response to
 atmospheric pressure fluctuations and wind setup. The storm tide components are presented in Figure 3-3.

 FIGURE 3-3 STORM TIDE COMPONENTS (CSIRO, 2009)

 Estimates of extreme coastal water levels (storm tides), including the impact of the projected sea level rise
 within Table 3-1, have been developed for the Victorian coastline by the CSIRO (2009) for different planning
 and sea level rise scenarios. The storm tide levels for Apollo Bay that have been adopted for this study and
 are presented in Table 3-4.

 Levels for existing (2019) and 2040 are interpolated from the existing at the time of the report (2009), 2030,
 and 2070 values. Note that the future scenarios increase by values larger than the sea level rise projections
 given in Table 3-1 as they also include an additional allowance for future storm intensification. Wave setup and
 runup values are not included within these storm tide levels and are addressed within Section 3.4.

 TABLE 3-4 CSIRO STORM TIDE LEVELS INCORPERATING MEAN SEA LEVEL RISE SCEANARIOS

 AEP (%) Existing 2040 High 2070 High 2100 High
 (m AHD) (m AHD) (m AHD) (m AHD)
 10 1.20 1.40 1.71 2.13
 5 1.33 1.53 1.82 2.25
 2 1.44 1.65 1.95 2.36
 1 1.52 1.73 2.04 2.46

 The estimated inundation extents from the 1% AEP storm tides are displayed in Figure 3-4. The locations of
 the cross sections shown in Figure 3-5 to Figure 3-8 are indicated by the pink dotted line within Figure 3-4.
 The cross sections illustrate the variations in topography across the site. These figures indicate that the
3300-39_R01v01

 projected still water level storm tide does not extend beyond the vegetation line along the site’s south-eastern
 boundary on top of the dune system. However, areas in the north-eastern section of the property along Wild
 Dog Creek are below the 2100 1% AEP storm tide levels. The storm tide inundation in this area is due to the
 rising sea levels overtopping the banks of Wild Dog Creek for the 2100 1% AEP storm tide.

 Australian Tourism Investments No. 5 Pty Ltd | 27 March 2019
 The Beach, Apollo Bay Page 14
FIGURE 3-4 1% AEP STORM TIDE LEVELS AND CROSS SECTION LOCATIONS

 FIGURE 3-5 CROSS SECTION 1 PROFILE AND 1% AEP STORM TIDE LEVELS
3300-39_R01v01

 Australian Tourism Investments No. 5 Pty Ltd | 27 March 2019
 The Beach, Apollo Bay Page 15
FIGURE 3-6 CROSS SECTION 2 PROFILE AND 1% AEP STORM TIDE LEVELS

 FIGURE 3-7 CROSS SECTION 3 PROFILE AND 1% AEP STORM TIDE LEVELS
3300-39_R01v01

 FIGURE 3-8 CROSS SECTION 4 PROFILE AND 1% AEP STORM TIDE LEVELS

 Australian Tourism Investments No. 5 Pty Ltd | 27 March 2019
 The Beach, Apollo Bay Page 16
3.4 Waves & Wave Run-up
 The main sources of wave energy within Apollo Bay are south-westerly Southern Ocean swell waves, as well
 as shorter period swell and local sea waves generated within Bass Strait - as shown in Figure 3-9. Additional
 (less energetic) wave sources include swell waves from the Great Australian Bight, and the Tasman Sea, all
 of which are significantly attenuated by the time they round Cape Otway or Wilsons Promontory.

 GHD (2018) showed that south-westerly is the dominant wave direction offshore of Apollo Bay with waves
 propagating from this direction around 94% of the time. South easterly and easterly waves were less frequent
 and occur approximately 5% of the time. More than 70% of the waves are long period swell waves with a peak
 spectral wave period of 16‐20 seconds.

 FIGURE 3-9 WAVE SOURCES AND DIRECTIONS AFFECTING VICTORIAN COASTLINE

 GHD (2018) assessed the offshore wave climate near the study area and determined design significant wave
 heights for a range of average exceedance probabilities – as shown in Table 3-5. That study showed that
 storm events from E and SE directions have a typical wave periods of 8 to 12 seconds, whilst storm waves
 from the SW have typically have longer associated wave periods, in the range of 10 to 20 seconds.

 TABLE 3-5 OFFHSORE SIGNIFICANT WAVE HEIGHTS

 AEP (ARI) Hs off (m)

 63% (1 year) 5.2

 10% (10 years) 6.3

 5% (20 years) 6.6
3300-39_R01v01

 2% (50 years) 7.0
 1% (100 years) 7.2

 Australian Tourism Investments No. 5 Pty Ltd | 27 March 2019
 The Beach, Apollo Bay Page 17
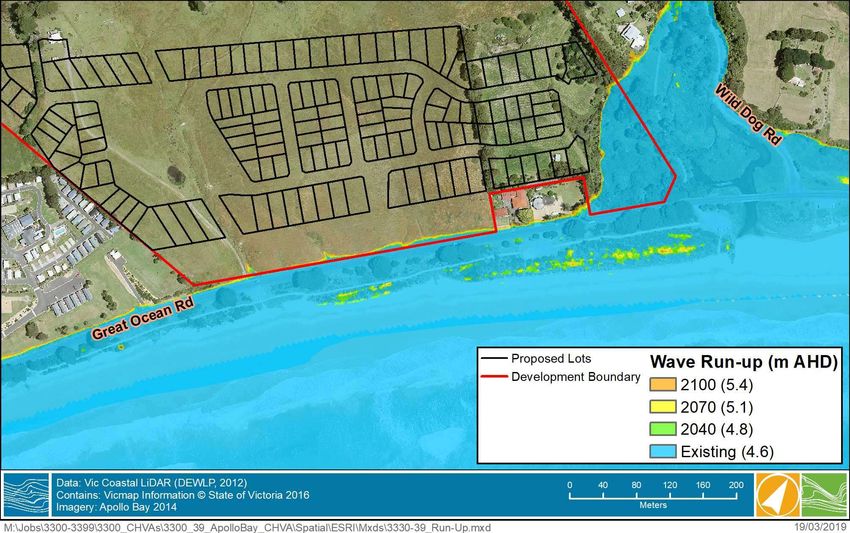
The section of Apollo Bay main beach located just north of the harbour and west of the site is sheltered from the dominant south-westerly swell wave energy by the harbour and Point Bunbury. The development, however, is located roughly 3km to the east of Point Bunbury which is more exposed and experiences a high energy wave environment leading to significant wave setup and run-up. Water Technology (2012) estimated wave setup and wave run-up along the Apollo Bay Main Beach in the vicinity of Wild Dog Creek for a series of storm tide scenarios which are presented within Table 3-6, the resultant wave run-up water levels are presented within the same table. The probability associated with the 5m and 8m wave events are considered unlikely and rare respectively. Water Technology (2012), estimated wave run-up hazards for three different levels of probability: Almost certain to occur in a 10 year time frame (10% AEP storm); Unlikely to occur in a 10 year time frame (1% AEP event); and Rare ‐ worst case scenario for a combination of factors (
FIGURE 3-10 ESTIMATED “RARE” WAVE RUN-UP EXTENTS FOR VARIOUS SEA LEVEL RISE SCENARIOS
3300-39_R01v01

 Australian Tourism Investments No. 5 Pty Ltd | 27 March 2019
 The Beach, Apollo Bay Page 19
4 HISTORICAL SHORELINE CHANGE
 The longshore sediment transport driven by the wave climate outlined in Section 3.4 was assessed by Costal
 Engineering Solutions (CES) for a number of beaches within the Apollo Bay region. This modelling verified
 previous estimates by Vantree (1996) that the net potential sediment transport along the Apollo Bay Main
 Beach is approximately 80,000 m3/y in a north easterly direction (CES, 2005).

 Within the vicinity of the proposed development, there exists a groyne located immediately south of the Wild
 Dog Creek entrance. This groyne was constructed in 1950 (EstuaryWatch, 2018), and has resulted in the
 coastline accreting as northerly moving sediment is trapped on the groynes’ southern side. Mapping of the
 dune vegetation lines was undertaken by CES (2005) for a number of historical aerial photographs taken
 between, 1952 and 2004, which verifies this accretion trend (see Figure 4-1). The accretion rate between 1952
 and 2004 just south of the groyne was approximately 0.9 m/year, Shoreline accretion further south was less
 pronounced and around 0.5 m/yr (CES, 2005). That study also showed stabilisation of the shoreline between
 1997 and 2004.

 Inspection of 2018 aerial imagery shows that no significant change in vegetation line has occurred since 2004
 which indicates that the stability of the shoreline observed between 1997-2004 has likely continued. Based on
 this, it is likely that the groyne compartment at Wild Dog Creek is now full, and sand is likely to be bypassing
 around the groyne such that ongoing advancement of the shoreline is considered unlikely. The groyne itself is
 now largely buried in the local dune.

 The existing dune and beach system provides a significant erosion buffer to the site with the smallest buffer
 between the development and lot boundaries to the 2018 vegetation line being approximately 40m and 90m
 respectively.
3300-39_R01v01

 FIGURE 4-1 VEGETATION LINES 1952, 1980, 1997, 2004 (CES, 2005)

 Australian Tourism Investments No. 5 Pty Ltd | 27 March 2019
 The Beach, Apollo Bay Page 20
5 COASTAL HAZARDS
 5.1 Coastal Erosion
 Historical coastal hazards within the Apollo Bay coastline have generally be associated with large storm tide
 events in combination significant wave energy impacting the shoreline. These events have resulted in
 significant shoreline erosion with large volumes of sediment being moved offshore by the waves, combined
 with inundation of low-lying areas caused by wave overtopping. In particular, the region of open coastline (the
 section of coast that is not sheltered by Point Bunbury and the Harbour) has experienced a greater severity
 and occurrence of these events. However, the increased beach volume in front of the development site due to
 the presence of the Wild Dog Creek groyne has reduced the impacts of these events within the immediate
 vicinity of the development.

 At nearby locations within Apollo Bay (approximately 550m south of the development) storm erosion along the
 beach has resulted in repeated loss of sections of the foreshore and walking track near Marriners Lookout Rd
 (see Figure 5-1). Coastal inundation of the Great Ocean Road has also been observed within this area in 2005
 as shown in Figure 5-2.
3300-39_R01v01

 FIGURE 5-1 COASTAL EROSION IMPACTING CAR PARKS AND WALKING PATHS IN APOLLO BAY IN 2005.

 Australian Tourism Investments No. 5 Pty Ltd | 27 March 2019
 The Beach, Apollo Bay Page 21
FIGURE 5-2 COASTAL INUNDATION IMPACTING THE GREAT OCEAN ROAD IN APOLLO BAY (G. MC PIKE
 2005)

 The foreshore at Apollo Bay experienced significant erosion in a series of storms during June and July 2018,
 and these events are discussed in the Apollo Bay Coastal Protection Study (GHD, 2018).

 Erosion distances were not reported immediately in front of the site however they were surveyed for the area
 located between Milford St and Marriners Lookout Rd, approx. 550m south of the site. At that location, around
 2 m of horizontal erosion was measured as a (cumulative) result of those storms, with a corresponding storm
 erosion volume of the order of 2-3 m3/m. The worst erosion observed occurred between Milford St and Joyce
 St where the maximum measured erosion distance was 5m as shown within Figure 5-3. The coastal dune
 measured on the 1st June 2018 (blue) can be observed to have shifted offshore resulting in a shallower offshore
 bed by 26th July 2018 (pink).
3300-39_R01v01

 Australian Tourism Investments No. 5 Pty Ltd | 27 March 2019
 The Beach, Apollo Bay Page 22
FIGURE 5-3 SURVEYED CROSS SECTION COMPARISON - APOLLO BAY BETWEEN MILFORD ST & JOYCE ST
 (IMAGE SOURCE: GHD,2018)

 GHD (2018) updated the design storm erosion results of Water Technology (2012), using additional data from
 the erosion observed during the June 2018 storm events. Results are provided in terms of storm cut width
 (also known as storm bite) - which refers to the horizontal retreat of the erosion escarpment. Results are
 provided for three probability scenarios – as discussed in Section 3.4.

 TABLE 5-1 STORM EROSION AT APOLLO BAY (GHD, 2018)

 Probability Storm Cut Width (m)
 Almost Certain 3
 Unlikely 5
 Rare 8

 Site Significance

 The existing dune and beach system adjacent to the development site provide a significant erosion buffer.
 Given the width of the existing dune system at the study area (i.e. the distance between the back of the beach
 and the Great Ocean Road), which increases from a width of around 25 m at the southern end of the
3300-39_R01v01

 development to around 60 m at the northern end of the development - it is highly unlikely that the residential
 development will be affected by short term storm erosion at any time during its proposed design life. Individual
 lots within the development are provided further protection in the form of a 50 m wide drainage reserve, and
 most individual lots are set back around 90m or more from the existing foreshore.

 Australian Tourism Investments No. 5 Pty Ltd | 27 March 2019
 The Beach, Apollo Bay Page 23
Despite this, the Great Ocean Road may become increasingly exposed to coastal erosion risk over 2070 and
 2100 timeframes at the southern end of the development. It is expected that such erosion would be managed
 by the relevant authorities into the future.

 5.2 Coastal Inundation
 As discussed in Section 3.4, it is expected that the Great Ocean Road and associated access point to the
 development will become inundated under the “Almost Certain” (to occur within a nominal 10 year timeframe)
 wave run-up scenario for present day conditions. It is therefore also likely to be inundated under more severe
 events and future sea level scenarios. Consequently, under such conditions the alternate access points at the
 south-western corner of the development should be used and maintained.

 The two alternate access points to the development are located on the south-west boundary that connects to
 the neighbouring Mariners Vue Estate – see Figure 5-4 . These access points above any potential storm surge
 inundation and will provide sufficient access points for all the proposed lots where the Great Ocean Road
 accessway is inundated. The access available provides residents both a route to the town centre, as well as
 an inland route away from Apollo Bay in case of emergency – see Figure 5-5.

 FIGURE 5-4 DEVELOPMENT ACCESS POINTS (IMAGE COURESTY OF BEVERIDGE WILLIAMS, 2019)
3300-39_R01v01

 Australian Tourism Investments No. 5 Pty Ltd | 27 March 2019
 The Beach, Apollo Bay Page 24
FIGURE 5-5 DEVELOPMENT ACCESS ROUTES (IMAGE COURESTY OF BEVERIDGE WILLIAMS, 2019)

 5.3 Stormwater & Runoff
 The hydrological sub-catchments that traverse the subject site are expected to generate a considerable volume
 of stormwater runoff during intense rainfall events, as the relatively steep terrain of the upper reaches of the
 sub-catchments may not permit much infiltration of rainfall. This runoff will be required to be discharged from
 the site through a network of culverts.

 The topographical contours and overland flow paths shown at the site are depicted in Figure 5-6 (as adopted
 from Beveridge Williams, 2016). This figure shows that overland flow at the proposed development will
 discharge to four locations. Three overland flow paths discharge to the stormwater drains at the Great Ocean
 Road – which subsequently discharge to culverts on the study area foreshore (the fourth overland flow path is
 directed into the wetlands in the lower eastern corner of the development). During a storm event, elevated
 ocean levels may restrict the discharge of such stormwater - resulting in excess runoff at Great Ocean Road
 and the developments proposed drainage reserves.

 Consequently, it is recommended that the proposed development adopt best practise water sensitive urban
 design (WSUD) in order to adequately redirect and store excess stormwater runoff. Such mechanisms would
 be needed to adequately address overland flow runoff & flooding concerns, whilst also minimising the impact
 of excess runoff on beach erosion at the stormwater culverts/outlets.
3300-39_R01v01

 It should be noted that the development site also contains a number of storm water storage basins (farm dams)
 located above the site along the toe of the steep terrain at, an elevation of around 40m AHD. These farm dams
 are located within the network of overland flow paths and would likely reduce the runoff discharge from the
 subject site during an intense rainfall event.

 Australian Tourism Investments No. 5 Pty Ltd | 27 March 2019
 The Beach, Apollo Bay Page 25
FIGURE 5-6 SITE CONTOURS AND DEVELOPMENT DRAINAGE NETWORK (BEVERIDGE WILLIAMS, 2016)
3300-39_R01v01

 Australian Tourism Investments No. 5 Pty Ltd | 27 March 2019
 The Beach, Apollo Bay Page 26
6 COASTAL HAZARD RISK ASSESSMENT 6.1 Overview Risk Management is the term applied to a logical and systematic method of establishing the context, identifying, analysing, evaluating, treating, monitoring and communicating the risks associated with any activity, function or process in a way that will enable organisations to minimise losses and maximise opportunities (Standards Australia, 2009). Risk is identified as the product of the likelihood and consequence of an event impacting on an asset or objective. Risk profiles have been developed by assigning scores to the consequence of each relevant coastal hazard and the likelihood of this coastal hazard impacting the site over a range of relevant timeframes this century. The risk profile is determined by applying the scores to a risk matrix such as the one shown in Table A-3, Appendix A. The risk profile assists with the identification and analysis of priority risks for subsequent decision making and planning. Table A-1 within Appendix A displays a description and semi-quantitative score that has been assigned to the range of coastal hazard likelihoods. Table A-2 within Appendix A displays a description and semi-quantitative score that has been assigned to the range of coastal hazard consequences. Table A-3 and Table A-4 within Appendix A display the resulting risk matrix and risk profile definitions respectively. 6.2 Coastal Inundation Hazard The likelihood and consequence of the coastal inundation hazards impacting the site has been assessed based on the review of the storm tide levels and existing topography. Risks ratings for the coastal inundation hazard are provided in Table 6-1 (residential lots) and Table 6-2 (access roads). The key justifications for the risk ratings assigned for this hazard are provided below: The proposed lots of the development are located at a minimum level of 6.5m AHD or higher which is: 4.0m above the 2100 1% AEP storm tide level; and 1.1m above the rare wave run-up level for 2100 sea level rise. The 2100 1% storm tide will result in inundation of the proposed drainage zone - at the north eastern corner of the property. Site access via the Great Ocean Road is likely to be affected when ocean inundation levels equal or exceed approximately 3.5m AHD. As a result, access via the Great Ocean Road will become inundated under the “Almost Certain” (to occur within a nominal 10 year timeframe) wave run-up scenario for present day conditions. It is therefore also likely to be inundated under more severe events and future sea level scenarios. Consequently, under such conditions the alternate access points at the south-western corner of the development should be used and maintained in preparation. Site access via the proposed side roads on the south-western boundary of the site are in excess of 20m above the 2100 rare wave run-up scenario. 3300-39_R01v01 Australian Tourism Investments No. 5 Pty Ltd | 27 March 2019 The Beach, Apollo Bay Page 27
TABLE 6-1 COASTAL INUNDATION RISK ASSESMENT RESULTS (RESIDENTIAL LOTS) Coastal Specific Impact Timeline Likelihood Consequence Risk Hazard Rank Coastal Inundation of proposed residential Existing Rare Insignificant Low Inundation lots by elevated storm tide and 2040 Unlikely Minor Low additional elevated water levels associated with wave action on the 2070 Unlikely Minor Low coastline. 2100 Unlikely Minor Low TABLE 6-2 COASTAL INUNDATION RISK ASSESMENT RESULTS (ACCESS ROADS) Coastal Specific Impact Timeline Likelihood Consequence Risk Hazard Rank Coastal Inundation of development property Existing Likely Minor Medium Inundation grounds and/or access road by 2040 Almost Minor Medium elevated storm tide and additional Certain elevated water levels associated with wave action on the coastline. 2070 Almost Minor Medium Certain 2100 Almost Minor Medium Certain 6.3 Coast Erosion (including Short Term & Long-Term Coastal Recession) The likelihood and consequence of long-term coastal recession hazards at the site has been assessed based on the review of the coastal and oceanographic processes expected to impact the property this century. The key justifications for the risk ratings assigned for this hazard in Table 6-3 (residential lots) and Table 6-4 (access roads) are provided below: The coastline in front of the proposed development area has seen an accretion trend since 1952 of up to 45m in in the vicinity of the Wild Dog Creek Groyne, though it is noted that this accretion has ceased and the beach position has stabilised over the past decade. Sea level rise may result in coastal recession around the site if no further coastal management or protection works are implemented. It is expected (based on State Government comments) that protection works will be undertaken by relevant authorities if the Great Ocean Road is threatened by erosion over future planning horizons. The Great Ocean Road, car parks and walking tracks have impacted the natural shape of the dune system with a likely reduction in dune volume and elevation. The development boundary is located landward of the Great Ocean Road with a minimum buffer of 40m from the 2018 vegetation line. This is a buffer of 20m from the potential 2100 shoreline recession distance associated with sea level rise. The lot boundaries have a minimum buffer of 87m from the 2018 vegetation line. This is a buffer of 67m from the potential 2100 shoreline recession distance associated with sea level rise. Due to the steep nature of the development site there is a significant volume of material (sediment) 3300-39_R01v01 between the coastline and the lot boundaries. Australian Tourism Investments No. 5 Pty Ltd | 27 March 2019 The Beach, Apollo Bay Page 28
TABLE 6-3 COASTAL EROSION RISK ASSESSMENT RESULTS (RESIDENTIAL LOTS)

 Coastal Specific Impact Timeline Likelihood Consequence Risk
 Hazard Rank
 Short-term Dynamic, short-term recession or Existing Rare Moderate Low
 beach breach of the dune or barrier
 2040 Rare Moderate Low
 erosion system by wave action and
 elevated water levels that impacts 2070 Rare Moderate Low
 the residential lots at the site.
 2100 Rare Moderate Low

 TABLE 6-4 COASTAL EROSION RISK ASSESSMENT RESULTS (ACCESS ROADS)

 Coastal Specific Impact Timeline Likelihood Consequence Risk
 Hazard Rank
 Short-term Dynamic, short-term recession or Existing Rare Moderate Low
 beach breach of the dune or barrier
 2040 Rare Moderate Low
 erosion system by wave action and
 elevated water levels that impacts 2070 Unlikely Moderate Medium
 the development property grounds
 and/or access road at the site. 2100 Possible Moderate Medium
3300-39_R01v01

 Australian Tourism Investments No. 5 Pty Ltd | 27 March 2019
 The Beach, Apollo Bay Page 29
7 MITIGATION OPTIONS
 There is a wide array of potential mitigation options that can be employed in response to climate change and
 sea level rise risks to coastal infrastructure and assets.

 The National Committee on Coastal and Ocean Engineering (Engineers Australia, 2017) endorses a simple
 set of three broad strategic options for mitigating the impact of sea level rise as presented by the IPCC (2014).
 These options are considered to provide a basic framework for the assessment of potential mitigation
 strategies for the site if and when they are required.

 The three broad strategic options are retreat, accommodate and protect. These broad strategic options have
 been used to provide the suggested pathways listed in Table 7-1 to adapting to the coastal hazard risks
 identified at the site and in the general vicinity.

 TABLE 7-1 POTENTIAL CLIMATE CHANGE ADAPTION PATHWYAS

 Planning Suggested Response Suggested Mitigation Measures
 Horizon Strategy
 Existing

 2040
 Ensure the proposed finished floor levels are above the planning
 frame 1% AEP storm tide for the planning horizon.
 Accommodate /
 2070 Protect
 Ensure the proposed access roads on the south-western boundary
 are maintained into the future.

 2100
3300-39_R01v01

 Australian Tourism Investments No. 5 Pty Ltd | 27 March 2019
 The Beach, Apollo Bay Page 30
8 CONCLUSION This report documents the updated coastal hazard vulnerability assessment (CHVA) undertaken for the proposed development “The Beach” at Apollo bay. The following conclusions relating to the coastal hazard vulnerability assessment of the proposed development can be drawn: The assessment of coastal inundation at the property indicates: The existing, 2040 and 2070 1% AEP still water storm tide levels will not inundate the property boundary. The 2100 1% AEP storm tide will inundate the south eastern section of the development boundary which is a designated drainage zone. Residential lots are not expected to be affected by wave run-up during the proposed development design life. Access to the site via the Great Ocean Road may become restricted during large wave setup and wave run-up events – both under present day conditions and into the future. However, inundation of the access road is expected to be short lived (the length of a high tide – that is a few hours). Access to the site via the proposed roads on the south western side of the property will not be restricted under any foreseeable coastal inundation event and evacuation of the site and Apollo Bay township is possible. The assessment of coastal erosion at the property indicates: Comparison of vegetation lines in aerial imagery between 1952, 1980, 1997 and 2004 by CES (2005) indicates an underlying accretion estimate of 0.9 m/year for the vegetated dune just south of the Wild Dog Creek groyne. This coastline has now stabilised but has resulted in a significant erosion buffer in front of the development. The minimum erosion buffer between the 2018 vegetation line and the property boundary is 40m. This is 20m landward of the potential 2100 shoreline recession distance associated with sea level rise. The minimum erosion buffer between the 2018 vegetation line and the proposed lot boundaries is 87m. This is 67m landward of the potential 2100 shoreline recession distance associated with sea level rise. Residential lots are not expected to be affected by erosion during the proposed development design life. The Great Ocean Road and the access point via this road to the development may become increasingly exposed to coastal recession over 2070 and 2100 timeframes (due to future shoreline recession). However, monitoring and management of the long term erosion at this site is expect to be able to identify and address such issues if they occur well into the future. 3300-39_R01v01 Australian Tourism Investments No. 5 Pty Ltd | 27 March 2019 The Beach, Apollo Bay Page 31
9 REFERENCES
 Beveridge Williams, 2018. Overall Development Plan: The Beach, Apollo Bay. Version No. 32. 22 November
 18.

 Coastal Engineering Solutions (CES), 2005. Apollo Bay Sand Study. August 2005.

 CSIRO, 2009. The Effect of Climate Change on Extreme Sea Levels along Victoria’s Coast. Prepared by
 McInnes, et. al., November 2009.

 Department of Environment, Land, Water and Planning (DELWP), 2015. Planning Practice Note 53: Managing
 coastal hazards and the coastal impacts of climate change, State Government of Victoria.

 Department of Sustainability and Environment (DSE), 2012. Victorian Coastal Hazard Guide, published by the
 Victorian Government DSE, Melbourne, June 2012.

 Department of Sustainability and Environment (DSE), 2012. Guidelines for Coastal Management Authorities:
 Assessing development in relation to sea level rise, published by the Victorian Government DSE, Melbourne,
 June 2012.

 Department of Sustainability and Environment (DSE), 2008. Coastal Advisory Note: How to consider sea level
 rise along the Victorian Coast.

 Engineers Australia, 2017. Guidelines for Responding to the Effects of Climate Change in Coastal and Ocean
 Engineering, National Committee on Coastal and Ocean Engineering (NCCOE). 4th Edition.

 Hunter, J., 2014, Derivation of Revised Victorian Sea-Level Planning Allowances Using the Projections of the
 Fifth Assessment Report of the IPCC. Research conducted for the Victorian Coastal Council.

 IPCC, 2014: Climate Change 2014: Synthesis Report. Contribution of Working Groups I, II and III to the Fifth
 Assessment Report of the Intergovernmental Panel on Climate Change

 Standards Australia, 2009. AS/NZS 4360:2004 Risk Management.

 Vantree (1996). Apollo Bay Coastal Processes. Prepared for the Department of Natural Resources South West
 Area.

 Victorian Coastal Council (VCC), 2014. The Victorian Coastal Strategy.

 Victoria Planning Provisions amend VC148, 2018. Amendment VC148 Clause 13.01.

 Water Technology, 2012. Coastal Hazards Management Plan: Marengo to Skenes Creek. October 2012.

 Water Technology, 2017. Marengo to Wild Dog Creek Sand Management Plan. February 2017.

 Water Technology, 2018. Coastal Hazard Vulnerability Assessment: Point Grey Lorne. June 2018.
3300-39_R01v01

 Australian Tourism Investments No. 5 Pty Ltd | 27 March 2019
 The Beach, Apollo Bay Page 32
10 DEFINITIONS AND DISCLAIMERS
 The information contained in this report is subject to the disclaimers and definitions below.

 1. The area referred to in this report at the development “site” or “property” or “development” is the land
 that Water Technology believes most closely represents the location identified by the client. The identification
 has been done in good faith and in accordance with information given to Water Technology by the client.

 2. No warranty is made as to the accuracy or liability of any studies, estimates, calculations, opinions,
 conclusions, recommendations (which may change without notice) or other information contained in this report,
 and to the maximum extent permitted by law, Water Technology disclaims all liability and responsibility for any
 direct or indirect loss or damage which may be suffered by any recipient of other person relying on anything
 contained in or omitted from this report.

 3. This report has been prepared for the sole use by the Client as stated on page ii and no responsibility
 is accepted by Water Technology with regard to any third party use of the whole, or of any part, of the contents
 of this report. Neither the whole or any part of this report, or any reference there to, may be included in any
 document, circular or statement without Water Technology’s written approval of the form and context in which
 it would appear.

 4. The information provided represents the best estimates based on currently available information
 described. This information is subject to change as new information becomes available and as further studies
 area carried out.
3300-39_R01v01

 Australian Tourism Investments No. 5 Pty Ltd | 27 March 2019
 The Beach, Apollo Bay Page 33
APPENDIX A
 RISK ASSESSMENT DEFINITIONS
3300-39_R01v01

 Australian Tourism Investments No. 5 Pty Ltd | 27 March 2019
 The Beach, Apollo Bay
TABLE A-10-1 LIKELIHOOD RANKING

 Likelihood Level Description Annual Exceedance Probability
 1 – Rare Risk will occur in exceptional circumstances. 1:10,000
 2 – Unlikely Risk not likely to occur within the period. 1:1,000
 3 – Possible Risk may occur within the period. 1:100
 4 – Likely Risk likely to occur within the period. 1:10
 5 – Almost Certain Risk will occur within the period. 1:1

 TABLE A-10-2 CONSEQUENCE RANKING

 Consequence Level Description
 1 – Insignificant Minimal impact in a localised area within existing natural variability.
 2 – Minor Low impact in a localised area with minimal impact to the site or its function.
 Flood depths 1.2m.

 TABLE A-10-3 RISK ASSESSMENT MATRIX

 Likelihood Consequence
 1 – Insignificant 2 – Minor 3 – Moderate 4 – Major 5 – Extreme

 5 – Almost Certain Medium Medium High Extreme Extreme
 4 – Likely Medium Medium Medium High Extreme
 3 – Possible Low Medium Medium Medium High
 2 – Unlikely Low Low Medium Medium Medium
 1 – Rare Low Low Low Medium Medium

 TABLE A-10-4 RISK PROFILE DEFINITION

 Risk Profile Definition
 Low Tolerable risk. A level of risk that is low and manageable without intervention.
 Medium A level of risk that may require intervention to mitigate.
 High/Extreme A level of risk requiring significant intervention to mitigate.
3300-39_R01v01

 Australian Tourism Investments No. 5 Pty Ltd | 27 March 2019
 The Beach, Apollo Bay
Melbourne Brisbane
 15 Business Park Drive Level 3, 43 Peel Street
 Notting Hill VIC 3168 South Brisbane QLD 4101
 Telephone (03) 8526 0800 Telephone (07) 3105 1460
 Fax (03) 9558 9365 Fax (07) 3846 5144

 Adelaide Perth
 1/198 Greenhill Road Ground Floor
 Eastwood SA 5063 430 Roberts Road
 Telephone (08) 8378 8000 Subiaco WA 6008
 Fax (08) 8357 8988 Telephone 08 6555 0105

 Geelong Gippsland
 PO Box 436 154 Macleod Street
 Geelong VIC 3220 Bairnsdale VIC 3875
 Telephone 0458 015 664 Telephone (03) 5152 5833

 Wangaratta Wimmera
 First Floor, 40 Rowan Street PO Box 584
 Wangaratta VIC 3677 Stawell VIC 3380
 Telephone (03) 5721 2650 Telephone 0438 510 240

 www.watertech.com.au

 info@watertech.com.au
3300-39_R01v01

 Australian Tourism Investments No. 5 Pty Ltd | 27 March 2019
 The Beach, Apollo Bay
You can also read


