Hot Topic Community Discovery on Cross Social Networks - MDPI
←
→
Page content transcription
If your browser does not render page correctly, please read the page content below
future internet

Article
Hot Topic Community Discovery on Cross
Social Networks
Xuan Wang 1 , Bofeng Zhang 1, * and Furong Chang 1,2
 1    School of Computer Engineering and Science, Shanghai University, Shanghai 200444, China;
      wangxuan123@shu.edu.cn (X.W.); changfurong123@163.com (F.C.)
 2    School of Computer Science and Technology, Kashgar University, Kashgar 844006, China
 *    Correspondence: bfzhang@shu.edu.cn; Tel.: +86-021-6613-5507

 Received: 7 January 2019; Accepted: 27 February 2019; Published: 4 March 2019

 Abstract: The rapid development of online social networks has allowed users to obtain information,
 communicate with each other and express different opinions. Generally, in the same social network,
 users tend to be influenced by each other and have similar views. However, on another social network,
 users may have opposite views on the same event. Therefore, research undertaken on a single social
 network is unable to meet the needs of research on hot topic community discovery. “Cross social
 network” refers to multiple social networks. The integration of information from multiple social
 network platforms forms a new unified dataset. In the dataset, information from different platforms
 for the same event may contain similar or unique topics. This paper proposes a hot topic discovery
 method on cross social networks. Firstly, text data from different social networks are fused to build a
 unified model. Then, we obtain latent topic distributions from the unified model using the Labeled
 Biterm Latent Dirichlet Allocation (LB-LDA) model. Based on the distributions, similar topics are
 clustered to form several topic communities. Finally, we choose hot topic communities based on their
 scores. Experiment result on data from three social networks prove that our model is effective and
 has certain application value.

 Keywords: cross social networks; hot topic community; Labeled Biterm Latent Dirichlet Allocation
 topic model; clustering algorithm

1. Introduction
     The era of Web 2.0 has witnessed the rapid expansion of online social networks that allow users
to obtain information, communicate with each other, and express different opinions. The content
published by these social networks usually includes news events, personal life, social topics, etc.
The information is not only used to discover hot topics and analyze topic evolution, but also to analyze
and supervise public opinion.
     The existing hot topic discovery methods are mainly limited to a single social network, such as
Sina Weibo, Twitter, and so on. Generally, in the same social network, users are affected by each other,
resulting in a similar point of view. However, under another social network, it is also possible for users
to hold the opposite opinion for the same event. Therefore, research undertaken on a single social
network is unable to meet the needs of research on hot topic community discovery.
     In this paper, we propose a hot topic discovery method on cross social networks. “Cross social
networks” refer to multiple social network platforms. The integration of information from multiple
social network platforms form a new unified dataset. In the dataset, information from different
platforms for the same event may contain similar or unique topics. First, we fuse data from different
social networks and build a unified model, which contains a lot of short text. Then, a new topic model
called Labeled Biterm Latent Dirichlet Allocation (LB-LDA) is proposed to get latent topic distributions.

Future Internet 2019, 11, 60; doi:10.3390/fi11030060                     www.mdpi.com/journal/futureinternet
Future Internet 2019, 11, 60                                                                      2 of 16

Thirdly, topic cluster operation is processed to get multiple topic communities consisting of several
latent topic labels. Finally, scores of different topic communities are calculated and communities with
higher score are regarded as hot topic communities. Experiments on data from three different social
networks show the hot topic discovery method can find hot topics at that time, and the hot topics are
verified to be effective. The main innovations of this paper are as follows:

•     We conduct hot topic discovery on cross social networks instead of a single social network.
•     We propose a new topic model called LB-LDA, which can relieve the sparseness of the
      topic distribution.

     The remainder of the paper is organized as follows. Section 2 presents an overview of related
work. In Section 3, we elaborate on our hot topic discovery method on cross social networks. Section 4
describes an experimental result and presents our final hot topic communities. In Section 5, conclusions
and suggestions for future research are made.

2. Related Work

2.1. Existing Research on Cross Social Network
     There is not much research on cross social network. Skeels et al. [1] conducted research on the
usefulness of different social networks in large organizations. In 2010, research about comparison of
information-seeking using search engines and social networks was conducted by Morris et al. [2], and
the result showed that it was desirable to query search engines and social networks simultaneously.
Most research is focused on user identification in different social networks to make recommendations.
Dale and Brown [3] proposed a method to aggregate social networking data by receiving first
authentication information for a first social networking service. Farseev et al. [4] performed a cross
social network collaborative recommendation and showed that fusing multi-source data enables
us to achieve higher recommendation performance as compared to various single-source baselines.
Tian et al. [5] demonstrated a more powerful phishing attack by extracting users’ social behaviors
along with other basic user information among different online social networks. Shu et al. [6] proposed
a CROSS-media joint Friend and Item Recommendation framework (CrossFire), which can recommend
friend sand items on a social media site.

2.2. Existing Research on Topic Model
     Topic modeling techniques have been widely used in natural language processing to discover
latent semantic structures. The earliest topic model was Latent Semantic Analysis (LSA) proposed by
Deerwester et al. [7]. This model analyzed document collections and built a vocabulary-text matrix.
Using Singular Value Decomposition (SVD) method, researchers can build the latent semantic space.
Later, Hofmann et al. [8] proposed the Probabilistic Latent Semantic Analysis (PLSA), which improved
upon the LSA model. PLSA considered that documents include many latent topics, and the topics were
related to words. Prior to PLSA, dirichlet distribution was introduced by Blei et al. [9] and the Latent
Dirichlet Allocation (LDA) approach was proposed. Due to the characteristics of LDA generation, this
topic model has been improved and used in many different areas. The drawbacks for using LDA are
that topic distribution tends to be less targeted and lacks definite meaning. Researchers improved
the LDA topic models and applied these models in different areas. For example, Ramage et al. [10]
improved the unsupervised LDA model by creating a supervised topic model called Labeled-LDA, in
which the researchers could attach the topic meanings. Separately, many researchers chose to add a
level to the three levels of document-topic-word. Ivan et al. [11] proposed a multi-grain model that
divided the topics into two parts: local topics and global topics. This model was used to extract the
ratable aspects of objects from online user reviews. A range of other approaches had been used as
well. Chen et al. [12] modeled users’ social connections and proposed a People Opinion Topic (POT)
model that can detect social communities and analyze sentiment. Iwata et al. [13] took time into
Future Internet 2019, 11, 60 3 of 16
Future Internet 2019, 11, x FOR PEER REVIEW 3 of 16
proposed a geographic
consideration topic amodel
and proposed topic to analyze
model the location
for tracking log data ofconsumer
time-varying multiple users. Chemudugunta
purchasing behavior.
et al. [15] suggested that a model can be used for information retrieval by matching
To recommend locations to be visited, Kurashima et al. [14] proposed a geographic topic model documents both
to
at a general topic level and at a specific level, and Lin et al. [16] proposed the Joint
analyze the location log data of multiple users. Chemudugunta et al. [15] suggested that a model can Sentiment Topic
(JST)
be usedmodel, which canretrieval
for information be usedbyto matching
analyze the sentiment
documents tendency
both of documents.
at a general topic level Wang
and at et al. [17]
a specific
proposed the Life Aspect-based Sentiment Topic (LAST) model to mine from other products
level, and Lin et al. [16] proposed the Joint Sentiment Topic (JST) model, which can be used to analyze the prior
knowledge
the sentiment oftendency
aspect, opinion, and their
of documents. Wangcorrespondence. Targeting
et al. [17] proposed short
the Life text, Cheng Sentiment
Aspect-based et al. [18]
proposed the Biterm Topic Model (BTM), which enlarged the text content
Topic (LAST) model to mine from other products the prior knowledge of aspect, opinion, andby defining word pairs
theirin
one text as biterms.
correspondence. Targeting short text, Cheng et al. [18] proposed the Biterm Topic Model (BTM), which
enlarged the text content by defining word pairs in one text as biterms.
2.3. Existing Research Topic Discovery
2.3. Existing
The TopicResearch
modelTopic
has Discovery
been widely used in hot topic discovery. Wang et al. [19] presented topical
n-grams, a topic model
The Topic model has beenthat discovers topicsinas
widely used well
hot as discovery.
topic topical phrases,
Wang which waspresented
et al. [19] able to discover
topical
n-grams, a topic model that discovers topics as well as topical phrases, which was able toCollective
topic and phrase. Vaca et al. [20] introduced a novel framework inspired from discover
Factorization
topic for Vaca
and phrase. online
et topic discovery
al. [20] introduced able to connect
a novel topics inspired
framework betweenfrom
different time-slots.
Collective Li et al.
Factorization
[21] proposed a double-layer text clustering model based on density clustering strategy
for online topic discovery able to connect topics between different time-slots. Li et al. [21] proposed and Single-
a
pass strategy,text
double-layer to find a way to
clustering process
model network
based data and
on density discover
clustering hot news
strategy andbased on a user’s
Single-pass interest
strategy, to
and atopic.
find Liuprocess
way to [22] proposed
network an effective
data algorithm
and discover to detect
hot news basedandontrack hotinterest
a user’s topics based on chains
and topic. of
Liu [22]
causes (TDT_CC), which can be used to track the heat of a topic in real time.
proposed an effective algorithm to detect and track hot topics based on chains of causes (TDT_CC), All the methods are
limitedcan
which to be
a single
used tosocial
tracknetwork,
the heattherefore,
of a topic it
inisreal
necessary forthe
time. All usmethods
to discover
arehot topics
limited to on cross social
a single social
networks.
network, therefore, it is necessary for us to discover hot topics on cross social networks.
3. Hot
3. Hot Topic
TopicCommunity
CommunityDiscovery
DiscoveryModel
Model
The general
The general process
processof of our
our method
method is is shown
shown in in Figure
Figure 1.1. First,
First, we
we collect
collect text
text data
data from
from different
different
social networks.
social networks. Then, we execute data preprocessing and establish establish aa unified
unified model
model (datasets)
(datasets) as
as
corpus. A
corpus. A single
single datum
datum in in this
this corpus
corpus includes
includes time,
time, label,
label, content,
content, and
and source.
source. Considering
Considering that
that the
the
corpus contains
corpus contains short
short text
text data,
data, which
which may
may lead
lead to
to sparseness
sparseness of of topic
topic distribution,
distribution, the
the LB-LDA
LB-LDA topic
topic
model is
model is proposed
proposed toto get
get the
the topic
topic distributions.
distributions. Based
Based onon these
these topic
topic distributions,
distributions, similar
similar topics
topics are
are
clusteredtotoform
clustered formtopic
topic communities,
communities, which
which contain
contain a certain
a certain numbernumber of topic
of topic labels.labels.
Finally,Finally, the
the scores
scores
of of different
different communities
communities are calculated
are calculated and communities
and communities with higher
with higher scores scores are chosen
are chosen as hotas hot
topic
topic communities.
communities. Overall,
Overall, the main thepurpose
main purpose of ourismodel
of our model is to discover
to discover topics fromtopics
crossfrom cross
social social
networks
networks
and clusterand cluster
similar similar
ones to form ones
hottotopic
formcommunities.
hot topic communities.
Establish a
Data collection
unified model on
from cross social Data pre-process
cross social
network
network data
Get topic
Achieve hot topic Cluster similar
distributions on
communities topics
unified model
General process
Figure1.1.General
Figure processofofour
ourmodel.
model.
3.1. Unified Model Establish Method
3.1. Unified Model Establish Method
3.1.1. Introduction to Cross Social Network
3.1.1. Introduction to Cross Social Network
In cross social network, different social networks often have different data formats and
In cross News
presentations. socialsites
network, different
and Weibo websitesocial networks often
are representatives have different
of different data formats
social networks, whichand
are
presentations. News sites and Weibo website are representatives of different social networks,
shown in Figures 2 and 3. In Figure 2, news sites usually contain the news title, news time, news sources,which
are shown
and in Figures
news content. 2 and3 3.
Figure In us
tells Figure
that 2, newsinformation
Weibo sites usuallygenerally
contain the news title,
includes usernews time, news
ID, Weibo time,
sources, and news content. Figure 3 tells us that Weibo information generally includes
Weibo source, and Weibo content. In this paper, we only take text content into consideration. user ID, Weibo
time, Weibo source, and Weibo content. In this paper, we only take text content into consideration.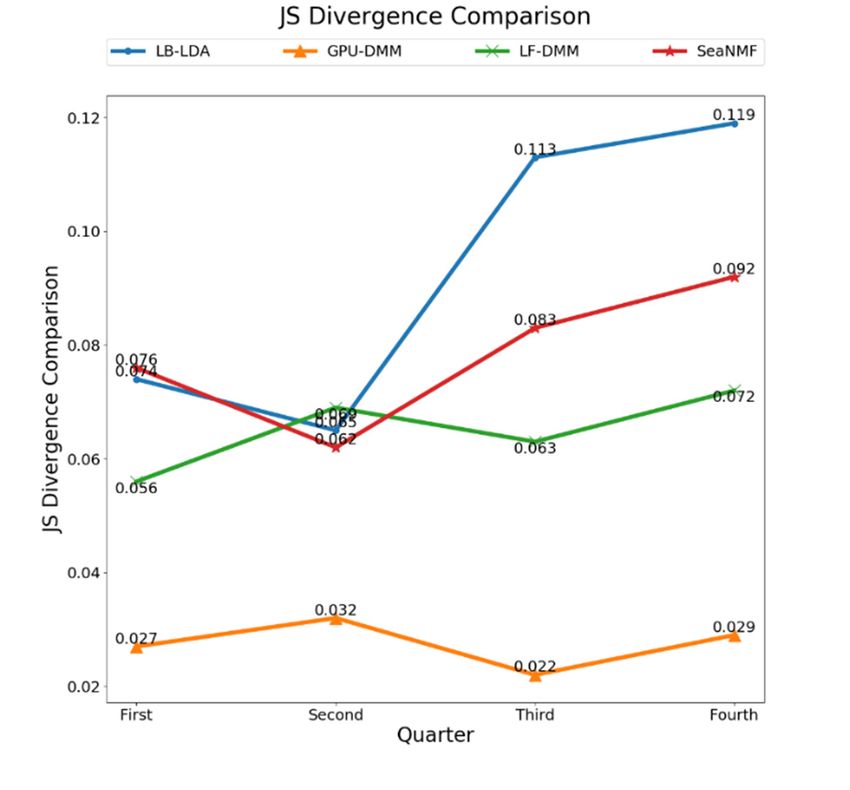
Future Internet 2019, 11, 60 4 of 16
Future Internet 2019, 11, x FOR PEER REVIEW 4 of 16
Future Internet 2019, 11, x FOR PEER REVIEW 4 of 16
Figure 2.2.News
Figure2. fromNetease
News from
from Netease News.
News.
Figure News Netease News.
Figure 3. Weibo from Sina Weibo.
Figure 3. Weibo from Sina Weibo.
Figure
3.1.2. Unified Model Establishment 3. Weibo from Sina Weibo.
Method
3.1.2. Unified
Although Model Establishment
socialEstablishment
networks haveMethodMethod
different data formats, there are similar parts in the information.
3.1.2. Unified Model
To establish our unified model, we
Although social networks have different choose datadata
title,formats,
data time, andare
there data content.
similar If the
parts datainformation.
in the does not
Although
contain social
data title networks
such as Weibo, have
thisdifferent
part is setdata formats,
to null there are similar parts in the information.
temporarily.
To establish our unified model, we choose data title, data time, and data content. If the data does not
To establish
To getour unified model,
the meaning we choose
of the latent data title,
topic, labels datapiece
for each time,ofanddatadata
needcontent. If theThe
to be added. data does
data cannot
contain data title such as Weibo, this part is set to null temporarily.
contain data into
be divided title different
such as Weibo,
parts. Thethisdata
part is set to null
containing datatemporarily.
title only need to perform word segmentation
To get the meaning of the latent topic, labels for each piece of data need to be added. The data
To get the meaning of the latent topic, labels
on the data title, and select the entity words as the labels. The for each piece
data of
thatdata
doesneed
not to be added.
contain the dataThe data
title
can be divided into different parts. The data containing data title only need to perform word
can be divided
needs to perform into
word different parts.onThe
segmentation the data content
containing data title
and choose someonly
of theneed
entitytowords
perform word
as labels.
segmentation on the data title, and select the entity words as the labels. The data that does not contain
Users with hashtags
segmentation on the data on social networks
title, and select theneed to take
entity bothasthe
words thetags andThe
labels. user-generated
data that does content into
not contain
the data title needs to perform wordcontent segmentation on the data content and matched
choose some of the entity
theconsideration.
data title needs Thetouser-generated
perform word segmentation needs toon bethe
split intocontent
data words and
and choose withof
some hashtags.
the entity
words as labels.
If matched, Users
theUsers
matched with hashtags
tags on social networks
can be considered need
as the textneed to If
labels. take
not,both the tags
the the
entity and are
words user-generated
chosen as
words as labels. with hashtags on social networks to take both tags and user-generated
content
the into
labels consideration.
of this text. The
Besides, user-generated
before the data content
fusion needs
process, a to be
data split
item into
needs words
to be and
added matched
to with
identify
content into consideration. The user-generated content needs to be split into words and matched with
hashtags.
the source If of
matched,
the currentthe matched tags can be considered as the text labels. If not, the entity words
hashtags. If matched, the data, such tags
matched as Sina
canWeibo, etc. Overall,
be considered as athe
piece
textoflabels.
data from ourthe
If not, unified
entitymodel
words
are chosenfour as the labels of this text.time,
Besides, before the data fusion process, a data item needs to be
arecontains
chosen as the parts, including
labels of this data
text. Besides,databefore
labels, the
data content,
data fusionandprocess,
data source.
a data item needs to be
added to identify the source of the current data, such as Sina Weibo, etc. Overall, a piece of data from
added
3.2.
to identify
LB-LDA
the source of the current data, such as Sina Weibo, etc. Overall, a piece of data from
Modelcontains four parts, including data time, data labels, data content, and data source.
our unified model
our unified model contains four parts, including data time, data labels, data content, and data source.
By analyzing latent topics in documents, the topic models can mine semantic connotations.
3.2. LB-LDA Model
However,
3.2. LB-LDA the latent topics generated by LDA model does not have clear meaning. Besides, when
Model
faced
Bywith short text,
analyzing the topic
latent topicsdistributions
in documents,tend the
to become sparse. Therefore,
topic models can minethis paper proposes
semantic an
connotations.
By analyzing
improved topic latentcalled
model topicsLB-LDA,
in documents,
referringthe
to topic
the BTM models
model can mine by
proposed semantic
Cheng connotations.
et al. [18] in
However, the latent topics generated by LDA model does not have clear meaning. Besides, when
However,
2014 and the
the latent
L-LDA topics
model generated
proposed byRamage
by LDA modelD et does
al. [10] not
in have clear meaning. Besides, when
2009.
faced with short text, the topic distributions tend to become sparse. Therefore, this paper proposes
faced with short text, the topic distributions tend to become sparse. Therefore, this paper proposes
an improved topic model called LB-LDA, referring to the BTM model proposed by Cheng et al. [18]
an3.2.1. Definition
improved topicofmodel
Bitermcalled LB-LDA, referring to the BTM model proposed by Cheng et al. [18]
in 2014 and the L-LDA model proposed by Ramage D et al. [10] in 2009.
in 2014Extending
and the L-LDA
text is an effective way toby
model proposed Ramage
mine latentDtopics
et al. from
[10] in 2009.
short texts. This paper refers to the
BTMDefinition
3.2.1. model [17],
of using
Bitermbiterms to expand texts. “Biterm” refers to disordered word pairs occurring
3.2.1. Definition of Biterm
in a short text simultaneously. For instance, let us assume that there are four words in one short text
Extending text is an effective way to mine latent topics from short texts. This paper refers to the
Extending text is an effective way to mine latent topics from short texts. This paper refers to the
BTM model [17], using biterms to expand texts. “Biterm” refers to disordered word pairs occurring
BTM model [17], using biterms to expand texts. “Biterm” refers to disordered word pairs occurring
in a short text simultaneously. For instance, let us assume that there are four words in one short text
in a short text simultaneously. For instance, let us assume that there are four words in one short text
{{ww1,,w
1
w2,,w
2
w3,,w
3
w4}} , the biterms are {(
4 , the biterms are
{(ww1,,w
1
w2),(
2
),(w
w1,,w
1
w3),(
3
),(w
w1,,w
1
w4),(
4
),(w
w2,,w
2
w3),(
3
),(w
w2,,w
2
w4),(
4
),(w
w3,,w
3
w4)}
4
)} .
.
C = {d1 , d2 ,..., dM }
Suppose given a corpus with M documents denoted by , containing V
W = {w1 , w2 ,..., wV }
terms denoted by . These corpora constitute K topic labels, expressed as
T = {l1, l2 ,..., lK }
Future Internet 2019, 11, 60 dm = {w1, w2 ,..., wr } 5 of 16
. For document , the topic labels are denoted as
T = {t , t ,..., t } t ∈ {0,1}
{wm1 , w2 ,1w32, w4 },Kthe, and k
biterms are {(w, 1which
, w2 ), (indicates
w1 , w3 ), (the w4 ) , ( w2 , w
w1 , existence of3 )the
, (wtopic
2 , w4 )labels
, ( w3 , w 4 )}. Therefore,
contained in the
the number of biterms in one short text is Cn2 , in which n points to the number of words in the d text.
current text in the topic labels set T. For example, the 1st, 3rd, and 7th topic labels exist in m , in the
Tm LB-LDA Model Description t1 , t3
3.2.2. t
vector, the number of digits and 7 are set to be 1, and the rest are set to be 0. Based on
Suppose given a corpus with M documents
dmW = {w , w , . . . , w d}m. ' These = {b1denoted
, b2 ,..., bCby C = {d1 , d2 , . . . , d M }, containing
2 }={( w1 , w2 ),(w1 , w3 ),...,( wr −1 , wr )}
V terms denoted
Section 3.2.1, the by can be enlarged2 to V corpora r constitute K topic labels, expressed.
1
as T = {l1 , β l2 , . . . , lK }. For document dm = {w1 , w2 , . . . , wr }, the topic labels are denoted as
Let=α{t and be hyper-parameters. Similar to the LDA model, LB-LDA model is a three-layer topic
T m 1 2 . . , tK }, and tk ∈ {0, 1}, which indicates the existence of the topic labels contained in
, t , .
model
the including
current text indocument
the topic layer,
labels latent
set T. topic layer andthe
For example, word 1st, layer. In contrast
3rd, and 7th topic tolabels
the traditional
exist in dm LDA
, in
the T m vector, the number of (
digitsw , w )( p≠ q )
pt1 , tq3 and t7 are set to be 1, and the rest are set to be 0. Based on
model, two words in one biterm share one latent topic label, and the topics in latent
Section
topic layer3.2.1,
have dm can be
the definite enlarged A
meanings. dm 0 = {b1generation
to graphical , b2 , . . . , bCr2 }representation
= {(w1 , w2 ), (is , w3 ), .in. . Figure
w1show , (wr−1 ,4wand
r )}.
→ →
described
Let α and asβ follows.
be hyper-parameters. Similar to the LDA model, LB-LDA model is a three-layer topic
model including
For each topicdocument k ∈ {1,latent
label k, layer, 2,...,topic
K } layer and word layer. In contrast to the traditional LDA
model, two words in one biterm (w p , wq )( p 6= q) share one latent topic label, and the topics in latent
ϕ k Dir ( β )
topicGenerate
layer havea topic-word distribution
definite meanings. A graphical generation representation is show in Figure 4 and
For each document d '
described as follows.
For
For each
each topic k ∈ {1,
topic label k, k2,...,
∈ {1,K2,}. . . , K }
→
k ∈ {0,1} Bernoulli (γk)
Generate aΛ d
topic-word distribution ϕ ∼ Dir ( β )
Generate
For each document d
0
For each
Generate α
topic d
=
k L
∈d
×
{ α
1, 2,d . . . , K }
d
Generate Λk d∈ {0, 1} ∼ Bernoulli (γ)
θ = (θ l1 ,→ θ l2 ,..., θ lMd ) Dir (α d )
Generate →d
Generate α = Ld × αd
Generate θ d = (θlb
For each biterm
1
,i θlin
2
, .document d ' (αd )
. . , θl Md ) ∼ Dir
z ∈{bλi1din, λdocument
For each biterm
Generate i 2 ,..., λMd } Mult (θ )
d d
d0 d
d d d
Generate zi ∈ {λ1 , λ2 , . . . , λ Md } ∼ Mult(θ ) d
w , w ∈W Mult (ϕ ) form b =bi (=w ( w i1 i, w
) i2 )
Generate word wi,1i ,1, wi,2i ,2∈ W ∼ Mult( ϕ) and
Generate word and formi i1 , w 2
Generation process
Figure4.4.Generation
Figure processofofLB-LDA.
LB-LDA.
In this procedure, we need to explain the calculation method of Λd andd Ld , and dthis part mainly
refersIntothis procedure,
L-LDA. wedocument
For each need to explain the calculation
d’, we firstly method
get Bernoulli of Λ Λ
distribution and
d L anddefine
. Then, we this part
the
d
d d’, we firstly get Bernoulli distribution Λ . Then
vector of document’s labels to be λ = {k Λk = 1} . Next, we define a document-label matrix L and
mainly refers to L-LDA. For each d
document d we
the is M
sizethe
define d × K,of
vector indocument’s λd . The
which Md =labels λ = {k | Λd = 1} . Next,
to beelement in L kis set as
d
Equation
d
(1), where
we define i means each
a document-label
row and i ∈ {1, . . . , Md }, j means column and j ∈ {1, . . . , K }.
(
d 1 (λid = j)
Li,j = (1)
0 other
3.2.3. LB-LDA Model Inference
In text mining, documents and words are visible while the distributions are invisible. Therefore,
the parameter distributions need to be estimated, including θ and ϕ. Similar to LDA, the Gibbs
Future Internet 2019, 11, 60                                                                                     6 of 16

Sampling algorithm is used to estimate these parameter distributions. For one biterm, the two words
share the same latent topic label. If other biterm latent topic labels are known, Equation (2) can be used
to estimate this biterm existence probability in different the topic labels. The meaning of each element
in Equation (2) is showed in Table 1.

                                           → →            Nd,k,i + αk Nk,wi,1 ,i + β i Nk,wi,2 ,i + β i
                               p ( zi = k | zi , B ) ∝            → →
                                                                      ·        → →·             → →                 (2)
                                                         Nd,i + α · 1 Nk,i + β · 1 Nk,i + β · 1

                                   Table 1. The meaning of each element in Equation (2).

        Element                                                           Meaning
          Nd,i           The number of biterms in document d, excluding biterm i
          Nd,k,i         The number of biterms in document d, for which topic label is k, excluding biterm i
          Nk,i           The number of words in the corpus for which topic label is k, excluding this word
         Nk,wi,1 ,i      The number of word wi,1 in the corpus for which topic label is k, excluding this word
         Nk,wi,2 ,i      The number of word wi,2 in the corpus for which topic label is k, excluding this word

     The Gibbs sampling procedure is used to update each biterm’s latent topic label. Firstly, topic
labels are assigned to each biterm in the corpus randomly. In every iteration, elements in Table 1 are
updated. Then, Equation (2) is used to update each biterm’s topic label. When the specified number of
iterations reaches, it stops. The Gibbs sampling procedure is shown in Algorithm 1.

 Algorithm 1 Gibbs Sampling Process.
                                                                                     → →
 Input           Enlarged corpus C’, topic labels set T, hyper-parameters α , β , iteration times iter
 Output          Document-topic distribution θ, topic-word distribution ϕ
 1               Initialize each biterm’s the topic label randomly
 2               For iter_times = 1 to iter
 3               For each document d’ in corpus C’do
 4               For each biterm b in document d’ do
 5               Calculate the probability of each topic label by Equation (1)
 6               Sample b’s topic label based on the result of step 5;
 7               Calculate θ and ϕ based on Equations (2) and (3)

    The equations to estimate the parameters θ, ϕ are shown as Equations (3) and (4). θ is a M × K
matrix and represents topic distribution over each document. ϕ is a K × V matrix and represents the
word distribution over each topic label.

                                                                    Nk,d + αk
                                                         θk,d =                                                     (3)
                                                                  Nd + ∑tK=1 αt

                                                                    Ni,k + β i
                                                         ϕi,k =                                                     (4)
                                                                  Nk + ∑V
                                                                        t =1 β t

3.3. Topic Similarity Calculation Method on Cross Social Networks
     The distributions of words under different topics can be calculated by LB-LDA. Topics can be
clustered by the similarity of these distributions.

3.3.1. Topic-Word Distribution Dimension Reduction Strategy
     The dimension of topic-word distribution ϕ is K × V. K means the number of topic labels; V
means the number of terms. In reality, the value of V will be very large, which makes it difficult to
perform subsequent calculations. Therefore, the dimensionality of ϕ need to be reduced. Generally, in
3.3.1. Topic-Word Distribution Dimension Reduction Strategy
The dimension of topic-word distribution
ϕ
is K × V . K means the number of topic labels; V
means
Future the number
Internet of terms. In reality, the value of V will be very large, which makes it difficult
2019, 11, 60 7 of to
16
perform subsequent calculations. Therefore, the dimensionality of
ϕ
need to be reduced. Generally,
in each topic, the words appearing at a high frequency are usually limited to a small part. Therefore,
each topic, the words appearing at a high frequency are usually limited to a small part. Therefore, for
for each topic, words are sorted by probability and the first X words are chosen as the frequency
each topic, words are sorted by probability and the first X words are chosen as the frequency words
words
ϕ ' shown in Figure 5 and the
of each of eachAfter
label. label. After dimension
dimension reduction,
reduction, the
the format offormat of in is
ϕ0 is shown Figure 5 and the dimension is
K × X.
dimension is K × X .
Figure
Figure 5. The
5. The formatofoftopic
format topic distribution
distribution after
afterdimension
dimensionreduction.
reduction.
3.3.2. Topic Similarity Calculation Method
3.3.2. Topic Similarity Calculation Method
Jensen–Shannon (JS) divergence is often used to measure the degree of discrepancies between
Jensen–Shannon (JS) divergence is often used to measure the degree of discrepancies between
different distributions. In general, for two probability distributions P, Q, the value of JS divergence is
different distributions. In general, for two probability distributions P, Q, the value of JS divergence is
between 0 and 1. Considering that the elements in matrix ϕ0 are two-tuple, the JS calculation ought to
between
be 0 andWhen
improved. 1. Considering
two different thatwordsthe elements
in P, Q in (P,matrix
ϕ ' ϕ0 ) two-tuple,
Q are fromare are from the thesame
JS calculation
document,ought
then
the two words belongs to similar latent topic, and they are treated asϕthe ' same word for JS divergence
to be improved. When two different words in P, Q (P, Q are from ) are from the same document,
calculation. The improved JS divergence formula is shown in Equation (5).
then the two words belongs to similar latent topic, and they are treated as the same word for JS
divergence calculation. The improved( JS divergence P( x )formula is shown Q(y) in Equation (5).
P( x ) log Q(y) + Q(y) log P( x) ( x, y ∈ same_doc)
JS( P|| Q) = ∑ P ( x) x, yQ∈
/( ysame_doc
)
(5)
P ( x ) log + Q ( 0)(log
y ( x , y ∈ ) _ doc )
same
JS ( P || xQ∈
) =topic_P
y ∈ topic_Q
x∈topic _ P
Q( y) P( x) (5)
y∈topic _ Q 0 ( x, y ∉ same _ doc )
Calculate the JS divergence between any two of the distributions in ϕϕ0' by Equation (5) and a
Calculate the JS divergence between any two of the distributions in by Equation (5) and a
K × K dimensional matrix S can be obtained. S is a symmetric matrix with a diagonal of 0, and the
K × Kof S[i][j]
value dimensional matrix
represents S can
the JS divergence valueSbetween
be obtained. is a symmetric
the i-th matrix withand
topic label a diagonal of 0, and
the j-th topic labelthe
in
topic of S[i][j]
valuelabel set T.represents the JS divergence value between the i-th topic label and the j-th topic label
in topic label setthe
Moreover, T. more similar the two distributions, the larger the value of JS divergence. Define a
Moreover,
matrix the more
called Distance similar the
to measure the two distributions,
distance between anythe two
larger the value
topics oflabel
in topic JS divergence.
set T. The Define
size of Ta
matrix called Distance to measure the distance between any two topics in topic label
is K × K. The construction method of the Distance matrix is shown in Equation (6). The smaller set T. The sizethe
of
T is K ×between
distance K . The the two topic method
construction distributions,
of thethe more similar
Distance matrix the two distributions
is shown in Equationare.
(6). The smaller
the distance between the two topic distributions, the more similar the two distributions are.
1
Distance[i ][ j] = (i, j ∈ [0, K ), i 6= j) (6)
S[i ][ j]
3.4. Hot Topic Community Discovery Method
Based on a specified standard, the clustering method divides mass data into clusters according to
the degree of similarity. For example, the distance can be considered as a standard. The data located in
one cluster is as similar as possible, and the data between two clusters tends to be more different.
3.4.1. Topic Clustering Method
Clustering algorithms can be divided into partition-based clustering, density-based clustering,
layer-based clustering, graph theory-based clustering, etc. These methods all can be applied to
cluster topics.
Each topic in the topic label set T can be considered as a point in the graph. We know the
distance between every two points instead of the coordinate of each topic point. For some cluster
methods, such as K-means, this is not enough to calculate topic clusters. Under these circumstances, a
Multidimensional Scaling (MDS) algorithm is to be used to get the “coordinate”. MDS algorithm wasFuture Internet 2019, 11, 60 8 of 16
proposed by Torgerson in 1958 [23] and the core idea of the algorithm is to display the high-dimensional
data in low-dimensional space. By the algorithm, topic point coordinate in the graph can be obtained
based on the Distance matrix.
3.4.2. Hot Topic Community Calculation Method
Using the MDS algorithm and various clustering algorithms (K-means, DBSCAN(Density-Based
Spatial Clustering of Applications with Noise) etc.), topic communities can be obtained. Suppose that P
topic clusters denoted by Cluster = {C1 , C2 , . . . , CP } have been got. C p in Cluster is a topic community
and contains uncertain number of topic labels.
When defining a hot topic community, two factors ought to be considered, including the number
of topic labels in the current community and frequency of the topic label. Therefore, Equation (7)
is defined to calculate topic community score. In the equation, for each topic label l in cluster C p ,
document that containing the topic label l denoted by doc_m, label_nums_m means label number in
doc_m. In fact, there may be one or more doc_m.
Choose the communities with higher score to be hot topic community. Finally, the hot topic
communities are obtained.
1
score( p) = ∑ label_nums_m
(7)
l ∈ CP
l ∈ doc_m
4. Experiment and Results
Data from three different social networks are collected including Tencent QQ Zone, Sina Weibo,
and Netease news. Based on the method proposed in Chapter 3, a related experiment is executed, and
some hot topic communities are obtained.
4.1. Data Collection
4.1.1. Cross Social Network Dataset
The experiment data was collected from Tencent QQ Zone, Sina Weibo, and Netease News. All
of them are derived from previous laboratory collections and the time span is 2011. The data items
Future Internet 2019,
in Tencent 11, x FOR
QQ Zone PEER user
contain REVIEW 9 of 16
ID, release time, and content, which is shown in Figure 6. The data
items in Sina Weibo contain user ID, release time, and content, which is shown in Figure 7. The data
items
itemsinin
Netease
NeteaseNewsNewscontain
containnews
news title,
title, release time, news
release time, newssource,
source,and
andcontent,
content, which
which is is shown
shown in in
Figure 8.
Figure 8.
Figure
Figure Dataitem
6.6.Data item in
in Tencent
Tencent QQ
QQZone.
Zone.
Figure 7. Data item in Sina Weibo.Figure 6. Data item in Tencent QQ Zone.
Future Internet 2019, 11, 60 9 of 16
Figure
Figure 6.
6. Data
Data item
item in
in Tencent
Tencent QQ
QQ Zone.
Zone.
Figure 7. Data item in Sina Weibo.
Figure
Figure 7.
7.7.Data
Figure Dataitem
Data item in
item Sina
inSina
in Weibo.
SinaWeibo.
Weibo.
Figure 8. Data item in Netease News.
Figure 8.
Figure Data item in
in Netease News.
4.1.2. Unified Model Building Figure 8.
8. Data
Data item
item in Netease
Netease News.
News.
4.1.2. Unified Model Building
TheUnified
4.1.2.
4.1.2. data collected
Unified Model
Model Buildingis complex and has different forms, so it is necessary to establish a unified
Building
The data
model. Two items, including collected is complex
time and and has different
content in dataforms,
from so it is necessary
Tencent QQ Zone to establish
and Sinaa Weibo,
unified and
The
The data
model. Two collected
data is
is complex
items, including
collected complextime and has
has different
and content in dataforms,
different so
so itit is
from Tencent
forms, is necessary
QQ Zone and
necessary to
to establish
Sina Weibo,
establish aa unified
and
unified
three items, including title, time, and content in data from Netease News, are kept.
model.
model. Two items, including time and content in data from Tencent QQ Zone and Sina Weibo, and
three Two
items, items,
including including
title, time
time, and
and content
content inin data
data from
from Tencent
Netease QQ
News, Zone
are and
kept. Sina Weibo, and
The dataincluding
three preprocessing is required, including repeated data filtering, word segmentation,
three items,
The data
items, including title,
title, time,
preprocessing time, and
and content
is required, in
including
content in data from
repeated
data Netease
from data News,
filtering,
Netease News,wordare kept.
aresegmentation,
kept. removal
removal
of The of data
stop words, andThe so ison. Theto bedata to be preprocessed herefiltering,
mainly
contentincludes content
sources,from
stop data preprocessing
The words, and so on.
preprocessing is required,
data required, including
preprocessed
includinghere repeated
mainlydata
repeated includes
data filtering, word segmentation,
from three
word segmentation,
three sources,
removal theof and
stop the
words, textandtitle inon. theTheNetease Newspreprocessed
data.
and
removal oftext
stoptitle in the
words, and so
Netease so on.News data
data to
Thedata. to be
be preprocessed here here mainly
mainly includes
includes content
content from
from
For
three data
For
sources, in
data Tencent
andin Tencent
the QQ
text Zone
QQ
title Zone
in and
the andSinaSina
Netease Weibo,
Weibo,
News some
some
data. entity
entity words
words are
are chosen
chosen from
from contentas
content as the
three sources, and the text title in the Netease News data.
labels. For
theFor
For
datain
labels.
dataFor
data from
data Netease
in Tencent
Tencentfrom QQ
QQNeteaseNews,
Zone
Zone and and
title
News, Sina
Sina
segmentation
title segmentation
Weibo,
Weibo, some results
some entityresults
entity words
words
can be
can be
are considered
areconsidered
chosen
chosen from to to
from be be
the the
content
content
labels.
labels.
as
as the
the
Mixing
labels.these
Mixing
labels. For three
these
For data
data kinds
three
from
from
kindsof of
Netease
Netease data,
data, the
News,
News,
theunified
unified
title model
model can
title segmentation
segmentation canbe be obtained.
obtained.
results
results can AA
can be unified
unified data
be considered
considered datato of
of
to bethis
this
be the model
model
the labels. is
is
labels.
shown shown
Mixing in Figure
in these
Figure 9. 9.kinds
Mixing these three
three kinds of of data,
data, thethe unified
unified modelmodel cancan bebe obtained.
obtained. A A unified
unified data
data ofof this
this model
model is is
shown in Figure
shown in Figure 9. 9.
Figure
Figure 9. Singledata
9. Single data in
inunified
unifiedmodel.
model.
Figure 9. Single data in unified model.
Figure 9. Single data in unified model.
Since the time span of the data is the whole of 2011, the data is divided into four parts by time
quarter. Document number and other information are shown in Table 2. As we can see from the
table, there is little difference in the number of documents for different quarter. However, there is a
significant difference in document length, ranging from less than 10 to 1000–2000. The numbers of
text from different social networks are shown in Table 2. The difference between these values is not
significant. To some extent, it is fair for data from different social networks.quarter. Document number and other information are shown in Table 2. As we can see from the table,
there is little difference in the number of documents for different quarter. However, there is a
significant difference in document length, ranging from less than 10 to 1000–2000. The numbers of
text from different social networks are shown in Table 2. The difference between these values is not
significant. To some extent, it is fair for data from different social networks.
Future Internet 2019, 11, 60 10 of 16
Table 2. Information in unified model.
Table 2. Information in unified model.
Doc Label Min Max Average QQ Sina Netease
Time
Number
Doc Number
Label Length
Min Length
Max Length
Average QQ Zone Weibo
Sina News
Netease
Time
1st Quarter 3708 7676 5 1162 40.22 1105 1271 1332
Number Number Length Length Length Zone Weibo News
2nd Quarter 3338 9397 3 1486 34.13 1206 1057 1075
1st Quarter 3708 7676 5 1162 40.22 1105 1271 1332
3rd2nd
Quarter
Quarter 40573338 9348
9397 36 2360
1486 48.47 12061368 10571197 10751492
34.13
4th3rd
Quarter
Quarter 35904057 7648
9348 65 1711
2360 49.69 13681127 11971075 14921388
48.47
4th Quarter 3590 7648 5 1711 49.69 1127 1075 1388
4.2. Topic Discovery Experiment Method
4.2. Topic Discovery Experiment Method
4.2.1. Text Expansion Method
4.2.1. Text Expansion Method
Table 2 tells us there are huge differences in document length. To reduce the sparsity of topic
distribution, we need
Table 2 tells to enlarge
us there some
are huge of the documents
differences in documentby length.
the method proposed
To reduce in Section
the sparsity of 3.2.1.
topic
Documents ofwe
distribution, less than
need to10 wordssome
enlarge are chosen
of the for text expansion
documents by the and others
method maintain
proposed in their original
Section 3.2.1.
state.
Documents of less than 10 words are chosen for text expansion and others maintain their original state.
4.2.2. Topic Distribution
4.2.2 Topic Distribution Calculation
Calculation Method
Method
The process
process ofof obtaining
obtainingtopic
topicdistributions
distributionsisisshown
shownininFigure 10.10.
Figure The short
The documents
short documentsought to
ought
be applied
to be to to
applied LB-LDA
LB-LDA and
andthe longer
the longerdocuments
documentsshould
shouldbe
beapplied
appliedtotoL-LDA.
L-LDA.Using
Using the
the two topic
models, topic distributions of the corpus in different
different quarters
quarters can
can be
be obtained.
obtained.
Figure
Figure Theprocess
10.10.The process of
of obtaining
obtaining topic
topicdistribution.
distribution.
The
The Gibbs
Gibbs sampling
sampling algorithm
algorithm ofof L-LDA
L-LDA isis shown
shown inin Equation
Equation (8). In each
(8). In each sampling process of
sampling process of
L-LDA, each word has a latent topic label rather than a word pair shares a topic label. The meaning
L-LDA, each word has a latent topic label rather than a word pair shares a topic label. The meaning of
element in Equation
of element (8)(8)
in Equation is similar to Equation
is similar (2).(2).
to Equation
¬ +i β i
α+kα NN
p(zi = k| z
→ NNd,k,i + k,wi i + β
i) ∝ d , k , ¬ i → ·k k , wi→i → (8)
p( zi = k | z ¬i ) ∝N + α · 1 N + β · 1
→ (8)
N + α ⋅1 k,i
d,i
d , ¬i
N + β ⋅1
k , ¬i
4.2.3. Comparisons with Other Topic Models
4.2.3.To
Comparisons
demonstratewith Other Topic of
the effectiveness Models
LB-LDA in reducing the sparsity of topic distributions, a series
of comparative
To demonstrate the effectiveness of topic
experiments on different models
LB-LDA are presented.
in reducing JS divergence
the sparsity of topic is chosen as thea
distributions,
criterion
series of for the sparseness
comparative evaluation
experiments on of the topic
different distributions
topic models areand the calculation
presented. methodishas
JS divergence been
chosen
show in Equation (5). For a group of distributions, the average JS divergence value between
as the criterion for the sparseness evaluation of the topic distributions and the calculation method any two
of
hasdistributions
been show ininEquation
the group can
(5). bea calculated.
For The experimental
group of distributions, data isJStext
the average from thevalue
divergence four quarters.
between
We
any two of distributions in the group can be calculated. The experimental data is text from[25],
compare LB-LDA with some new topic models including GPU-DMM [24], LF-DMM and
the four
SeaNMF [26] models and the results are shown in Figure 11. In Figure 11,
quarters. We compare LB-LDA with some new topic models including GPU-DMM [24], LF-DMM abscissa represent different
quarters and ordinate represent average JS divergence value. According to this figure, we can find
that average JS divergence values of LB-LDA are larger than others generally, which means LB-LDA
performs better than the other three models in terms of sparsity reduction in general.Future Internet 2019, 11, x FOR PEER REVIEW 11 of 16
[25], and SeaNMF [26] models and the results are shown in Figure 11. In Figure 11, abscissa represent
different quarters and ordinate represent average JS divergence value. According to this figure, we
can Internet
Future find that average
2019, 11, 60 JS divergence values of LB-LDA are larger than others generally, which11means
of 16
LB-LDA performs better than the other three models in terms of sparsity reduction in general.
Figure 11. The JS divergence comparison among different topic models.
Figure 11. The JS divergence comparison among different topic models.
4.2.4. Topic Distance Calculation Method
4.2.4. Topicthe
Firstly, Distance
wordsCalculation Method probability of 20 under each topic are selected as the
with the highest
high-frequency words under each topic probability
Firstly, the words with the highest label. Thenofthe similarity
20 under eachbetween
topic aredifferent topics
selected as are
the high-
calculated
frequencyby Equation
words under(5) to form
each topic the Distance
label. matrix
Then the by Equation
similarity between(6). The element
different Distance
in calculated
topics are
matrix describes the distance between every two topics.
by Equation (5) to form the Distance matrix by Equation (6). The element in Distance matrix describes
the distance between every two topics.
4.3. Hot Topic Community Discovery
4.3. Hot
4.3.1. Topic
Cluster Community Discovery
Method
In Cluster
4.3.1. SectionMethod
3.4.1, this paper mentions four clustering methods: partition-based clustering,
density-based clustering, layer-based clustering, and graph-based clustering. The representative
In Section 3.4.1, this paper mentions four clustering methods: partition-based clustering,
algorithms—K-means, DBSCAN, hierarchical clustering, and spectral clustering—are chosen to obtain
density-based clustering, layer-based clustering, and graph-based clustering. The representative
topic clusters.
algorithms—K-means, DBSCAN, hierarchical clustering, and spectral clustering—are chosen to
K-means and DBSCAN need “topic coordinate” for clustering, so MDS algorithm ought to be
obtain topic clusters.
applied to Distance matrix to cluster topics. For hierarchical clustering and spectral clustering, the
K-means and DBSCAN need “topic coordinate” for clustering, so MDS algorithm ought to be
Distance matrix is used for clustering directly.
applied to Distance matrix to cluster topics. For hierarchical clustering and spectral clustering, the
Distance
4.3.2. matrix Standard
Evaluation is used for clustering directly.
Silhouette
4.3.2. Coefficient
Evaluation Standard was proposed by Peter J. in 1986, and it is an evaluation standard for cluster
algorithm. For element i in cluster C, the average distance between i and other elements in C is called
cohesionSilhouette
degree, Coefficient
denoted bywas a(i).proposed by Peter
The average J. inbetween
distance 1986, and it is elements
i and an evaluation standard
in other for
clusters
algorithm. For element i in cluster C, the average distance between i
constitute a set B = {bi1 , bi2 , . . .}, and choose the minimum value as the coupling degree, denoted by C
cluster and other elements in
is called
b(i). cohesionCoefficient
The Silhouette degree, denoted by a(i).
of element The average
i calculation distance
method between
is shown i and elements
in Equation (9). in other
clusters constitute a set
B = {b , b ,...}
i1 i 2 , andbchoose
(i ) − a(ithe
) minimum value as the coupling degree,
s(i ) =of element i calculation method is shown in Equation(9)
denoted by b(i). The Silhouette Coefficient (9).
max(b(i ), a(i ))
i) − a(i)in one cluster is defined as the Silhouette
The average of the Silhouette Coefficients of allb(samples
s(i) = (9)
Coefficient of the current clustering algorithm. The
max(b(i ),of
value i )) Silhouette Coefficient is between −1
a(the
and 1. The closer the value is to 1, the better the corresponding clustering method works. On the
contrary, the clustering method is not good.Future Internet 2019, 11, x FOR PEER REVIEW 12 of 16
The average of the Silhouette Coefficients of all samples in one cluster is defined as the Silhouette
Coefficient of the current clustering algorithm. The value of the Silhouette Coefficient is between −1
andInternet
Future 1. The closer
2019, 11, 60the value is to 1, the better the corresponding clustering method works.12On the
of 16
contrary, the clustering method is not good.
4.3.3. Comparison
4.3.3. ofof
Comparison Different Clustering
Different Method
Clustering Method
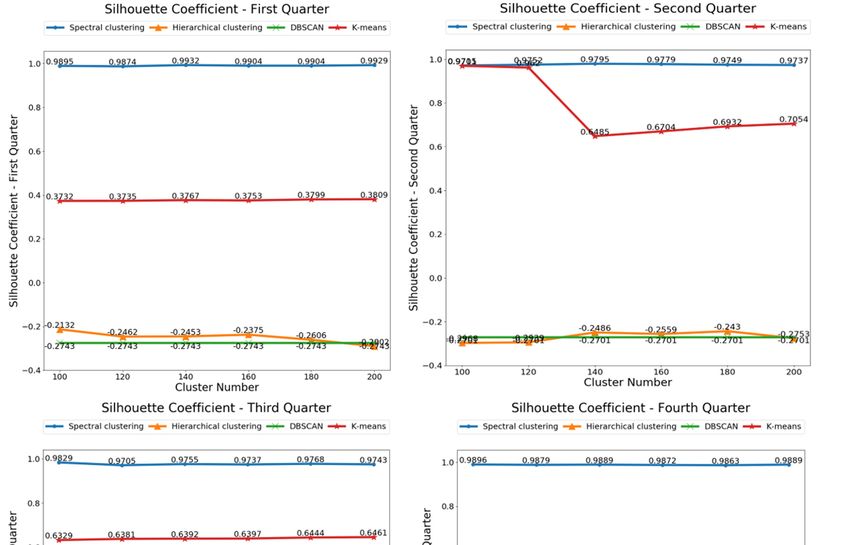
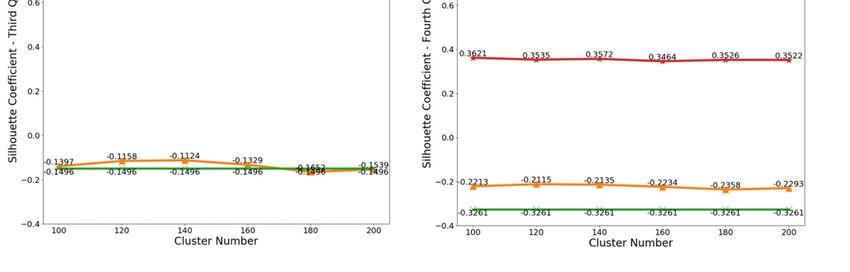
Figure
Figure1212
shows
showsthe Silhouette
the Silhouette Coefficients
Coefficients value
valueofof
different
differentclustering
clustering algorithms
algorithmsinin
different
different
quarters. In each subgraph, the abscissa represents the number of different clusters and
quarters. In each subgraph, the abscissa represents the number of different clusters and the ordinate the ordinate
represents
representsthe value
the ofof
value thethe
Silhouette
Silhouette Coefficients.
Coefficients. Generally,
Generally, thethe
Silhouette
Silhouette Coefficients ofof
Coefficients spectral
spectral
clustering algorithm are around 0.9 and it proves the algorithm performs best.
clustering algorithm are around 0.9 and it proves the algorithm performs best. The Silhouette The Silhouette
Coefficients of K-means
Coefficients of K-meansis around 0.4 and0.4
is around it shows
and itK-means
shows is not so good.
K-means is notThesoSilhouette
good. TheCoefficients
Silhouette
ofCoefficients
DBSCAN and of hierarchical
DBSCAN and clustering is around
hierarchical −0.3,iswhich
clustering aroundexplains both algorithms
−0.3, which are not
explains both good
algorithms
choices for our model. In addition, the number of clusters of DBSCAN is automatically
are not good choices for our model. In addition, the number of clusters of DBSCAN is automatically generated, and
the Silhouette Coefficients value is independent of the value of the abscissa.
generated, and the Silhouette Coefficients value is independent of the value of the abscissa.
Figure 12. The Silhouette Coefficients of different clustering algorithm.
Figure 12. The Silhouette Coefficients of different clustering algorithm.
4.3.4. Hot Topic Community Results and Analysis
4.3.4. Hot 13
Figure Topic Community
shows the resultResults and Analysis
of hot topic communities clustered by spectral clustering algorithm,
which performs best in the four clustering algorithms.
Figure 13 shows the result of hot topic communities For better display,
clustered the top clustering
by spectral 10 most frequently
algorithm,
occurring topic labels
which performs bestare
in chosen
the fourinclustering
each hot topic community.
algorithms. Tabledisplay,
For better 3 showsthe
some
topof
10the topic
most labels
frequently
in hot topic communities.Future Internet 2019, 11, 60 13 of 16
Future Internet 2019, 11, x FOR PEER REVIEW 14 of 16
Figure 13. Hot topic community results in different quarters.
Figure 13. Hot topic community results in different quarters.
Table 3. Part of frequently occurring topic labels.
Table 5. Hot topics from each social networks.
Time Part of Frequently Occurring Topic Labels
Social Network Hot Topics
singing party, new song, Chinese pop, Hollywood, music scene, ceremony, cold wind,
1st Quarter song, music, food, QQ farm, QQ ranch, study, Shanghai, Alipay, Friday,
poster, earn money, cooperation, cultural exchange, spring festival, commerce
QQ Zone children, graduation, school, go to work, help, student, overtime, shopping,
radioactivity,
Japan,classmates, casualties, earthquake,
earthquake, refugee, foreboding, resignation, opposition,
job, books, money
2nd Quarter
snow, demonstration, biota, fuel, fire accident, indiscriminate charging
Test, holiday, sunny, Japan, earthquake, snow, share, People's Daily, music,
Weibo Libyan, weapon,
Test,Gaddafi, kill, Red Cross,rain,
director,
Red military, base interest, country,
3rdSina
Quarter game, government, panda, Cross, military, weapon, army,
Ministry of Culture, condemn, money, celebrate, central weather station
1911 Revolution, nuclear power plant
1911 Revolution, 100years, China,
News, economic, Wuchang, army, challenge,
South, commemorate,
fire, Hollywood, government,
casualties, Japan,
4th QuarterNews
Netease Prime Minister rain, Guangdong, tropical storm, risk, disaster relief
earthquake, Red Cross, Syria, 1911 Revolution, railway accident
5. Conclusions
The hot topicand Future Workin the first quarter are mainly focused on entertainment topics due to
communities
the new year and spring festival.
In this paper, a hot topic In the second
community quarter,
discovery theon
method earthquake
cross socialinnetworks
Japan becomes the focus
is proposed. By of
attention.
building Hot topicsdata
a unified are mainly
model focused
in cross on social
social events inthe
networks, theimproved
third quarter, suchtopic
LB-LDA as “Libyan
model Qaddafi
and
arrested”, “Guo Meimei incident “, “Rainstorm in Guangdong” etc. In the fourth quarter,
clustering algorithms are used to discover hot topic communities. Using the method we put forward, the 100th
anniversary of the 1911 Revolution turns into a new hot topic.Future Internet 2019, 11, 60 14 of 16
To verify our topic discovery results, we found the hot news of 2011 summarized by the Xinhua
News Agency (http://www.xinhuanet.com/2011xwfyb/). Some of the news is shown in Table 4.
The news “The Ningbo—Wenzhou railway traffic accident”, “The celebration of 1911 Revolution”,
“Earthquake happened in Japan”, “Gaddafi was captured and killed”, “NATO bombs Libya” etc. have
been discovered in our hot topic communities. We have bolded the topics in Table 3 and related events
in Table 4. As we can see, in the first quarter, we find no hot topic communities related to hot news.
We think that it is because the hot topics that we find are generally related to the Spring Festival, but
the Spring Festival really cannot be considered as annual news. However, in reality, Spring Festival
must be a hot topic in the first quarter in China.
Table 4. Hot news summarized by the Xinhua News Agency.
National News International News
Drunk driving is punishable Earthquake happens in Japan
The Ningbo-Wenzhou railway traffic accident Gaddafi captured and killed
The celebration of 1911 Revolution NATO bombs Libya
The most restrictive property market in history The death of Steve Jobs
Tiangong-1 successfully launched US Army kills Bin Laden
To verify the effectiveness of cross social networks, we conducted an experiment on each social
network. Considering that the data volume of each social network is not large, we did not divide it
into quarters like cross social networks. The result of the hot topics is shown in Table 5 and topics
mentioned in the result of cross social networks are bolded. As we can see, the hot topics from each
social network are part of hot topics from cross social networks. Certainly, hot topics from each social
network also contain the topics that are not mentioned in our pervious result. This is because these
topics are hot topics in the current social network, but cannot be regarded as hot topics in the cross
social network. Sina Weibo and Netease News contains more hot topics and QQ Zone contains fewer
hot topics. This is because hot topics are usually associated with major events. Information from Sina
Weibo and Netease News usually relate to these events and data from QQ Zone is usually associated
with daily life. Compared with daily life, social events are more likely to be hot topics. The result
proves that our method about cross social network is effective.
Table 5. Hot topics from each social networks.
Social Network Hot Topics
song, music, food, QQ farm, QQ ranch, study, Shanghai, Alipay, Friday, children,
QQ Zone graduation, school, go to work, help, student, overtime, shopping, classmates, earthquake,
job, books, money
Test, holiday, sunny, Japan, earthquake, snow, share, People’s Daily, music, game, Test,
Sina Weibo government, panda, rain, Red Cross, military, weapon, army, 1911 Revolution, nuclear
power plant
News, economic, China, South, fire, Hollywood, casualties, Japan, earthquake, Red
Netease News
Cross, Syria, 1911 Revolution, railway accident
5. Conclusions and Future Work
In this paper, a hot topic community discovery method on cross social networks is proposed.
By building a unified data model in cross social networks, the improved LB-LDA topic model
and clustering algorithms are used to discover hot topic communities. Using the method we put
forward, the hot topic communities from data in three social networks, including Tencent QQ Zone,
Sina Weibo, and Netease News in 2011, are obtained. An amount of hot topic communities including
“The Ningbo—Wenzhou railway traffic accident”, “The celebration of 1911 Revolution”, “Earthquake
happened in Japan”, “Gaddafi was captured and killed”, “NATO bombs Libya” etc. can be found inYou can also read