Global Resources & Reserves - Security of long-term n supply 2020 Update
←
→
Page content transcription
If your browser does not render page correctly, please read the page content below
Global Resources & Reserves

         Security of long-term Ɵn supply
                            2020 Update
Contents
 Global Resources and Reserves .......................................................................................................... 3
 Summary ............................................................................................................................................. 3
 The Risk: Critical Materials .................................................................................................................. 3
 Resources and Reserves...................................................................................................................... 4
    Tin resources and reserves calculation ........................................................................................... 5
    ITA’s estimate of global tin resources and reserves ....................................................................... 6
 Resources and Reserves by Region ..................................................................................................... 8
    North America ................................................................................................................................. 8
    South America ................................................................................................................................. 9
    Africa ............................................................................................................................................. 10
    Europe ........................................................................................................................................... 11
    Australia ........................................................................................................................................ 12
    South East Asia .............................................................................................................................. 12
    Middle East and India.................................................................................................................... 13
    China ............................................................................................................................................. 13
 Analysis ............................................................................................................................................. 14
    Limitations of resource and reserve estimates............................................................................. 14
    USGS studies on tin resources and reserves ................................................................................. 16
    Outlook for tin supply ................................................................................................................... 17
 References ........................................................................................................................................ 19
Global Resources and Reserves
Summary
    •   According to ITA calculations, the world’s reported tin resources at the end of 2019 totalled
        some 15.4 Mt, including some 5.5 Mt of reserves. Of this, some 39% (6.0 Mt) of resources and
        29% (1.6 Mt) of reserves were compliant with CRIRSCO standards.
    •   The top five countries as a proportion of global compliant resources were Russia (29%),
        Australia (15%), Peru (9%), DR Congo (9%) and Brazil (8%). When non-compliant resources are
        included, the top five countries become China (38%), Russia (11%), Australia (7%), Indonesia
        (7%) and Bolivia (4%).
    •   When considering just the defined tin resources, current demand levels can be supported for
        another 50 years. However, the potential of unreported and undiscovered tin worldwide is
        enough to support demand long into the future. However, many defined tin resources will
        require higher tin prices or more efficient extraction technologies to become economic for
        development.
    •   The current low tin price represents a risk to short-term supply due to reduced investment in
        tin projects. However, it is important to clarify that this is unrelated to the amount of metal in
        the ground.

The Risk: Critical Materials
The long-term supply of any material is a top priority for downstream users and policy makers. The
perception that a material is “running out” can lead to researchers looking to alternatives for new
technologies, companies replacing the material with more abundant options, and policy makers
labelling it as “critical” which can lead to legislation to limit consumption.

All three possibilities threaten tin use. Tinplate packing is already being replaced by aluminium and
plastic. Tin remains on the edge of criticality in Europe but is already a critical metal in China and the
US. Lithium-ion batteries, which represent a significant new market for tin, are still in research and
development; if long-term supply is limited, researchers may look elsewhere.

Different countries have different definitions of critical
materials, but they are generally assessed on their
supply risk and economic importance. Materials that
have a significant supply risk in one country may have a
much lower risk in the country that supplies them. In the
European Union’s criticality matrix, tin’s low supply risk
means it falls just outside of the critical zone. However,
if this supply risk is interpreted differently, or the
threshold values change, the result could differ. Indeed,
in China and the United States, tin is already labelled as
critical.
                                                              Data: European Commission
China and the US are aiming to reduce their reliance on
imports of critical materials, or to improve their access. The US gets much of its tin supply from South
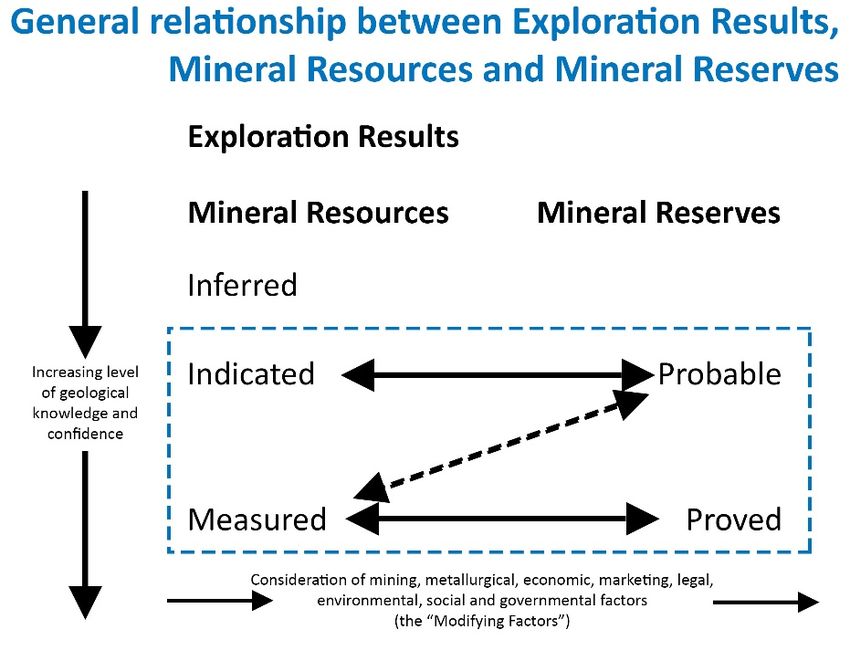
America, with some coming from the recycling of solder production wastes. While part of the country’s
critical materials strategy includes domestic mineral exploration, the report also calls for the
government to develop alternatives to critical minerals. As previously mentioned, this could be
detrimental to tin use – although tin’s main use, solder, has relatively few replacements.

Nevertheless, the move by the world’s two largest economies to label tin as a critical material is
worrying. In general, the ITA believes that tin’s supply risk is overstated. To assess this, the ITA has
compiled information of global resources and reserves to demonstrate the security of long-term supply.

Resources and Reserves
There is a plethora of different terms for defining the size of a geological deposit. These are often
confusing for those outside the mining industry, but the most common terms are “resource” and
“reserve”.

Reporting the resource and reserve of a new mineral deposit is an important part of attracting
investment. However, these reports are commonly tailored to the country where the deposit is located,
or where the company is registered. The Committee for Mineral Reserves International Reporting
Standards (CRIRSCO) is an inter-organisational body that brings together international reporting
standards around the globe. Australasia, Canada, Chile, Europe, Mongolia, Russia, South Africa, and the
United States of America have been members for some time, while India and Kazakhstan have recently
joined. China and Turkey are looking to join in the future.

CRIRSCO produced a set of agreed standard definitions for the reporting of Exploration Results, Mineral
Resources and Mineral Reserves (CRIRSCO, 2019). These definitions can be found below:

“A ‘Mineral Resource’ is a concentration or occurrence of material of economic interest in or on the
Earth’s crust in such form, quality and quantity that there are reasonable prospects for eventual
economic extraction. The location, quantity, grade, continuity and other geological characteristics of a
Mineral Resource are known, estimated or interpreted from specific geological evidence and knowledge,
including sampling. Mineral Resources are subdivided, in order of increasing geological confidence into
Inferred, Indicated and Measured categories.”

“A ‘Mineral Reserve’ is the economically mineable part of a Measured and/or Indicated Mineral
Resource. It includes diluting materials and allowances for losses, which may occur when the material is
mined or extracted and is defined by studies at Pre-Feasibility or Feasibility level as appropriate that
include application of Modifying Factors. Such studies demonstrate that, at the time of reporting,
extraction could reasonably be justified.”

                  Source: CRIRSCO
To summarise, reserves require that a deposit can be shown to be profitably mined at the time of
reporting, whereas resources refer to material considered a reasonable prospect for profitable
extraction at some point in the future.

Tin resources and reserves calculation
This report aims to provide a reliable, minimum estimation of available global tin resources and
reserves. Therefore, the contained data uses the most up-to-date reported resource and reserve
estimates for 338 deposits and mining districts or regions. Data sources include information publicly
reported by companies, in scientific papers, and from national geological surveys.

While every effort was made to maximise the coverage of this study, there will be many more economic
occurrences of tin which did not have any publicly available information or that weren’t fully assessed
at the time of publication.

Reserve and resource data are split into CRIRSCO and non-CRIRSCO groupings based on the specific
reporting standards and quality of sources in each case. Figures reported that do not adhere to the
CRIRSCO template are less reliable but must be included in our analysis because current tin production
globally is heavily weighted towards countries which are not part of CRIRSCO, such as China and
Indonesia. To illustrate this point further, 56% of 2019 mined tin production came from countries with
CRIRSCO-compliant tin resources and only 29% where the CRIRSCO resource is significant (the resource
exceeds the production of tin from the country during the year). However, this rises to 100% and 98%
of production in each instance respectively when non-CRIRSCO resources are included.

Where estimates for existing or recently closed mines are out of date and production data between the
resource year and the end of 2019 exists, the latter was subtracted from the former, with reserves
depleted first. Potential undiscovered and speculative resources are not included in the ITA estimates
but are discussed within the report.
ITA’s estimate of global tin resources and reserves
Tin resources globally, as calculated by ITA, totalled 15.4 Mt at the end of 2019, of which 6.0 Mt (38.9%)
was CRIRSCO-compliant. Global tin reserves, a subset of the aforementioned figure, totalled 5.5 Mt, of
which less than one third (1.6 Mt) was reported to CRIRSCO standards. The proportion of CRIRSCO-
compliant resources and reserves should increase dramatically in the next few years once China
become part of the reporting group.

Based on 2019 tin mine production of 305.8 kt, present global tin reserves will last a minimum of 18.0
years, while resources will last a minimum of 50.4 years. Geographically, the majority of CRIRSCO-
compliant resources and reserves come from Europe, Australia and South America, whereas most non-
complaint resources are found in Central and Eastern Asia.

                                                                          World tin reserves and resources
                                                                                                         '000 tonnes of contained tin
                                                CRIRSCO           Non-CRIRSCO             Total
Country              2019 mine production Resources* Reserves Resources* Reserves Resources* Reserves
Afghanistan                                    0       0                  0                18                 0                 18                 0
China                                         80       0                  0             5,988             2,160              5,988             2,160
India                                          0       0                  0               102                 1                102                 1
Indonesia                                     78      32                 16             1,044               415              1,075               431
Kazakhstan                                     0     351                  0                 0                 0                351                 0
Kyrgyzstan                                     0       0                  0               205                 0                205                 0
Laos                                           2       0                  0                81                46                 81                46
Malaysia                                       4      51                 11                 0                 0                 51                11
Mongolia                                       0       7                  0                99                 6                106                 6
Myanmar                                       46       0                  0               113               113                113               113
Tajikistan                                     0       0                  0                45                 0                 45                 0
Thailand                                       0       0                  0                64                 0                 64                 0
Vietnam                                        5       0                  0                48                11                 48                11
Asia total                                   215    441                 27            7,808              2,753             8,249             2,779
Bolivia                                       18      76                20                623                228               700               248
Brazil                                        20     493               325                 80                 80               573               405
Canada                                         0     110                 0                  7                  0               117                 0
Peru                                          19     546               218                 91                  0               638               218
USA                                            0       0                 0                 72                  0                72                 0
Argentina                                      0       0                 0                  0                  3                 0                 3
Americas total                                57   1,226              563                873               308             2,099                871
Czech Republic                                 0      263                0                 32                  0               295                 0
Germany                                        0      309                0                207                  0               516                 0
Portugal                                       0       26                3                 13                  0                39                 3
Russia                                         2    1,791              588                  0                340             1,791               928
Spain                                          0       69                0                  0                  0                69                 0
UK                                             0      264                0                  0                  0               264                 0
Europe total                                   3   2,721              591                253               340             2,974                931
Australia                                      8    908               228                243                   0           1,151                228
DR Congo                                      13     519               167                   0                 0               519               167
Egypt                                          0      40                 0                   0               415                40               415
Morocco                                        0     131                57                   0                 0               131                57
Nigeria                                        6       0                 0                  75                 0                75                 0
Rwanda                                         4      23                 6                  91                 8               114                14
Other Africa                                   0       0                 0                   0                 0                 0                 0
Africa total                                  24    713               231                166               423                879               653
World Total                                  306   6,000          1,600              9,300              3,800           15,400              5,500
Data: ITA, BGR, NBSC, Various company data                  *All resource figures are inclusive of reserves, world totals rounded excluding production
2019 Global Tin Resources

2019 Global Tin Reserves
Resources and Reserves by Region
While global tin reserves and resources indicate around 18 and 50 years of remaining consumption,
there is a significant regional difference. For example, in Europe, known resources would last over 1,000
years at current mining rates. Below we explore this variation in more detail, with emphasis on up-and-
coming projects or important existing mines.

North America
North America currently has no active mines and has almost no exploration has taken place in recent
years. Apart from the East Kemptville project in Canada, there are no other mines in development.
However, the prospects for future supply are good, with the Appalachian mountain belt, Alaska and the
Carolina Tin-Spodumene Belt being the standout areas for future exploration. Tin is now labelled as a
critical material in the United States, and this could bring more activity in the near future.

United States
There is currently no tin mining in United States of America. It has only two named deposits: Kougarok
and Sleitat Mountain, both of which are in the state of Alaska. Neither has a CRIRSCO-compliant
resource, although historical estimates place their combined resource at some 85.6 kt. Only that of
Sleitat Mountain has been included however, as the resource for Kougarok is speculative. Despite the
lack of known deposits, the North American geology is favourable for tin deposits. The USGS Mineral
Resources Data System (USGS, n.d.) lists nearly 1,500 individual tin occurrences, prospects and closed
mines in the US alone. Many of these are clustered in the Carolina Tin Belt – an area currently being
developed for lithium mining – or in Alaska. This is a good example of an area with huge potential for
tin resources in a tin-poor region of the world and is therefore a good analogue for the vast potential
for additional unreported or unknown tin deposits worldwide.
Canada
Canada, like the US, currently has no active tin mines, although exploration and development is on-
going at the East Kemptville mine in Nova Scotia. Avalon Advanced Materials, which owns the project,
will begin construction within 16 months of project financing, with the goal to start in 2020 (Avalon
Advanced Materials, 2019). There are two additional prospects in the country, JC Smart and Mount
Pleasant. Combined, the three projects have a resource of over 115 kt tonnes, with 95% CRIRSCO-
compliant.

South America
South American production of tin concentrates peaked in 1989 at over 75 kt of contained tin. However,
since 2000, production from the continent has been falling as grades at historical mines decline. Tin
exploration has been fairly limited, with only established producers increasing known resources and
reserves. Recently, however, new junior mining companies have begun work across the continent.

Bolivia
Bolivia’s estimated resources of 700 kt of contained tin, with reserves of nearly 250 kt, are a
combination of the country’s two state-run mines, Huanuni and Colquiri, as well as projects in Catavi.
These projects are run by co-operatives near the historical Siglo XX mine. Additional speculative
resources come from several tin tailings projects near Catavi, however much of this is an exploration
target and little drilling has taken place to prove this resource. As such, these resources are not included
in this summary.

Peru
Peru’s tin industry has long been dominated by Minsur’s San Rafael Mine, which began operating in
1975. As a result, much of the country’s 550 kt resource belongs to the company and is CRIRSCO-
compliant. The company’s B2 project will reprocess the mine’s extensive tailings; at more than 1% Sn,
the grade is higher than most greenfield projects. B2 contains some 81.5 kt of tin as a resource, with
some 96% classified as reserve (Minsur S.A., 2018).

Newcomer Tinka Resources is developing the Ayawilca project in the Pasco department towards the
centre of the country. Although the resource is not yet CRIRSCO-compliant, the project is undergoing
development – although the focus is currently on the areas of zinc mineralisation. It is estimated that
the project has over 90 kt of tin as a resource (Ayawilca Polymetallic Project NI 43-101 Technical Report,
2019).

Brazil
The country has a CRIRSCO-complaint resource of 493 kt, 65% of which are classified as reserves. These
reserves belong wholly to Taboca’s Pitinga mine, meaning it has the largest CRIRSCO-compliant tin
resource and reserve in the world. At current production rates, reserves would last for another 20 years.
However, according to Minsur’s 2018 annual report (Minsur S.A., 2018), the resources are estimated
using an assumed tin price of nearly US$ 24,000; reserves use US$ 20,000. At current tin prices, some
of this may no longer be economical.

Additional, non-compliant resources for other Brazilian projects – as estimated by the country’s
department of mineral production – of some 80 kt, are also included in ITA’s estimate of Brazil’s tin
resource.
Argentina
Currently, Argentina has no CRIRSCO-compliant reserves, although estimates from junior mining
company Alto Grande SA include a non-compliant reserve of 2.5 kt and additional speculative resources
of 5.5 kt at its Vil Achay project (Buslaiman, 2018). Vil Achay was previously mined for tin between 1939
and 1984.

Africa
Africa has grown into the tin market in recent years, with a move away from traditional artisanal or
small-scale mining (ASM) methods to more mechanised, large-scale mining. This has helped to almost
double production of tin-in-concentrate from 2015. However, over half of African production is still
extracted by ASM methods, which – due to the sectors informal nature – results in large year-on-year
variations. These mine workings also have little in the way of resource estimates. It is therefore difficult
to estimate exactly how long resources will last for, but it is likely to be greater than the 40-year
estimate based on the available data.

Namibia
Namibia is one of the up-and-coming regions of Africa in terms of tin production, with the Uis project
– operated by AfriTin Mining – producing its first concentrate in 2019. The mine has CRIRSCO-compliant
resources totalling some 95 kt of tin (AfriTin Mining, 2019). This is expected to expand as the company
explores the numerous likely tin-bearing pegmatites in the vicinity of the mine.

Uis was also a producing mine before the tin price collapse of the mid-1980s, and as such has a
significant tailings dump. Montero Mining filed an Inferred NI 43-101 complaint Mineral Resource of
17.1 Mt at 0.05% Sn for these tailings in early 2019 (Montero Mining and Exploration, 2019).

DR Congo
In terms of CRIRSCO-complaint resources and reserves, the Democratic Republic of Congo has the third-
largest resources and the second-largest reserves in the world, split between two major mine projects.
The Bisie project has some 165 kt of tin in reserves (The MSA Group, 2017), primarily from the Mpama
North section of the deposit. The southern part is expected to be comparable in size to the north but
does not yet have a defined or estimated resource. The Manono lithium project has some 220 kt of
contained tin as a resource (AVZ Minerals Ltd, 2019) and is expected to enter the market in 2021.

Other regions
South Africa was a historically important mining region, although there is little current production. The
country holds over 18 kt of CRIRSCO-compliant resources, with no complaint reserves. The Bushveld
Complex, once home to the Zaaiplaats mine, is the main potential source of tin, either from
reprocessing tailings or from brownfield exploration.

Due to the mainly ASM-based production in the Rwanda, resource estimates are few and far between.
However, junior mining company Piran Resources released a CRIRSCO-compliant resource of some 28.5
kt in 2019 (Piran Resources Ltd, 2019). This also included some 40 kt of non-compliant resources.
Additional non-compliant resources (some 24 kt) come from the main producer in the country, Rutongo
Mines.

Tin mining has been a staple in Nigeria for hundreds of years, but most of this is ASM. As such, there
are no CRIRSCO-compliant resources or reserves in the country. Non-complaint resources total some
65 kt, although none can be classified as reserves. Some works estimate national reserves on the scale
of 300 kt (Gyang, Nanle, & Chollom, 2010).

Both Egypt and Morocco are home to large tin projects – Abu Dabbab and Achmmach, respectively.
However, only Achmmach is currently being developed. Both projects have CRIRCSCO-complaint
resources (40 kt (Kinnaird, Nex, & Milani, 2016) and 127 kt (Kasbah Resources, 2018), respectively),
while Achmmach has complaint reserves of 58 kt (Kasbah Resources, 2018). Proposed changes to the
Egyptian mining laws could see exploration return to Abu Dabbab in the future.

Somalia and Burundi have some artisanal mining activity and minor reported resources of less than 2.7
kt. Zimbabwe’s historical Kamativi Mine still holds over 120 kt of tin as a non-compliant resource
(Zimbabwe Mining Development Corporation, 2017), both in the ground and in its tailings dumps.

Europe
Europe is home to several historical tin mining regions, including Cornwall in the UK, northwest Iberia
(covering Spain and Portugal), and the Western Ore Mountains on the German-Czech Republic border.
Some tin is being produced in Russia and as a by-product in Spain. Most tin resources in this region
belong to projects attempting to revive historical operations, although there are some greenfield
projects in Spain.

United Kingdom
Cornwall, UK is perhaps the most famous of all historical tin mining areas, but there has been little
production since the South Crofty mine closed in 1998. Work is underway in Cornwall and at the
recently closed Hemerdon to revive these older mines. The UK holds CRIRSCO-compliant tin resources
of over 260 kt.

Russia
Current tin mining operations in Russia include Perevalnoye and Festivalnoye, both operated by
Seligdar, and the Khingan Tailings project. Combined, these mines produce just 2.7 ktpa (Ministry of
Natural Resources of Russia, 2019). However, Russia is one of the most prospective countries for tin
and is number one for CRIRSCO-complaint resources and reserves with nearly 1.8 Mt of resources
spread across 18 reporting projects. Russian tin mining is generally concentrated to the east of the
country, along the Stanovoy Mountain Range and the border with China. The isolated nature of these
mines makes them difficult investment propositions, however.

Germany
Most resources in Germany are held in historical mines. Many of these are being reassessed for their
lithium potential, including Sadisdorf and Zinnwald, and the country has a large CRIRSCO-compliant tin
resource totalling some 308 kt. However, none of the tin can be classified as a reserve. Non-compliant
resources total an additional 207 kt, while the country is also host to significant speculative tin
resources totalling some 390 kt.

Czech Republic
Like Germany, interest in lithium has seen the economic potential of many older mines reassessed. The
major tin-containing project is Cinovec, which is currently in development. This mine holds over 260 kt
of CRIRSCO-compliant tin resources (European Metals, 2019). There are thought to be over 100 kt of
additional tin resources in the country, although these are purely speculative.
Spain and Portugal
Spain has CRIRSCO-compliant resources of nearly 70kt, with additional speculative resources of over
100 kt. Elementos, a junior mining company, is looking to begin mining at the Oropesa project in 2021.
This project holds some 67 kt of tin as a CRIRSCO-compliant resource (Elementos Ltd, 2019).

Portugal is home to several historical mines, including Panasqueira, which now produces tungsten. In
total, the country holds over 25 kt of CRIRSCO-compliant tin resources, 3.5 kt of which can be classified
as reserves.

Australia
Australia remains a globally significant producer of tin concentrates, with Renison Bell and other minor
producers contributing 7.7 kt to the global market in 2019. The country is highly prospective for tin,
boasting nearly 90 different named prospects or deposits. Most of the active exploration and
development is confined to the structures along the Federal-Bassett Fault in Tasmania. This is the main
structural control on the mineralisation at Renison Bell, and many of the junior companies are hopeful
that mineralisation can be found further along the fault.

Of the discovered deposits, Renison Bell and its associated tailings project, Rentails, hold the greatest
reserve of tin at a combined 180 kt – 70% of the country’s CRIRSCO-compliant reserve (Metals X Ltd,
2019). The country also holds another 240 kt of tin in non-compliant resources. Many of the projects
that comprise this additional resource are no longer actively explored, although some could be
medium-sized mines if developed.

South East Asia
Myanmar
Myanmar became the world’s third-largest producer of tin concentrates in 2013, but due to the small-
scale nature of mining activity in the country, hosts very little in terms of tin reserves and resources.
Much of the country’s production comes from the Man Maw mining district in the east of the country,
along the border with China. Not much is known about this deposit, although it has similarities with
mines in Gejiu, China and Tasmania, Australia. If similar to Renison Bell, Tasmania, resources could be
anywhere between 0.1 Mt and 1 Mt. However, in this summary, only 113 kt of resources are reported,
primarily from mines in the south of the country.

Malaysia and Thailand
While both countries were major producers in the early 1980s, production declined rapidly throughout
the following two decades due to depleting resources and the low prices that followed the 1985 tin
price crash.

The Rahman Hydraulic tin mine in Malaysia and resources offshore of Thailand in the Andaman Sea
comprise the totality of the reported resources for the two countries, totalling some 100 kt. However,
Elementos holds an interest in the Temengor mine, which operated until the mid-1930’s (Elementos
Ltd, 2019), while Malaysia Smelting Corporation (owner of Rahman Hydraulic) plans to expand its
mining activities to Sungai Lembing, Pahang (Malaysia Smelting Corporation, 2018). Neither of these
new mines have a defined resource yet, although the geology at the Temengor project is thought to
bear similarities to the Rahman Hydraulic mine, and so may hold similar levels of resources.
Indonesia
Indonesia remains the second largest
producer of tin globally, mining an
estimated 77.5 kt of tin in 2019. Although
the country hosts many private smelters,
most of the tin resources (around 96%
according to local sources) are held by
the state-run company, PT Timah. In
2018, the company’s reserves totalled
some 415 kt, with a resource of over 1 Mt
(Albar, 2019). Advances in extraction
technology, as well as onshore
exploration, have increased total reserves by 23% from 2017.

Other Regions
Other areas in South East Asia, namely Vietnam, Laos and Mongolia, have very little tin mining activity.
This is primarily ASM, and as such as little in the way of CRIRSCO-complaint resources. Only the Narsiin
Khundlen deposit in Mongolia has a complaint resource, but this is only 7 kt. The three countries have
a combined total resource of 228 kt and a reserve of 62.5 kt.

Middle East and India
This area of the world has had little historical tin production but remains highly prospective. Only the
Syrymbet project in Kazakhstan has CRIRSCO-complaint resources, but these are almost equal to total
resources elsewhere in the region (351 kt vs 370 kt). Afghanistan has been extensively explored, with
many deposits identified. However, no resources have been publically reported for the majority; only
the Taghawlor Field has a resource, totalling some 17.5 kt (Peters, 2011). Three prospective areas have
been identified in India, with a combined non-compliant resource of over 100 kt. In Kyrgyszstan, the
combination of the Trudovoe and Uchkoshkon deposits is thought to hold over 200 kt of tin (Rogalsky,
2019).

China
For either total resources or reserves,
China appears to have the greatest
potential in the world. The estimate in
this report uses the country’s official
figures as reported by the National
Bureau of Statistics of China and the
China Mineral Resources Report (Ministry
of Natural Resources, PRC, 2018). The
2018 report estimates that the country
has a resource of over 4.5 Mt, of which
1.2 Mt are reserves. These totals have
been boosted by an increase in
exploration, with resources rising 1.1% between 2016 and 2017. This bucks the trend of slowly declining
resources that have been seen over the past decade. However, these figures are reported nationally,
and the standards are unclear, meaning that all estimates of tin in China are assumed to be non-
compliant with CRIRSCO reporting standards.

Other sources of information for Chinese resources include the USGS and DERA. However, these
numbers differ greatly. The USGS estimated that China held just 1.1 Mt of tin as a resource in 2019
(USGS, 2019), while the 2014 DERA report (Elsner, 2014) estimated 4.7 Mt.

Analysis
Compared to commercially viable deposits of
other base metals, tin deposits are generally
small. All deposits covered in this study fell within
the range of 0.01 – 5% Sn, with ore tonnages less
than 1,000 Mt. In terms of tin content, the largest
single deposit contained less than 500 kt.

The figure (right) indicates one of the issues with
resource and reserve estimates. Because the
definition has an economic component, smaller
deposits (~1 kt contained tin) are generally
overlooked. Only one deposit falls close to this
line on the figure. Most are clustered between
the 10 kt – 100 kt contained tin lines. Larger areas
(e.g. offshore Indonesia) did contain more tin but
could not be classified as a singular deposit, and so are not included in the figure.

Limitations of resource and reserve estimates
General issues
Resources and reserves suffer from the misconception that they are a limited pool of material that will
deplete over time. Firstly, resources and reserves only refer to known deposits, which can be
considered relatively few compared to the vast potential for new discoveries. Large regions of Earth
have not been thoroughly explored due to their remote location, inhospitable terrain, or geopolitical
climate. Furthermore, regions that have been explored may not have been explored at depth; African
mining mainly takes place close to the surface, but mineralisation may extend deeper, potentially at
higher grades. Moreover, most of the exploration is on land, although it is likely that there are
considerable resources on, or below, the seafloor. This has been exploited in South East Asia, but
nowhere else in the world. Most exploration continues to be focussed in traditionally safe jurisdictions,
for example Australia. Higher prices may encourage activity in higher risk regions such as Africa and the
former Soviet Union.

Secondly, resources and reserves are only estimated for deposits which are deemed to have short to
medium term economic potential and where there is money to carry out the drilling and other activities
required to define a resource or reserve according to the required standards. Over time, additional
resources and reserves will be added due to additional results of exploration activity and technical
innovation in extraction, processing and exploration technologies. More complex ores of lower grades
will become viable and this will increase the known global quantity.
Resources and reserves are defined with an economic component. Resource and reserve statements
will use a cut-off grade to represent the minimum concentrate of metal that is economical to extract.
Only metal content within the assessed area above this concentration will be included. Higher metals
prices and forecasts generally result in lower cut-off grades and larger reserve estimates, while other
key variables such as by-product prices and input costs also affect this grade. This report will contain
many estimates that use different cut-off grades and underlying assumptions, even when following the
same reporting template. This can lead to both over- and under-estimations of resources and reserves.
It is important to be aware that these error margins are unavoidable and are therefore present in this
report.

Even when a deposit has been identified, the full production potential over the life of the mine remains
unknown. Resource announcements will often comment that mineralisation is open along strike or at
depth, meaning that the full extent is unknown. Following the commissioning of the mine, there is a
better understanding of the geology, meaning potential mineralisation can be targeted more accurately
and cheaply. Developed mine infrastructure and better access to utilities can reduce the cost of
exploration, particularly in remote regions. Underground exploration is significantly cheaper when
existing infrastructure can be utilised, rather than drilling directly from the surface.

Therefore, it is common for mines to
operate for longer than their initial
reserves would suggest. San Rafael in
Peru and Renison Bell in Australia are
prime examples of this. This reflects the
evolving knowledge of the deposit as it
is exploited and the fact that companies
will only delineate resources and
reserves as far into the future as
business planning requires. Further
drilling will then occur alongside mining
to define additional resources and reserves to replace depleted ore.

Achieving environmental, social and political license to mine is also a critical hurdle for developing
projects and the estimation of mineral reserves. Even for a world class deposit, if the potential
environmental or social impacts of the mine are too great or political risks too high, development of
the resource may be prevented. This can also be an issue for existing mines, an example being the
dredging of offshore alluvial tin deposits in Indonesia. These operations are criticised as damaging to
coral and sea life and have been the subject of protests by local fisherman. However, it is important to
note that the same political, environmental and social factors that can make a resource unviable can
also be reversed. Changes in government, improving local attitudes towards mining or a better
understanding of the environmental impact of resource extraction and its mitigation can help change
attitudes.

Tin-specific problems
The tin industry has several peculiarities that make accurate estimates of resources and reserves more
difficult than other raw materials.
Artisanal and small-scale mining constitutes around 40% of all tin mine production annually. Because
of the informal nature of the mining, resources and reserves in these areas are typically not known and
rarely reported. The history of the tin industry has been punctuated by surges of production from areas
like these without well-defined tin reserves; Brazil, Indonesia and more recently Myanmar are all good
examples.

Exploration activity typically follows a “boom and bust” pattern in reaction to mineral price cycles.
Access to a potential area can also vary in line with geopolitical factors. Tin has been particularly
affected by this “boom and bust” relationship. Between the tin price crash of 1985 and 2016, only 4
greenfield tin deposits were discovered, despite a peak in renewed exploration activity relating to the
tin price spike of 2011. Although exploration is still stronger than in previous years, current low prices
have stalled progress.

Putting aside tin’s individual price performance, the metal is also commonly mined along metals such
as tungsten, tantalum, copper, zinc, silver and increasingly lithium. A boom in prices across the wider
industry, leading to an increase in general exploration activity, would also have a knock-on impact on
discovery of tin resources. Indeed, in the last few years, many new projects have a by-product, or are
producing tin as a by-product.

Ownership in the tin industry also presents a problem for resource reporting. The high proportion of
state-owned and small private operations, the majority of which do not publish up-to-date resource
estimates, means that there is a limited pool of public information. This means that resource and
reserve estimates detailed in this report are likely lower than might be expected should the industry be
fully transparent.

USGS studies on tin resources and reserves
Other organisations also attempt to estimate global tin reserves and resources. The most commonly
referenced estimates are reported by the USGS on an annual basis. For tin, ITA estimated reserves are
around 1 Mt higher than USGS estimates. The largest discrepancies come from South American and
South East Asian countries, notably Indonesia, Malaysia, Thailand and Brazil, where the USGS reports
far higher figures, and Bolivia and Peru, where USGS estimates are much lower.

                                               USGS reported tin reserves of the last decade
                                                                                             '000 tonnes
                   2009    2010    2011    2012     2013    2014    2015     2016    2017    2018    2019
Australia           150     150     180     180      240     240     370      370     370     490     370
Bolivia             450     450     400     400      400     400     400      400     400     400     400
Brazil              540     540     590     590      710     700     700      700     700     700     700
China              1700    1700    1500    1500     1500    1500    1500     1500    1100    1100    1100
Indonesia           800     800     800     800      800     800     800      800     800     800     800
Malaysia           1000    1000    1000    1000      500     500     250      250     250     250     250
Peru                710     710     710     310      310      91      80      130     100     105     110
Russia              300     300     350     350      350     350     350      350     350     350     350
Thailand            170     170     170     170      170     170     170      170     170     170     170
Other               270     270     250     250      250     180     180      180     410     450     450
World (rounded)    6100    6100    6000    5600     5200    4900    4800     4900    4700    4800    4700
Data: USGS
Outlook for tin supply
World tin production has been relatively
stable for several years, with refined tin
production between roughly 330 ktpa and
370 ktpa, and mine production between
270 kt and 310 kt. The difference between
the two is filled by some 50ktpa – 70ktpa of
secondary refined tin production.
Recycling will continue to play an important
role in future tin supply and is likely to grow
as demand rises. However, there has been
limited investment into tin recycling
technology, and it may be some years
before the major tin resource of end-of-life electronics can be extracted efficiently.
Top 15 undeveloped CRIRSCO-compliant tin resources by tin content
Deposit Country Company Ore (Mt) % Sn Sn (kt)
Syrymbet Kazakhstan TinOne Mining* 90.32 0.39% 351
Manono DR Congo AVZ Minerals 400.00 0.07% 288
Cinovec Czech Republic European Metals 695.90 0.04% 278
Deputatskoe Russia GOK Deputatsky CJSC 22.25 1.15% 256
Pyrkakaysky Russia 91.69 0.26% 238
Tigrinoe Russia 155.08 0.12% 186
Redmoor UK New Age Exploration 11.70 1.17% 137
Achmmach Morocco Kasbah Resources* 14.60 0.90% 131
Odinokoe Russia 39.88 0.32% 128
Nazareth Peru Minsur** 9.00 1.38% 123
Tellerhauser Germany Anglo-Saxony Mining* 30.40 0.38% 116
Gottesburg Germany Anglo-Saxony Mining* 42.10 0.27% 112
Sherlovogorskaya Russia 61.47 0.17% 105
Rentails Australia Bluestones Mines** 23.89 0.44% 104
Verkhneye Russia 33.23 0.30% 100
*ITA Explorers and Developers Group Member **ITA Member
Top 5 undeveloped CRIRSCO-compliant tin reserves by tin content
Deposit Country Company Ore (Mt) % Sn Sn (kt)
Deputatskoe Russia GOK Deputatsky CJSC 17.24 1.15% 198
Rentails Australia Metals X** 22.31 0.44% 99
Achmmach Morocco Kasbah Resources* 7.00 0.82% 57
Sherlovogorskaya Russia 28.82 0.17% 49
Taronga Australia Aus Tin Mining* 22.00 0.16% 36
*ITA Explorers and Developers Group Member **ITA MemberWith significant tin reserves and recycling likely to increase, there is no reason to suggest than the tin market cannot support a long-term upwards trend in tin demand in the future. Although it is clear than many tin mines and mining regions may be past their peak, there is reason to believe that increased tin prices will fuel exploration and fund the new generation of tin mines. It is expected that the resources and reserves of these promising projects will grow significantly over this period. Only in the last few years have excess stocks been finally reduced to historically below-average levels, as supply has failed to keep up with demand. While there are short-term uncertainties relating mainly to global macro-economic conditions, the prospects for future tin demand are strong. As a result, ITA still believes that there is still a real need for new investment in modern, sustainable mine projects and that prices significantly higher than current levels are necessary to trigger this. There is a small but real possibility that a surge in production will occur due to the discovery of a world class tin deposit, such as has been seen in Myanmar between 2012 and 2015. The underexplored, vast mineral potential of South East Asia and Africa would make these likely locations, particularly if progress is made with development of infrastructure and channels for foreign investment. North America may see increased exploration soon, as the United States aims to reduce its reliance on imports of critical material. However, it is vitally important for the image of tin, transparency and confidence in supply from downstream buyers, that the market share of sustainable, and transparent tin mining is maximised. It is likely that that small-scale and artisanal mining will continue to be prominent feature of the tin industry, so it is important that efforts to formalise artisanal mining and establish good practise are successful. To summarise, while ITA expects a shortage of tin mining capacity to develop over the next 5 years, but this is unrelated to the quantity of remaining tin in the ground, and rather a symptom of low investment in tin projects in depressed market conditions.
References
AfriTin Mining. (2019, November). AfriTin Mining Investor Presentation. Retrieved January 21, 2020,
        from AfriTin Mining: https://afritinmining-
        my.sharepoint.com/personal/jeneth_ndlovu_afritinmining_com/_layouts/15/onedrive.aspx?i
        d=%2Fpersonal%2Fjeneth%5Fndlovu%5Fafritinmining%5Fcom%2FDocuments%2FDesktop%2
        FPresentations%2F2019%2D11%2D22%20ATM%20Presentation%20November%202019

Albar, A. (2019). Indonesia Tin Outlook 2019. Xi'an: PT Timah.

Avalon Advanced Materials. (2019, November). East Kemptville Tin Recovery & Site Remediation
        Project: Profitable rehabilitation of a closed mine site. Retrieved 2019, from Avalon Advanced
        Materials: http://avalonadvancedmaterials.com/_resources/presentations/EastKemptville-
        Presentation.pdf

AVZ Minerals Ltd. (2019). The Manono Lithium & Tin Project: The 'Escondida' of Lithium. Retrieved
       November 12, 2019, from AVZ Minerals Ltd:
       http://asx.announcements.rozettatechnology.com/announcements/v1/documents/asx/AVZ/
       2019/11/12/pHd7pvogFomfpsBC03IPqwVYDJXnlauH71t4XWOQf7E/02171733.pdf

Ayawilca Polymetallic Project NI 43-101 Technical Report. (2019, July 2). Retrieved 2019, from Tinka
       Resourrces:
       https://www.tinkaresources.com/assets/docs/reports/Tinka%20Ayawilca%20TR%20Final.pdf

Buslaiman, L. E. (2018). Vil Achay Exploration Project: Mining Prospect Discussion. October.

CRIRSCO. (2019, November). CRIRSCO International Reporting Template. Retrieved from CRIRSCO:
       http://www.crirsco.com/templates/CRIRSCO_International_Reporting_Template_November_
       2019.pdf

Elementos Ltd. (2019, March). Investor Presentation March 2019. Retrieved from Elementos:
       https://www.asx.com.au/asxpdf/20190304/pdf/443655byjx3hm9.pdf

Elsner, H. (2014). Zinn - Angebot und Nachfrage bis 2020. Berlin: DERA-Rohstoffinformationen.

European Metals. (2019, July). European Metals Investor Presentation. Retrieved from European
       Metals: https://www.europeanmet.com/wp-content/uploads/2019/07/European-Metals-
       Presentation-July-19.pdf

Gyang, J., Nanle, N., & Chollom, S. (2010, March). An Overview of Mineral Resources Development in
        Nigeria: Problems and Prospects.

Kasbah Resources. (2018, July 16). Achmmach Tin Project 2018 Definitive Feasbility Study. Retrieved
       January 21, 2020, from Kasbah Resources:
       http://www.kasbahresources.com/site/PDF/1730_0/2018AchmmachTinProjectDefinitiveFeasi
       bilityStudy

Kinnaird, J., Nex, P., & Milani, L. (2016). Tin in Africa. 39(2).

Malaysia Smelting Corporation. (2018). MSC 2018 Annual Report. Retrieved from Malaysia Smelting
       Corporation: https://ir.chartnexus.com/msmelt/pdf/ar2018.pdf
Metals X Ltd. (2019, September). September Quarterly Report. Retrieved from Metals X:
https://www.metalsx.com.au/system/announcements/1033/20190930_September_Qtrly_Re
port.pdf
Ministry of Natural Resources of Russia. (2019). On the State and Use of Mineral Resources of the
Russian Federation in 2018. Ministry of Natural Resources of Russia.
Ministry of Natural Resources, PRC. (2018). China Mineral Resources.
Minsur S.A. (2018, 12 31). Minsur Annual Report 2018. Retrieved 2019, from Minsur S.A.:
https://www.minsur.com/wp-
content/uploads/pdf/Memoria%20Anual/ENG//Minsur_Memoria_Anual_2018_ENGLISH.pdf
Montero Mining and Exploration. (2019, September 30). Management's Discussion and Analysis.
Retrieved January 21, 2020, from Montero Mining and Exploration:
https://www.sedar.com/GetFile.do?lang=EN&docClass=7&issuerNo=00030660&issuerType=0
3&projectNo=02991671&docId=4629745
Peters, S. G. (2011). Summary of the Daykundi Tin, Tungsten, and Lithium Area of Interest. In T. V.
Stephen G. Peters, Summaries of Import Areas for Mineral INvestment and Production
Opportunities of Nonfuel Minerals in Afghanistan. USGS.
Piran Resources Ltd. (2019, September). Tin, tantalum & lithium in Rwanda. Retrieved December 16,
2019, from Piran Resources: https://piran-resources.com/wp-content/uploads/2019-09-13-
Piran-Resources-Corporate-Presentation.pdf
Rogalsky, A. (2019). Report on Classification of Energy and Mineral Resources and its Management in
the Kyrgyz Republic.
The MSA Group. (2017, March 23). Bisie Tin Project NI 43-101 Technical Report. Retrieved January 17,
2020, from Alphamin Resources: https://alphaminresources.com/wp-
content/uploads/2019/11/Alphamin-NI-43-101-Technical-Report-Updated-Feasibility-Study-
and-Control-Budget-Estimate-Report-23-Mar-2017.pdf
United States Department of the Interior. (2018). Draft List of Critical Materials. United States
Department of the Interior.
USGS. (n.d.). (USGS) Retrieved 2019, from Mineral Resources Data System:
https://mrdata.usgs.gov/mrds/map-commodity.html
USGS. (2019). Mineral Commodity Summaries 2019. USGS.
Zimbabwe Mining Development Corporation. (2017). Mining Projects and Opportunities for
Investment 2017. Retrieved from http://www.sera.co.zw/wp-
content/uploads/2018/01/ZMDC-Investment-Opportunity-Brochure-8.pdfUnit 3, Curo Park Tel: +44 (0) 1727 875 544
Frogmore +44 (0) 1727 871 341
Email:info@internationaltin.org
Web:www.internationaltin.org
AL2 2DD
UKYou can also read