Éléonore Site Tour | Management Presentation
←
→
Page content transcription
If your browser does not render page correctly, please read the page content below
Éléonore Site Tour | Management Presentation

September 17, 2018
Forward-Looking Statements

    This presentation contains “forward-looking statements” within the meaning of Section 27A of the United States Securities Act of 1933, as amended, Section 21E of the United States Exchange Act of 1934, as amended, the United
    States Private Securities Litigation Reform Act of 1995, or in releases made by the United States Securities and Exchange Commission, all as may be amended from time to time, and "forward-looking information" under the provisions
    of applicable Canadian securities legislation, concerning the business, operations and financial performance and condition of Goldcorp. Forward-looking statements include, but are not limited to, the future price of gold, silver, zinc,
    copper and lead, the estimation of mineral reserves and mineral resources, the realization of mineral reserve estimates, the timing and amount of estimated future production, costs of production, targeted cost reductions, capital
    expenditures, free cash flow, costs and timing of the development of new deposits, success of exploration activities, permitting and certification time lines, hedging practices, currency exchange rate fluctuations, requirements for
    additional capital, government regulation of mining operations, environmental risks, unanticipated reclamation expenses, health, safety and diversity initiatives, timing and possible outcome of pending litigation, title disputes or claims
    and limitations on insurance coverage. Generally, these forward-looking statements can be identified by the use of words such as “plans”, “expects” , “is expected”, “budget”, “scheduled”, “estimates”, “forecasts”, “intends”, “anticipates” ,
    “believes”, or variations or comparable language of such words and phrases or statements that certain actions, events or results “may”, “could”, “would”, "should", “might” or “will”, “occur” or “be achieved” or the negative connotation
    thereof.

    Forward-looking statements are necessarily based upon a number of factors and assumptions that, if untrue, could cause the actual results, performances or achievements of Goldcorp to be materially different from future results,
    performances or achievements expressed or implied by such statements. Such statements and information are based on numerous assumptions regarding Goldcorp’s present and future business strategies and the environment in
    which Goldcorp will operate in the future, including the price of gold, anticipated costs and ability to achieve goals. Certain important factors that could cause actual results, performances or achievements to differ materially from those in
    the forward-looking statements include, among others, gold price volatility, discrepancies between actual and estimated producti on, mineral reserves and mineral resources and metallurgical recoveries, mining operational and
    development risks, litigation risks, regulatory restrictions (including environmental regulatory restrictions and liability), changes in national and local government legislation, taxation, controls or regulations and/or change in the
    administration of laws, policies and practices, expropriation or nationalization of property and political or economic developments in Canada, the United States, Mexico, Argentina, the Dominican Republic, Chile or other jurisdictions in
    which the Company does or may carry on business in the future, delays, suspension and technical challenges associated with capital projects, higher prices for fuel, steel, power, labour and other consumables, currency fluctuations, the
    speculative nature of gold exploration, the global economic climate, dilution, share price volatility, competition, loss of key employees, additional funding requirements and defective title to mineral claims or property. Although Goldcorp
    believes its expectations are based upon reasonable assumptions and has attempted to identify important factors that could cause actual actions, events or results to differ materially from those described in forward-looking statements,
    there may be other factors that cause actions, events or results not to be as anticipated, estimated or intended.

    Forward-looking statements are subject to known and unknown risks, uncertainties and other important factors that may cause the actual results, level of activity, performance or achievements of Goldcorp to be materially different from
    those expressed or implied by such forward-looking statements, including but not limited to: future prices of gold, silver, zinc, copper and lead; mine development and operating risks; possible variations in ore reserves, grade or recovery
    rates; risks related to international operations, including economic and political instability in foreign jurisdictions in which Goldcorp operates; risks related to current global financial conditions; risks related to joint venture operations;
    actual results of current exploration activities; actual results of current reclamation activities; environmental risks; conclusions of economic evaluations; changes in project parameters as plans continue to be refined; failure of plant,
    equipment or processes to operate as anticipated; accidents, labour disputes and other risks of the mining industry; risks associated with restructuring and cost-efficiency initiatives; delays in obtaining governmental approvals or
    financing or in the completion of development or construction activities; risks related to the integration of acquisitions; risks related to indebtedness and the service of such indebtedness, as well as those factors discussed in the section
    entitled "Description of the Business – Risk Factors” in Goldcorp’s most recent annual information form available on SEDAR at www.sedar.com and on EDGAR at www.sec.gov. Although Goldcorp has attempted to identify important
    factors that could cause actual results to differ materially from those contained in forward-looking statements, there may be other factors that cause results not to be as anticipated, estimated or intended. There can be no assurance that
    such statements will prove to be accurate, as actual results and future events could differ materially from those anticipated in such statements. Accordingly, readers should not place undue reliance on forward-looking statements.
    Forward-looking statements are made as of the date hereof and, accordingly, are subject to change after such date. Except as otherwise indicated by Goldcorp, these statements do not reflect the potential impact of any non-recurring or
    other special items or of any disposition, monetization, merger, acquisition, other business combination or other transaction that may be announced or that may occur after the date hereof. Forward-looking statements are provided for
    the purpose of providing information about management’s current expectations and plans and allowing investors and others to get a better understanding of Goldcorp's operating environment. Goldcorp does not intend or undertake to
    publicly update any forward-looking statements that are included in this document, whether as a result of new information, future events or otherwise, except in accordance with applicable securities laws.

2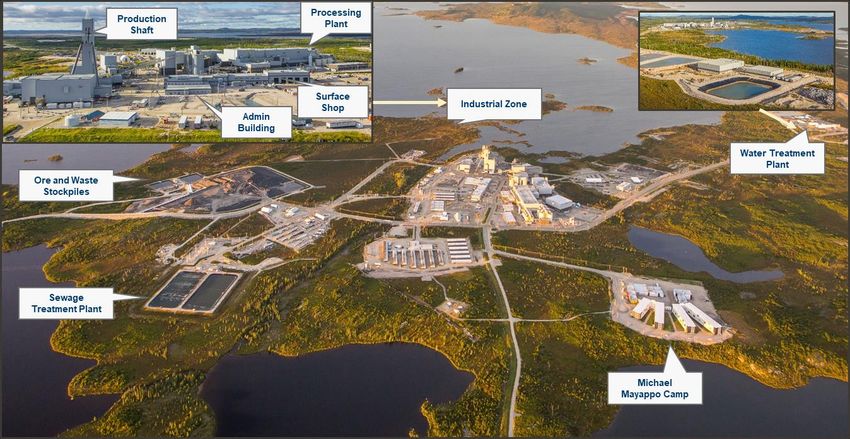
Safety Share

    Emergency Information
    • Emergency exits and evacuation
      procedures

    Safety Share
    • Winter Clothing Policy begins October
      15th

    Golden Guide
    • Part of mandatory PP&E at all
      Goldcorp sites

                                              Winter clothing policy states that all individuals have in their possession: winter boots and
                                              coat for a temperature of -25°C, toque and gloves/mittens. Individuals not adequately
                                              dressed may be refused access.

3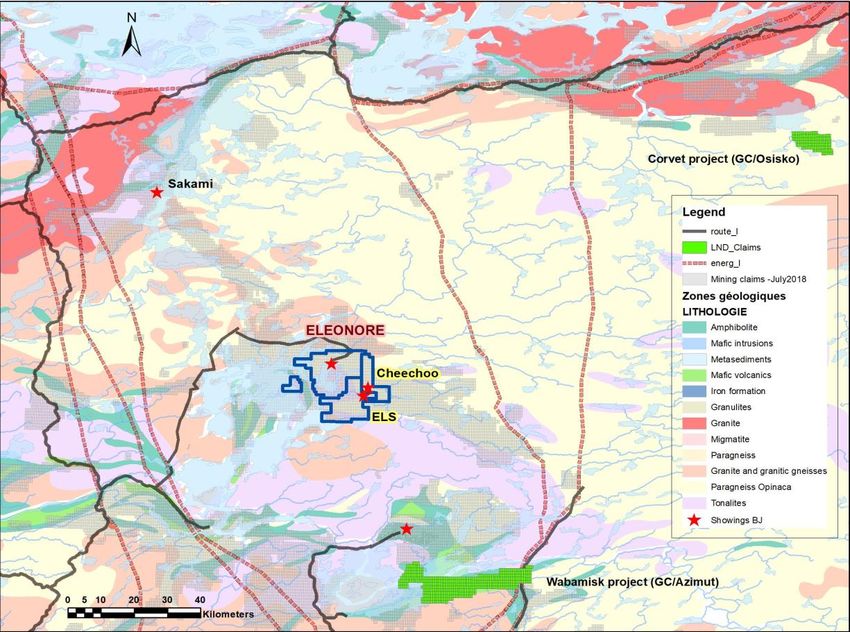
Goldcorp Participants

               Todd White                    Sophie Bergeron                       Paul Harbidge
                 EVP and                       MGM Éléonore                       SVP, Exploration
          Chief Operating Officer

              Patrick Merrin                    Anne Charland                     Shawn Campbell
          SVP Canada Operations     Geology & Exploration Manager, Éléonore   Director, Investor Relations
4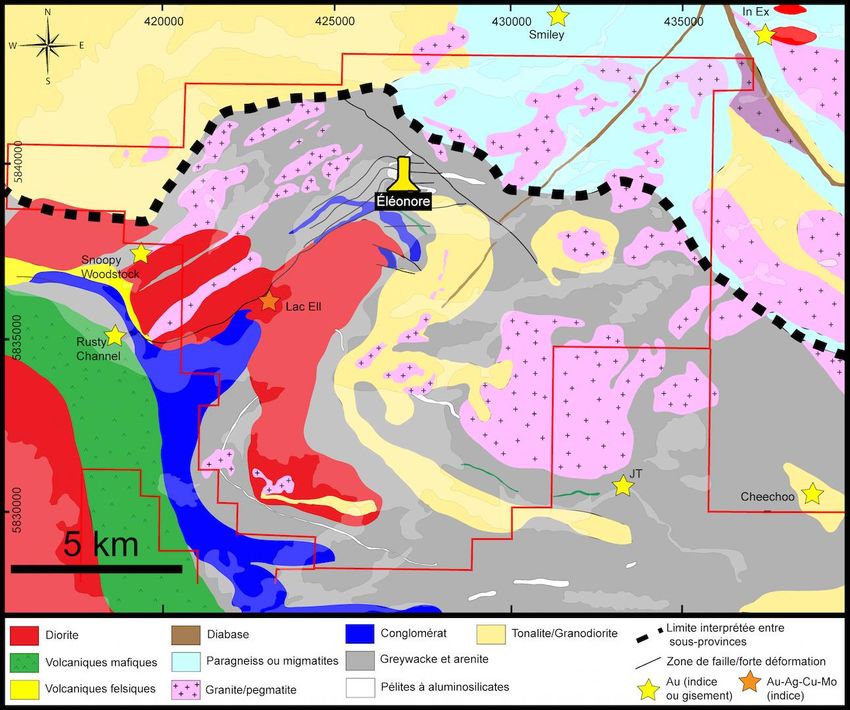
Tomorrow’s Tour Agenda
    5:20 – 5:50am       Shuttles to pick up guests from hotel, 30 minute drive to airport
    6:45am – 9:00am     Flight from Montreal to Éléonore
    9:10am – 9:25am     Transportation from airport to administration building
    9:30am - 10:30am    Welcome remarks, safety induction, PP&E distribution
                        Group 1                                             Group 2
    10:30am – 12:00pm   Underground Tour                                    General Surface Tour
                        • Control Room, Level 1140                          • Mill, Core Shack, Tailings

    12:00pm – 12:45pm   Lunch / Éléonore Management Presentation
                        Group 1                                             Group 2
    1:00pm – 2:30pm     General Surface Tour                                Underground Tour
                        • Mill, Core Shack, Tailings                        • Control Room, Level 1140

    2:45pm – 3:15pm     Closing Remarks / Admin Building
    3:15pm – 3:30pm     Transportation from admin building to airport

                        Flight from:
    3:30pm – 7:30pm
                        Éléonore to Val-d’Or (crew change and fuel) / Val-d’Or to Toronto Island

5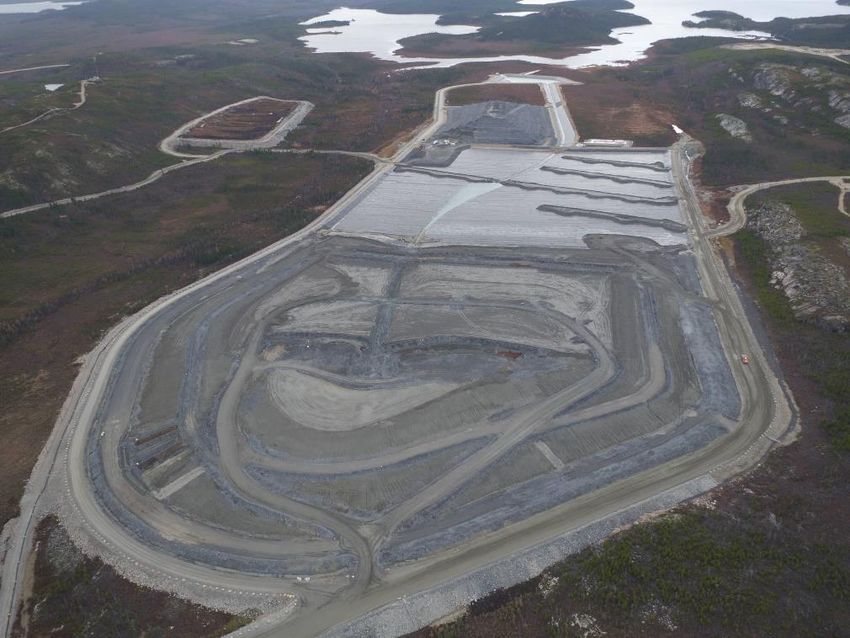
Goldcorp’s Portfolio and Strategy

                                            CANADA
                                            •   Porcupine, ONTARIO        OPTIMUM        3 to 4 Million Ounces
                                            •   Musselwhite, ONTARIO        SIZE         from 6 to 8 Camps
                                            •   Red Lake, ONTARIO
                                            •   Éléonore, QUEBEC
                                            •   Coffee, YUKON
                                            •   Borden, ONTARIO
                                            •   Century, ONTARIO          OPTIMUM
                                                                                         Americas Focused
                                                                         GEOGRAPHY

    LATAM
    •     Peñasquito, MEXICO                                            OPTIMUM COST
    •     Cerro Negro, ARGENTINA                                                         $700/oz All-in Sustaining Cost
    •     Pueblo Viejo, DOM. REPUBLIC 40%                                STRUCTURE
    •     NuevaUnión, CHILE 50%
    •     Norte Abierto, CHILE 50%

                                                                                         Driving Toward Zero Net Debt1
                                                                       OPTIMUM CAPITAL
         Operations / Camps                                              STRUCTURE       Highest Rated Balance Sheet in
                                                                                         Gold Industry
         Projects

    1   See appendix C for footnotes.

6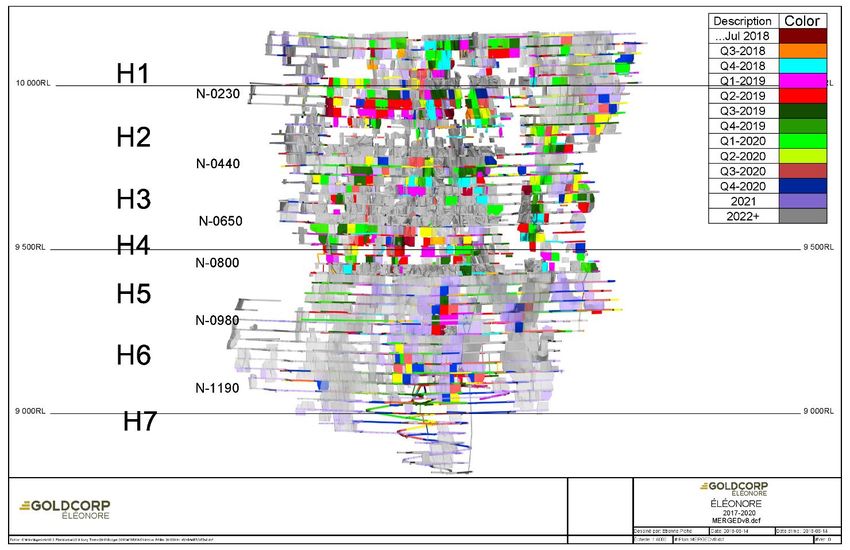
Milestones
    Deliverable                                                  Target Date   Status
    2017 production and 2018 guidance                              Q1 2018

    NuevaUnión pre-feasibility study completion                    Q1 2018

    Coffee updated resources                                       Q2 2018

    Éléonore ramp-up: Horizon 5                                   Mid-2018

    Completion of $250M sustainable efficiency program             Q2 2018

    Cerro Negro ramp-up: Mariana Norte first production mining     Q3 2018

    Mineral reserves and resources annual update                   Q4 2018

    Century completion of optimized pre-feasibility study          Q4 2018

    Peñasquito PLP completion                                      Q4 2018

    Cerro Negro expansion studies                                  Q4 2018

    $100M extension to sustainable efficiency program              Q4 2019

7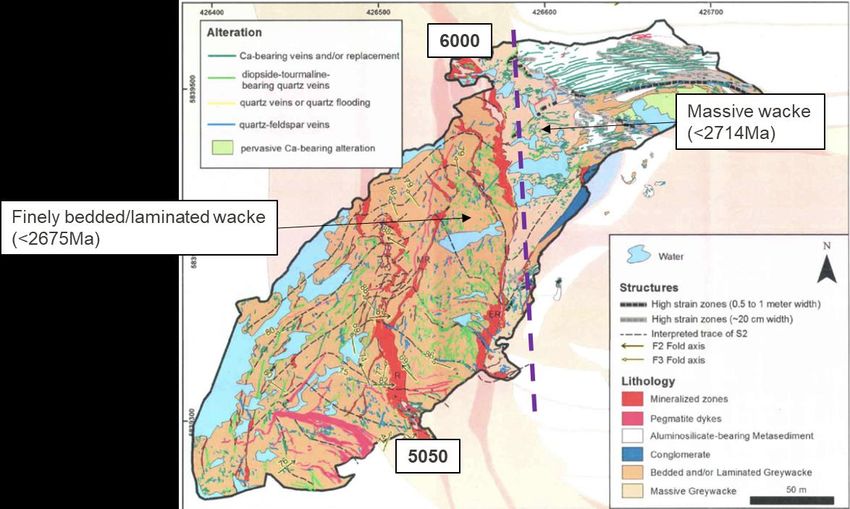
Goldcorp’s 20/20/20 Plan Unchanged

                   Production     AISC      Reserves

                     20%          20%        20%
           2017     Growth      Reduction              2021
                                            Growth

8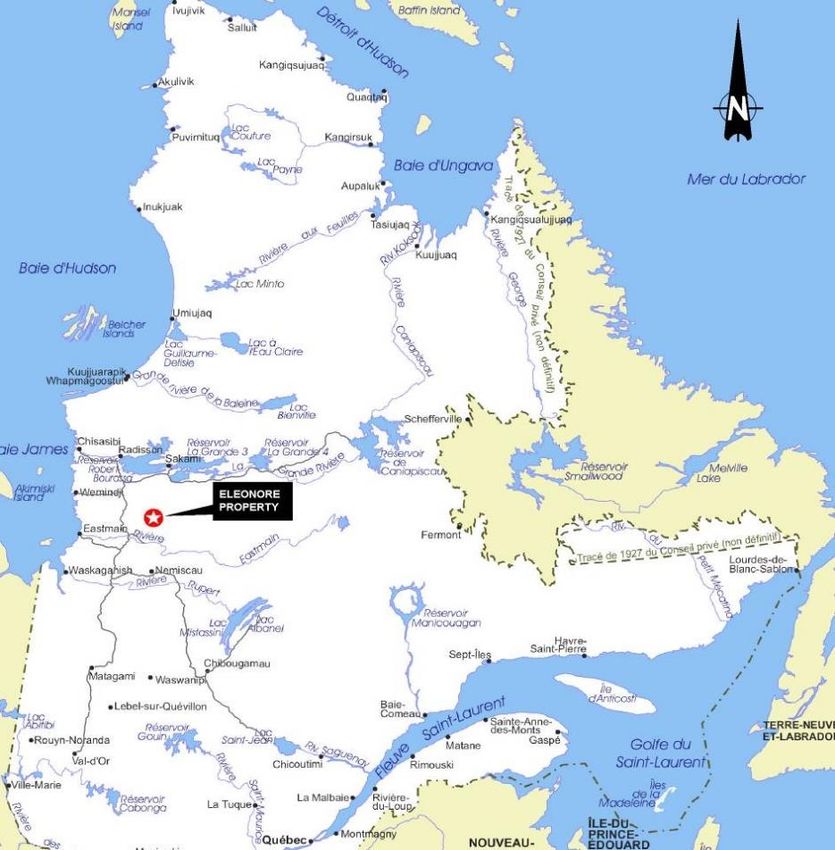
20% Growth in Production1

                                                                                               20% Growth

                                                                                                               3.0          3.0
                                                                                                               Moz          Moz
                                                                                                 2.7
                                                                                                 Moz
               2.5                                           2.5
                                                            2.5
                                                            2.7
               2017
               Moz                                            Moz
                                                             Moz                                               2020        2021
                                                                                                2019                     Additional
                                                                                                                         Optionality
              2017                                            2018
                                                       •   Complete ramp-up at Éléonore and Cerro Negro                   HG Young
                                                       •   Increased grade at Peñasquito following stripping               Century
                                                       •   Pyrite Leach Project at Peñasquito                            Chilean JV’s
                                                       •   Materials Handling Project at Musselwhite                  Brownfield Growth
                                                       •   Coffee and Borden projects

    1 Production   guidance are +/- 5%. See appendix C for pricing assumptions and footnotes

9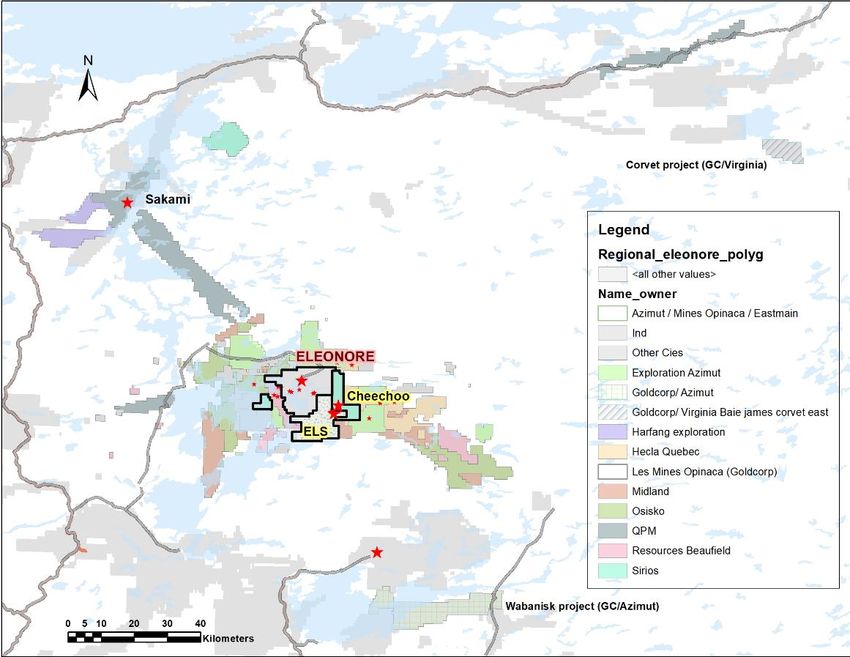
20% Reduction in All-In Sustaining Costs1

                                                                                             20% Reduction

             $824
             2017
               /oz
                                                              $800
                                                                 /oz

              2017                                                                               $750
                                                                                                   /oz
                                                              2018                                              $700         $700
                                                                                                                  /oz         /oz
              $850/OZ(1)                                                                         2019

                                                                                                               2020          $700
                                                                                                                             2021
                                                      • $250M in annual sustainable efficiencies achieved; target extended
                                                        additional $100M by end of 2019
                                                      • Increased metals production
                                                      • Lower sustaining capital expenditures

     1 Guidance   figures are +/- 5%. See appendix C for pricing assumptions and footnotes

10
20% Reserve Growth Target1
20% Growth
2016 2017 2021
Coffee
Pueblo Viejo
50.0 53.5 Cerro Negro 60.0
Moz Moz Norte Abierto Moz
Other Targets
1 Refer to the reserves and resources statement on Goldcorp’s website at www.goldcorp.com for more details on June 30, 2016 and June 30, 2017 mineral reserve and mineral resource estimates
11Table of Contents
Health, Safety & Environment
Location & Overview
Geology
Mining
Exploration
Processing
12Health, Safety & Environment 13
Health & Safety Metrics

                             All-Injury Frequency Rate
                                  2014 to 2018 YTD
          1.2

                      0.89
                                      0.77
                                                         0.65     0.68

         2014         2015            2016               2017   2018 YTD

                               2018 Objective: 0.62

14
Health & Safety Performance Highlights
2016
• F.J O’Connell Trophy
• John T. Ryan (National)
• Qualified for the Provincial Mine Rescue Competition
• Recognition in Health and Safety from the CNESST for the
improvement of the underground survival tent
F.J. O’Connell Trophy John T. Ryan Trophy
2017
• John T. Ryan Trophy (Regional Quebec-Atlantique)
• Qualified for the Provincial Mine Rescue Competition
(first position)
• Recognition in Health and Safety from the CNESST for
the safety latch for the Maryann cage
First place in Provincial Mine Rescue Competition Qualifiers
15Environmental Performance
2016
• Construction of ponds for the collection of runoff water from the
industrial zone
• Start of construction of the new biological industrial water treatment
system (MBBR)
2017
• Commissioning of the biological industrial water treatment (MBBR)
• Construction of Phase 2 of the tailings facility and Phase 5 of the
waste rock disposal facility
• Start of test cells for the final covering concept of the tailings facility
2018
• Goldcorp-Éléonore becomes a partner of IRME (Mining and
Environment Research Institute) Partnership of 5 industrial
partners and 2 institutions
ÉléonoreTailings Facility
• First full year of effluent compliance. Compliant since mid-October
2017.
16Partnerships with Cree Nation
Cultural Activities at Site:
• Eeyou Meechum with Employees
• Cultural Day
• Catch and Release
Total Cree Business Volume:
• 23% on total business volume
• Over $885M since 2007
17Location & Overview 18
Éléonore Location
190 km East of Wemindji
350 km North of Matagami
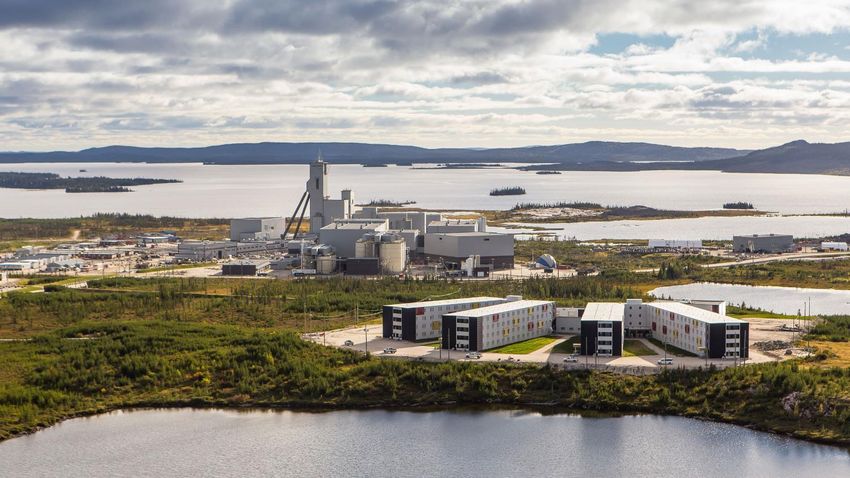
19Éléonore Site Layout 20
Éléonore - Strategic Plan Supports Ramp-Up

     Q2 Performance:
     • Achieved ramp breakthrough and first production from
       Horizon 5
     • Performed 10 days planned shutdown in April for major
                                                                                                           360koz                                   $900/oz
                                                                                                           Production2                              AISC2
       repair on one of the filter presses                                                                 2018                                     2018
     • Performed first major electrical shutdown successfully
     • Mined two sill pillar stopes in high-stress environment
       allowing to adjust technical aspects for future sill pillar
       stopes
                                                                                                                         Ownership                    100%
     • Achieved 92% recovery at the plant for first time
                                                                                                                         Location                     Quebec, Canada
     2018 Outlook:
                                                                                                                         P&P gold   reserves1         3.8 moz
     • Continue ramp-up of gold production to 360koz,                                                                    M&I gold resources1          1.3 moz
       representing an increase of 25% in tonnage for H2 versus
                                                                                                                         Inferred gold resources1     2.0 moz
       H1.
                                                                                                                         2018 exploration   budget2   $10 M
     • Optimization of mine plan/sequence based on the latest
       version of the geomechanical model complete, updated                                                              2018 capital   budget2       $70 M

       technical report expected in early 2019
     1 As   of June 30, 2017. Refer to the reserve and resource statement on Goldcorp’s website for more details
     2 Guidance    figures are +/- 5%. See appendix C for pricing assumptions and footnotes

21
Éléonore Strategic Path Forward
• Expanding Éléonore automation capabilities through redesign
• Completed evaluation of economics of stopes that are near cut-off grade
and lower dilution, implementation of COG policy
• Increasing stope inventory by opening new levels and creating more
diamond drilling platforms
• Optimization of overall workforce utilization through gained process
efficiencies and automation
• Moved work off-site; reduced transport and lodging G&A cost
• Reducing operations consumables and maintenance contractors spend
• Execution of Regional exploration strategy to move targets up resource
triangle
• Exploration at depth to build resource base at Roberto deposit
• Completed enhancement of block model; integration of geological and
structural data
22Geology 23
Regional Map

24
Geological Map

     • Deposit hosted in Timiskaming
       (
Roberto Island Outcrop Mapping 26
Robust Geological Model Provides Predictability
     Éléonore Plan View – Level 200
                                       Geological Model Predictable / Reliable and
                                       • Network of Over 117 Parallel Lenses
                                       • Connecting Ramps
                                       • Mineralization both structural & stratigraphic control
                                       • 5050 and 6000 have textural differences
                                       • 6000 lens: Highly strained
                                       • 5050 Main: Quartz veins in finely laminated wacke

                                      2.0                     Mill Feed / Long Term (RF3)
                                      1.5

                                      1.0

                                      0.5

                                      0.0
                                            Jan-17   Apr-17    Jul-17   Oct-17   Jan-18   Apr-18   Jul-18

27
2018 Minex Program
Principle Target Areas:
Looking West
• 494
• South
• Deep South
• Deep Main (H7)
H7
H8
Economic (>3g/t Au + >2.5m) Drill locations Grey scale – Dark: Reserve (M&I),
Sub Economic Results Pending Medium: Resource
28Deep Drilling and Continuation of Deposit at Depth
Economic (>3g/t Au + >2.5m) Results Pending
Grey scale – Dark: Reserve (M&I),
Sub Economic
Medium: Resource
29Mining 30
Visual Review of 2019 Mine Plan

                                                       Production from 5 to 6
                                                       mining horizons over
                                         2nd mining      the 3 year period
                                       fronts due to
                                       flexible mine
                                         sequence

31
2019 Budget Mine Plan Animation 32
Materials Handling Overview – US$34 Million Investment

                                            Ore passes in
                                               H5-H6

                                                    Main silos with
                                                      screens and
                                                     rockbreakers

33
Éléonore – Increasing Production and Declining Costs
400 $1,200
$1,095
Sustainable
Production & $1,100
350 Cost Level
$981
$1,000
Gold Production (kozs)
300 $900
$900
AISC ($/oz)
$800
250 $800
Optimal
$700
200 Throughput:
6,000 to 7,000
tpd @ $600
5.5 to 6.5g/t
150
$500
274 koz 305 koz 360 koz 400 koz
100 $400
2016 2017 2018E 2019E
2019 Onwards
Gold Production AISC
Guidance figures are +/- 5%. See appendix C for pricing assumptions and footnotes
342018 Ore Tonnes Mined by Horizon
8,000
7,251
6,918 7,063
7,000 6,541
Optimal
H5 Throughput
6,000
Ramp up
5,000
Mined Ore (tpd)
4,000
3,000
2,000
1,000
-
2018-Q1 2018-Q2 2018-Q3 F 2018-Q4 F
H1 H2 H3 H4 H5 Peak Mill Throughput
Note: YTD actuals: January to August, 2018 Forecasted Mine Plan: September to December
35Processing 36
Processing Flow Sheet Highlights

                                     Conventional processing (CIP)
                                     •   7,000 tpd @ 95% availability, 93.5% recovery @ 8g/t
                      Overall gold
                                     •   March to July 2018 running average is 92.5% @ 6g/t
                      recovery of
                         92.5%
                                     We are expecting current optimization initiatives to
                                     deliver a recovery increase of approx. 0.85% @ 6g/t
                                     • Isamill cooling (+ 0.5%)
                                     • Gravity circuit optimization (+0.2%)
                                     • NS bleed optimization (+0.1%)
                                     • Carbon fines losses reduction (+0.05%)

                                     This will achieve feasibility study target recoveries
                                     despite lower feed grades.

37
Exploration 38
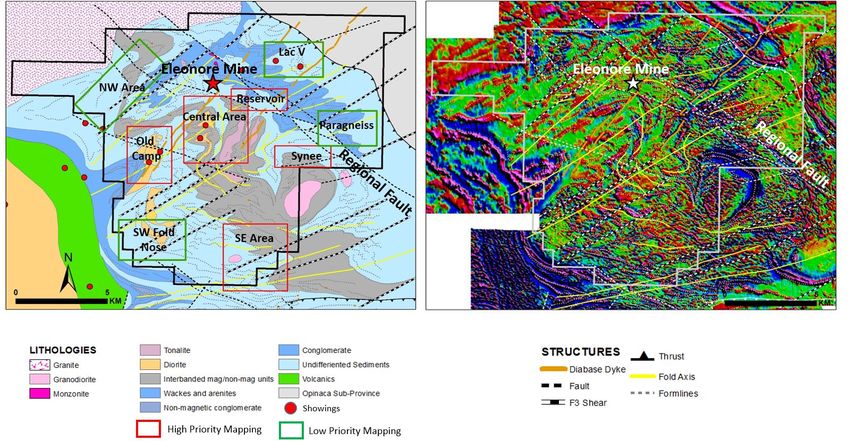
Éléonore - Building the Foundations ‘Beyond 20/20’
        Éléonore geological interpretation and exploration target areas   Éléonore airborne magnetic data and structural interpretation

39
Éléonore District geochemistry
Gridded Au till geochemistry Gridded As till geochemistry
Roberto deposit Roberto deposit
N
Éléonore South Éléonore South
JV JV
5km
40Regional Joint Ventures and Toehold Investments
Éléonore South (Eastmain, Azimut) - 36.7%
• Eastmain fall program
Wabamisk (Azimut) - (51%)
Corvet (Osisko) - 50%
Sakami (QPM) - 19.7%
• First technical meeting held August 10th
• First field visit week of Sept 10th
Cheechoo (Sirios) - 12%
41APPENDIX A: 2018 SENSITIVITIES
Base Change Operating Cash All-In Sustaining
Price Increments Flow per Share(1) EBITDA(1) ($M) Costs ($/oz)(1)
Gold price ($/oz) $1,300 $100 $0.26 $240 $1
Silver price ($/oz) $19.00 $3.00 $0.08 $74 $30
Zinc price ($/lb) $1.30 $0.10 $0.04 $32 $12
Lead price ($/lb) $1.10 $0.10 $0.02 $17 $6
Canadian dollar $1.25 10% $0.10 $84 $43
Mexican peso $19.00 10% $0.04 $33 $13
(1) Refer to Appendix C for footnotes
42APPENDIX B: 2018E PRODUCTION COSTS
Consolidated Canada Latin Associates and
America Joint Ventures
6%
5%
3% 27% 4% 5% 7% 7%
3% 5% 19% 6% 18%
2% 1% 4% 2%
42% 2% 1%
14%
15% 17%
13%
22% 16%
7%
5% 15% 8%
3% 9% 9%
9% 17% 6% 13%
19%
7%
7%
Labour Contractors
Fuel Costs Power
Maintenance Parts Consumables
Tires Explosives
Site Costs Others
43APPENDIX C: FOOTNOTES
Note 1: Guidance projections used in this document (“Guidance”) are considered “forward-looking statements” and represent management’s good faith estimates or expectations of future production results as of the
date hereof. Guidance is based upon certain assumptions, including, but not limited to, metal prices, oil prices, certain exchange rates and other assumptions. 2018-2019 guidance assumes Au=$1,300/oz,
Ag=$19.00/oz, Cu=$2.75/lb, Zn=$1.30/lb, Pb=$1.10/lb, $1.25 CAD/USD, 19.00 MXN/USD. 2020-2021 guidance assumes Au=$1,300/oz, Ag=$18.00/oz, Cu=$3.00/lb, Zn=$1.15/lb, Pb=$1.00/lb, $1.25 CAD/USD, 19.00
MXN/USD. Such assumptions may prove to be incorrect and actual results may differ materially from those anticipated. Consequently, Guidance cannot be guaranteed. As such, investors are cautioned not to place
undue reliance upon Guidance and forward-looking statements as there can be no assurance that the plans, assumptions or expectations upon which they are placed will occur.
Note 2: Non-GAAP performance measures including adjusted operating cash flow, adjusted EBITDA, by-product cash costs and AISC are calculated on an attributable (or Goldcorp’s share) basis. Attributable
performance measures include the Company’s mining operations and projects, and the Company’s share of Pueblo Viejo, Alumbrera, Leagold and NuevaUnión. The Company believes that disclosing certain
performance measures on an attributable basis is a more relevant measurement of the Company’s operating and economic performance, and reflects the Company’s view of its core mining operations. The Company
believes that, in addition to conventional measures prepared in accordance with GAAP, the Company and certain investors use this information to evaluate the Company’s performance and ability to generate cash flow;
however, these performance measures do not have any standardized meaning. Accordingly, it is intended to provide additional information and should not be considered in isolation or as a substitute for measures of
performance prepared in accordance with GAAP.
Note 3: The Company’s projected AISC are not based on GAAP total production cash costs, which forms the basis of the Company’s cash costs: by-product. The projected range of AISC is anticipated to be adjusted to
include sustaining capital expenditures, corporate administrative expense, mine-site exploration and evaluation costs and reclamation cost accretion and amortization, and exclude the effects of expansionary capital and
non-sustaining expenditures. Projected GAAP total production cash costs for the full year would require inclusion of the projected impact of future included and excluded items, including items that are not currently
determinable, but may be significant, such as sustaining capital expenditures, reclamation cost accretion and amortization and tax payments. Due to the uncertainty of the likelihood, amount and timing of any such
items, we do not have information available to provide a quantitative reconciliation of projected all-in sustaining costs to a total production cash costs projection.
Note 4: Sustaining capital expenditures are defined as those expenditures which do not increase annual gold ounce production at a mine site and excludes all expenditures at the Company’s projects and certain
expenditures at the Company’s operating sites which are deemed expansionary in nature.
44APPENDIX C: FOOTNOTES
Note 5: AISC include total production cash costs incurred at the Company’s mining operations, which forms the basis of the Company’s by-product cash costs. Additionally, the Company includes sustaining capital
expenditures, corporate administrative expense, mine-site exploration and evaluation costs, and reclamation cost accretion and amortization. The measure seeks to reflect the full cost of gold production from current
operations, therefore growth capital and non-sustaining expenditures are excluded. Certain other cash expenditures, including tax payments, dividends and financing costs are also excluded.
AISC is a non-GAAP performance measure that the Company believes more fully defines the total costs associated with producing gold; however, this performance measure has no standardized meaning. Accordingly,
it is intended to provide additional information and should not be considered in isolation or as a substitute for measures of performance prepared in accordance with GAAP. The Company reports this measure on a gold
ounces sold basis. The Company’s all-in sustaining cost definition conforms to the guidance note released by the World Gold Council, which became effective January 1, 2014. The World Gold Council is a non-
regulatory market development organization for the gold industry whose members comprise global senior gold mining companies.
AISC includes total production costs incurred at the Company’s mine operations, which forms the basis of the Company’s by-product cash costs. The following tables provide a reconciliation of AISC per ounce to the
consolidated financial statements:
45APPENDIX C: FOOTNOTES Note 6: Adjusted operating cash flows comprises Goldcorp’s share of operating cash flows before working capital changes, calculated on an attributable basis to include the Company's share of Pueblo Viejo, Alumbrera, NuevaUnión and Leagold’s operating cash flows before working capital changes. The Company believes that, in addition to conventional measures prepared in accordance with GAAP, the Company and certain investors use this information to evaluate the Company’s performance and ability to operate without reliance on additional external funding or use of available cash. The following table provides a reconciliation of net cash provided by operating activities in the consolidated financial statements to Goldcorp’s share of adjusted operating cash flows: 46
APPENDIX C: FOOTNOTES
Note 7:.Earnings before interest, taxes and depreciation and amortization (“EBITDA”) and Adjusted EBITDA are non-GAAP performance measures. Accordingly, they are intended to provide additional information and should
not be considered in isolation or as a substitute for measures of performance prepared in accordance with GAAP and they have no standardized meaning. EBITDA is calculated, on an attributable basis, to include the
Company’s share of Pueblo Viejo, Alumbrera, NuevaUnión and Leagold as net earnings (loss) before taxes, depreciation and depletion, finance income and finance costs. Adjusted EBITDA also removes the impact of
impairments or reversals of impairment and other non-cash expenses or recoveries as the Company does not believe they are reflective of the Company’s ability to generate liquidity and its core operating results.

The Company believes that, in addition to conventional measures prepared in accordance with GAAP, the Company and certain investors use EBITDA and Adjusted EBITDA as an indicator of the Company's ability to
generate liquidity by producing operating cash flow to fund working capital needs, service debt obligations and fund capital expenditures. EBITDA is also frequently used by investors and analysts for valuation purposes
whereby EBITDA is multiplied by a factor or "EBITDA multiple" that is based on an observed or inferred relationship between EBITDA and market values to determine the approximate total enterprise value of a company.

EBITDA and Adjusted EBITDA are intended to provide additional information to investors and analysts and do not have any standardized definition under IFRS, and should not be considered in isolation or as a substitute for
measures of performance prepared in accordance with IFRS. EBITDA and Adjusted EBITDA exclude the impact of cash costs of financing activities and taxes, and the effects of changes in operating working capital
balances, and therefore are not necessarily indicative of operating profit or cash flow from operations as determined under IFRS. Other companies may calculate EBITDA and Adjusted EBITDA differently.

  The following table provides a reconciliation of net earnings in the consolidated financial statements            The following table provides a reconciliation of net cash provided by operating activities in
  to EBITDA and Adjusted EBITDA:                                                                                    the consolidated financial statements to EBITDA and Adjusted EBITDA:

47
APPENDIX D: RESERVE & RESOURCE REPORTING NOTES
 Cautionary Note Regarding Reserves and Resources:

 Scientific and technical information contained in this presentation was reviewed and approved by Ivan Mullany, FAusIMM, Senior Vice President, Technical Services for Goldcorp, and a “qualified person” as defined
 by National Instrument 43-101 – Standards of Disclosure for Mineral Projects (“NI 43-101”). Scientific and technical information in this press release relating to Canadian exploration results was reviewed and
 approved by Tim Smith, MSc, P.Geo., Director Exploration Canada for Goldcorp, and a "qualified person" as defined by National Instrument 43-101. Scientific and technical information in this press release relating
 to Latin American exploration results was reviewed and approved by Iain Kelso, P.Geo., Director Exploration Latam for Goldcorp, and a "qualified person" as defined by NI 43-101. All Mineral Reserves and Mineral
 Resources have been estimated in accordance with the standards of the Canadian Institute of Mining, Metallurgy and Petroleum ("CIM") and NI 43-101, or the Australasian Code for Reporting of Exploration
 Results, Mineral Resources and Ore Reserves equivalent (“JORC”). All Mineral Resources are reported exclusive of Mineral Reserves. Mineral Resources that are not Mineral Reserves do not have demonstrated
 economic viability. Information on data verification performed on the mineral properties mentioned in this table that are considered to be material mineral properties to the Company are contained in Goldcorp’s
 annual information form for the year ended December 31, 2017 and the current technical report for each of those properties, all available at www.sedar.com.

 The Mineral Resource and Mineral Reserve estimates contained in this presentation have been prepared in accordance with the requirements of Canadian securities laws, which differ from the requirements of
 United States securities laws and uses terms that are not recognized by the SEC. Canadian reporting requirements for disclosure of mineral properties are governed by the Canadian Securities Administrators’ NI
 43-101. The definitions used in NI 43-101 are incorporated by reference from the Canadian Institute of Mining, Metallurgy and Petroleum (“CIM”) — Definition Standards adopted by CIM Council on May 10, 2014
 (the “CIM Definition Standards”). U.S. reporting requirements are governed by the SEC Industry Guide 7 (“Industry Guide 7”) under the United States Securities Act of 1933, as amended. These reporting
 standards have similar goals in terms of conveying an appropriate level of confidence in the disclosures being reported, but embody different approaches and definitions. For example, the terms “Mineral Reserve”,
 “Proven Mineral Reserve” and “Probable Mineral Reserve” are Canadian mining terms as defined in NI 43-101, and these definitions differ from the definitions in Industry Guide 7. Under Industry Guide 7 standards,
 a “final” or “bankable” feasibility study is required to report reserves and the primary environmental analysis or report must be filed with the appropriate governmental authority. Further, under Industry Guide 7,
 mineralization may not be classified as a “reserve” unless the determination has been made that the mineralization could be economically and legally produced or extracted at the time the reserve determination is
 made.

 While the terms “Mineral Resource”, “Measured Mineral Resource”, “Indicated Mineral Resource” and “Inferred Mineral Resource” are defined in and required to be disclosed by NI 43-101, these terms are not
 defined terms under Industry Guide 7 and are normally not permitted to be used in reports and registration statements filed with the SEC. United States readers are cautioned not to assume that any part or all of
 mineral deposits in these categories will ever be converted into reserves. In addition, “Inferred Mineral Resources” have a great amount of uncertainty as to their existence and their economic and legal feasibility. A
 significant amount of exploration must be completed in order to determine whether an Inferred Mineral Resource may be upgraded to a higher category. Under Canadian regulations, estimates of Inferred Mineral
 Resources may not form the basis of feasibility or pre-feasibility studies, except in rare cases. United States readers are cautioned not to assume that all or any part of an Inferred Mineral Resource exists or is
 economically or legally mineable. Disclosure of “contained ounces” in a resource is permitted disclosure under Canadian regulations if such disclosure includes the grade or quality and the quantity for each category
 of Mineral Resource and Mineral Reserve; however, the SEC normally only permits issuers to report mineralization that does not constitute “reserves” by SEC standards as in place tonnage and grade without
 reference to unit measures.

 Accordingly, information contained in this presentation containing descriptions of the Company’s mineral deposits may not be comparable to similar information made public by United States companies subject to
 the reporting and disclosure requirements under the United States federal securities laws and the rules and regulations thereunder.

48
APPENDIX E: 2017 PRODUCTION, 2018 GUIDANCE
2017 2018 Guidance
Gold Gold Capital Expenditure
Mine Production(1) (oz) Production(1) (oz) AISC(1) ($/oz) Sustaining(1) Growth(1) Exploration(1)
Peñasquito 476,000 310,000 $250 $220M $335M $5M
Cerro Negro 452,000 490,000 $600 $55M $75M $20M
Pueblo Viejo 433,000 415,000 $600 $70M $0 $0
Éléonore 305,000 360,000 $900 $40M $30M $10M
Red Lake 209,000 235,000 $1,000 $50M $50M $30M
Porcupine 272,000 275,000 $925 $55M $120M $15M
Musselwhite 236,000 265,000 $775 $40M $35M $10M
Other 186,000 100,000 $1,000 $20M $105M $35M
Consolidated 2,569,000 2,500,000 (+/- 5%) $800 (+/- 5%) $550M $750M $125M
Consolidated by-product costs(1) $450 (+/- 5%)
(1) Refer to Appendix C for footnotes
49APPENDIX E: 2018 GUIDANCE (cont’d)
20/20/20 Plan
Gold Production(1) (oz) AISC(1) ($/oz) By-product(1) ($/oz) Capital Expenditure(1) (+/- 5%)
Year
(+/- 5%) (+/- 5%) (+/- 5%) Sustaining Growth(2)
2018E 2,500,000 $800 $450 $550M $750M
2019E 2,700,000 $750 $400 $575M $250M
2020E 3,000,000 $700 $400 $575M $300M
2021E 3,000,000 $700 $400 $575M $300M
(1) Refer to Appendix C for footnotes
(2) Growth capital includes capital for those projects which are in execution and/or have an approved Feasibility Study. Other projects only include capital to progress to the next Stage Gate.
50www.goldcorp.com
facebook.com/Goldcorp
@Goldcorp_Inc
linkedin.com/company/goldcorp-inc
youtube.com/user/GoldcorpInc
Trading Symbols | NYSE: GG; TSE: G
Investor Relations | 1-800-567-6223 | info@goldcorp.comYou can also read