Enhancing the Portfolio - August 2019 - Frontera Energy
←
→
Page content transcription
If your browser does not render page correctly, please read the page content below
Enhancing the Portfolio
August 2019
Advisories
This presentation contains forward-looking statements. All statements, other than statements of historical fact that address activities, events or developments that Frontera Energy Corporation (the
“Company” or “Frontera”) believes, expects or anticipates will or may occur in the future (including, without limitation, statements regarding corporate strategy, dividend payments, estimates or
assumptions in respect of production levels, operating EBITDA, capital expenditures, timing and potential impact of cost savings initiatives, drilling plans involving completion and testing and the
anticipated timing thereof, revenue, costs, production costs, transportation costs, reserve and resource estimates, potential resources and reserves, and the Company's exploration and development
plans and objectives) are forward-looking statements. These forward-looking statements reflect the current expectations or beliefs of the Company based on information currently available to the
Company. Forward-looking statements are subject to a number of risks and uncertainties that may cause the actual results of the Company to differ materially from those discussed in the forward-looking
statements, and even if such actual results are realized or substantially realized, there can be no assurance that they will have the expected consequences to, or effects on, the Company. Factors that
could cause actual results or events to differ materially from current expectations include, among other things: uncertainty of estimates of capital and operating costs; production estimates and
estimated economic return; failure to meet project timelines; uncertainties associated with estimating oil and natural gas reserves; failure to establish estimated resources or reserves; volatility in market
prices for oil and natural gas; fluctuation in currency exchange rates; inflation; changes in equity markets; perceptions of the Company's prospects and the prospects of the oil and gas industry in
Colombia and the other countries where the Company operates or has investments; the uncertainties involved in interpreting drilling results and other geological data; and the other risks disclosed under
the heading "Risk Factors" in the Company's annual information form dated March 13, 2019 filed on SEDAR at www.sedar.com. Any forward-looking statement speaks only as of the date on which it is
made and, except as may be required by applicable securities laws, the Company disclaims any intent or obligation to update any forward-looking statement, whether as a result of new information,
future events or results or otherwise. Although the Company believes that the assumptions inherent in the forward-looking statements are reasonable, forward-looking statements are not guarantees of
future performance and accordingly undue reliance should not be put on such statements due to the inherent uncertainty therein.

This presentation contains future oriented financial information and financial outlook information (collectively, “FOFI”) (including, without limitation, statements regarding operating EBITDA, capital
expenditures (including maintenance & development drillings, exploration activities, facilities & infrastructure and administrative and others, production costs, and transportation costs for the Company
in 2019), and are subject to the same assumptions, risk factors, limitations and qualifications as set forth in the above paragraph. The FOFI has been prepared by management to provide an outlook of
the Company's activities and results, and such information may not be appropriate for other purposes. The Company and management believe that the FOFI has been prepared on a reasonable basis,
reflecting management’s best estimates and judgments, however, actual results of operations of the Company and the resulting financial results may vary from the amounts set forth herein. Any FOFI
speaks only as of the date on which it is made and, except as may be required by applicable securities laws, the Company disclaims any intent or obligation to update any FOFI, whether as a result of new
information, future events or results or otherwise. The Company discloses several financial measures in this presentation that do not have any standardized meaning prescribed under International
Financial Reporting Standards ("IFRS") (including Operating EBITDA). These measures should not be considered in isolation or as a substitute for measures of performance prepared in accordance with
IFRS. For more information, please see the Company’s management’s discussion and analysis dated March 13, 2019 for the year ended December 31, 2018 filed on SEDAR at www.sedar.com.

All reserves estimates contained in this presentation were prepared in accordance with the definitions, standards and procedures contained in the Canadian Oil and Gas Evaluation Handbook and
National Instrument 51-101 – Standards of Disclosure for Oil and Gas Activities (“NI 51-101”) and included in form 51-101F1 – Statement of Reserves Data and Other Oil and Gas Information filed on
SEDAR. Additional reserves information as required under NI 51-101 can also be found on SEDAR, under the: (i) Forms 51-101F2 – Report on Reserves Data by Independent Qualified Reserves Evaluator
completed by each of DeGolyer and MacNaughton on February 26, 2019; and (ii) Form 51-101F3 – Report of Management and Directors on Oil and Gas Disclosure dated March 13, 2019. All reserves
presented are based on forecast pricing and estimated costs effective December 31, 2018 as determined by the Company’s independent reserves evaluators. The Company’s net reserves after royalties
incorporate all applicable royalties under Colombia and Peru fiscal legislation based on forecast pricing and production rates, including any additional participation interest related to the price of oil
applicable to certain Colombian blocks, as at December 31, 2018. Contingent resources are those quantities of petroleum estimated, as of a given date, to be potentially recoverable from known
accumulations using established technology or technology under development, but which are not currently considered to be commercially recoverable due to one or more contingencies. Contingent
Resources have an associated chance of development (economic, regulatory, market and facility, corporate commitment or political risks). The estimates herein have not been risked for the chance of
development. There is no certainty that the contingent resources will be developed and, if they are developed, there is no certainty as to the timing of such development or that it will be commercially
viable to produce any portion of the contingent resources. It is not an estimate of volumes that may be recovered. Actual recovery is likely to be less and may be substantially less or zero.

Resources do not constitute, and should not be confused with, reserves. “Internal estimate” means an estimate that is derived by Frontera’s internal engineers and geologists. Internal estimates should
be considered preliminary until analyzed and certified by third party reserves evaluators. As a result, readers are cautioned not to place undue reliance on such estimates.

The term “boe” is used in this news release. Boe may be misleading, particularly if used in isolation. A boe conversion ratio of cubic feet to barrels is based on an energy equivalency conversion method
primarily applicable at the burner tip and does not represent a value equivalency at the wellhead. In this news release, boe has been expressed using the Colombian conversion standard of 5.7 Mcf: 1 bbl
required by the Colombian Ministry of Mines and Energy.

In addition, reported production levels may not be reflective of sustainable production rates and future production rates may differ materially from the production rates reflected in this presentation due
to, among other factors, difficulties or interruptions encountered during the production of hydrocarbons.

The values in this presentation are expressed in United States dollars and all production volumes are expressed before royalties, unless otherwise stated. Some figures presented are rounded and data in
tables may not add due to rounding.

                                                                                                                                                                   2
Company Overview
Frontera Energy
North Andean Focus

                     GUYANA

                              4
Frontera Energy
      Company Snapshot
      Capital Structure ($U.S.) (1)                                                                                                                             Q2 2019 Production Mix
      Shares Outstanding (TSX: FEC; MM)                                                                                          98                          Natural Gas
      Market Cap ($MM)(2)                                                                                              $1,051                                    3%                           Heavy Oil

      Total Cash(3) /Cash and Cash Equivalents ($MM)                                                       $486 / $354
      Long-Term Debt ($MM Face Value/Markets)(4)                                                            $350 / $374                                                         68      44%
                                                                                                                                                                               Mboe/d
      Enterprise Value                 ($MM)(2)(5)                                                                     $1,138                                            53%
      Reserves (Dec. 31, 2018)(6)
      Proved (1P; MMBoe)                                                                                                      116               Light & Medium Oil
      Probable (MMBoe)                                                                                                           55
      Proved + Probable (2P; MMBoe)                                                                                            171
      PDP NPV10 After Tax                                                                                                  $731                                    2018 Net 2P Reserves(6)
      1P NPV10 After Tax                                                                                               $1,428                                 Natural Gas
                                                                                                                                                                  2%                          Heavy Oil
      2P NPV10 After Tax                                                                                               $2,206

                                                      Targeted quarterly                                                                                                 36%
         Strong balance                                                                             Longer term growth                                                          155
                                                         dividend of                                                                                                           MMBoe
         sheet provides                                                                                 investment
                                                       $15 million with                                                                                                                 62%
        opportunities for                                                                             opportunities in
            enhanced                                  $40 million special                           Colombia, Guyana,
       shareholder returns                              dividend and                                Ecuador, and Peru
                                                          5% NCIB
                                                                                                                                                Light & Medium Oil

(1)   Shares outstanding, cash and cash equivalents, long-term debt and non-controlling interests as at June 30, 2019.
(2)   Assumes Frontera share price of CAD$14.00 and USD/CAD exchange rate of 1.305.
(3)   Total cash balance includes current restricted cash $38 MM and non-current restricted cash $93 MM.
(4)   $350 million senior unsecured notes due 2023 are rate BB- by S&P and BB-/RR4 by Fitch, July 2019 market price $107.0.
(5)   Enterprise value is calculated as the market capitalization plus long-term debt, minority interest ($66 MM), minus total unrestricted cash and cash equivalents.           5
(6)   Reserves report was prepared by DeGolyer and MacNaughton (“D&M”), POP reserves of 39 MMBoe before royalties.
2019 Revised Guidance
Strong EBITDA, Stable Capex, Lower Costs

                                                                                               2019 Guidance        2019 Year To Date        Revised 2019

Operating EBITDA                                         (MM)                                     $400 to $450            $326               $525 to $575

Capital Expenditures                                     (MM)                                     $325 to $375            $143               $325 to $375

Average Daily Production                                 (boe/d)                              65,000 to 70,000           71,197             65,000 to 70,000

Production Costs (1)                                     ($/boe)                              $12.50 to $13.50           $11.28             $12.00 to $12.50

Transportation Costs (2)                                 ($/boe)                              $12.50 to $13.50           $12.59             $12.50 to $13.50

Brent Oil Price
                                                         ($/bbl)                                         $65.00          $66.17                 $65.00
Assumption

Oil Price Differential                                   ($/bbl)                                           $8.40          $2.73                  $3.50

Foreign Exchange Rate                                    (COP:USD)                                       3,000:1         3,187:1                3,100:1

(1)   Calculated using production before royalties as this most accurately reflects per unit production costs.                          6
(2)   Calculated using production after royalties as this most accurately reflects per unit transportation costs.
2019 EBITDA Sensitivities
Using 2019 Revised Guidance Estimates of $65.00/bbl Brent, 3,100:1 USDCOP,
Differential of $3.50/bbl Generates $525 - $575 MM in Annual EBITDA

      Production Cost ($/bbl)                           +$1.0                        (26)           26       ($1.0)

      Transport Cost ($/bbl)                            +1.0                         (23)         23         ($1.0)

      Impact of Differentials
                                                        +1.0                          (21)      21           ($1.0)
      ($/bbl)

      Brent Oil ($/bbl)                                 ($1)                           (17)    17            +$1

      FX Rate                                                                           (13)   13
                                                        (100)                                                +100
      USD/COP(1)

      General & Administrative                                                          (13)   13
                               +0.5                                                                          ($0.5)
      Costs ($/bbl)

      Production                                                                        (11) 11
                                                        (1,000)                                              +1,000
      (Boe/d before royalties)

(1) FX rate sensitivity also impacts capex by $6 million for each 100 COP/USD move
                                                                                                         7
2019 Guidance
Strong EBITDA, Lower Capex, Lower Costs
Daily Production, before royalties (Boe/d)                                         Operating EBITDA and Capex ($MM)
80,000                                                                      $600
70,000
                                                                            $500
60,000
                                                                            $400
50,000
40,000                                                                      $300
30,000
                                                                            $200
20,000
                                                                            $100
10,000
      -                                                                       $0
                                                                                          2017                 2018                 2019E           1H 2019
                                                                                                             Operating EBITDA   Capex

Production Cost ($/Boe)                                                           Transportation Cost ($/Boe)
$14                                                                 20%     $20
                                                                    18%     $18
$12
                                                                    16%     $16
$10                                                                 14%     $14
 $8                                                                 12%     $12
                                                                    10%     $10
 $6                                                                 8%      $8
 $4                                                                 6%      $6
                                                                    4%      $4
 $2
                                                                    2%      $2
 $0                                                                 0%      $0
                                                                                  Q4 16 Q1 17 Q2 17 Q3 17 Q4 17 Q1 18 Q2 18 Q3 18 Q4 18 Q1 19 Q2 19 2019E

                                                                                    Transport cost ($/boe)     Fees paid on suspended pipeline capacity ($boe)
          Production cost ($/boe)   Production cost as a % of Brent price
                                                                                                                                8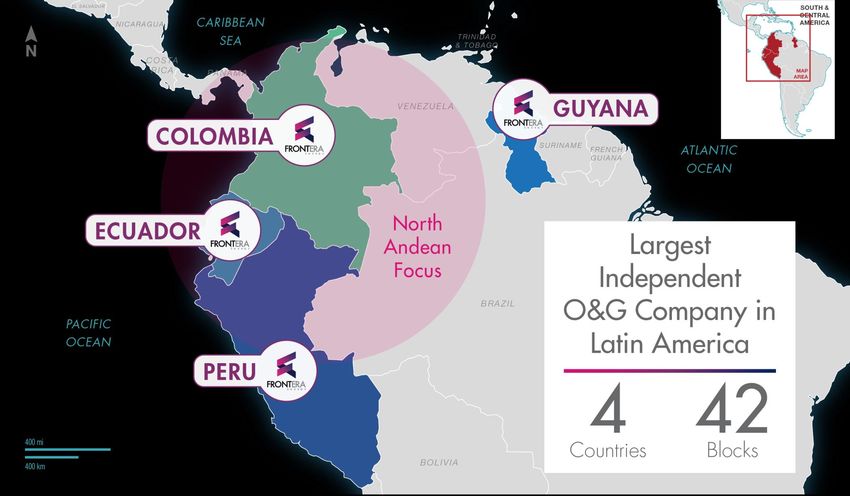
Company Strategy
      Sustaining Base Production for the Next Three to Five Years from Core Assets
      Optimizing Cash Generation and Delivering Enhanced Shareholder Returns
                                                                                                                                           Core Portfolio of Stable Assets
                                                                                                                                                with Growth Options
                                                                                                                               Partner of Choice Wherever We Operate
                                                                                                                                        (Parex, GeoPark, CGX)
                                                                                                                              Maintain Strong Balance Sheet, Financial
                                                                                                                               Flexibility and Low Leverage Ratios to
                                                                                                                                  Enhance Shareholder Returns(1)
                                                                                                                                (5% NCIB and quarterly dividend of
                                                                                                                                             $15 million(2))

                                                                                                                                   Potential to Add New Barrels Through
                                                                                                                                     - Exploration success in Guyana and Colombia
                                                                                                                                     - Ecuador and Colombia Bid Rounds
                                                                                                                                     - New Contracts in Peru and Colombia
                                                                                                                                     - Additional farm-in opportunities

                                                                                                                          Continued Focus on Operational Efficiencies
                                                                                                                                    to Deliver Lower Costs

                                                                                                                                  Realizing Value from Non-Core Assets
(1)    Dividend Policy is to pay $15MM per quarter when Brent averages above $60/bbl. The declaration of any specific dividend, the actual amount, declaration date and the payment of
       each quarterly dividend will be subject to the discretion of the Company's Board of Directors.                                                                                    9
(2)    The Company's Normal Course Issuer Bid (“NCIB”) expired on July 17, 2019. The Company anticipates that it will renew the NCIB. Any renewal would be subject to approval of the
       Company's Board of Directors and the Toronto Stock Exchange.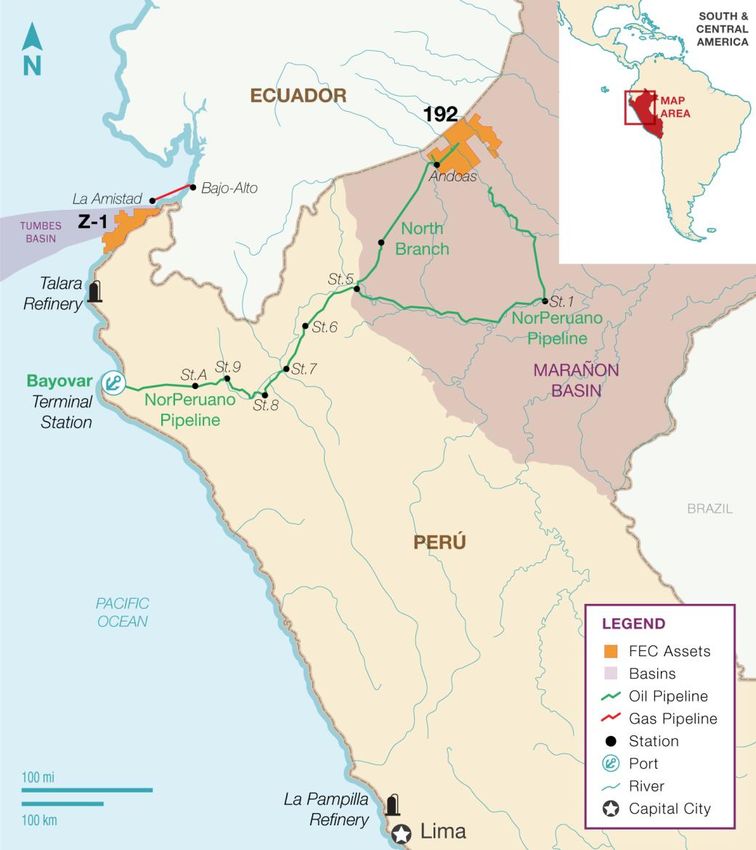
Core Assets Deliver Stable Base Production
 Seven Year Production Profile from Restructuring to Growth

         Frontera Daily Production (before royalties Boe/d)                                                                In the Portfolio           Future Opportunities
90,000
         Restructuring                        Transition                      Growth                                   •    VIM-1/Guama/VIM-22    •    Onshore Perú
80,000
                                                                                                                       •    Guyana and Ecuador         (new Block 192 contract)
                                                                                                                            exploration
                                                                                                                       •    CAG-5/6
70,000

60,000

50,000                                                                                                                                            •    Colombian exploration (Lower
                                                                                                                       •    CPE-6
                                                                                                                                                       Magdalena Valley, Llanos,
                                                                                                                       •    Waterflooding
                                                                                                                                                       Puto Mayo)
40,000                                                                                                                 •    Offshore Perú
                                                                                                                                                  •    Other farm-in opportunities

30,000

20,000
                                                                                                                       •    Quifa
                                                                                                                       •    Guatiquía             •    Tertiary recovery
10,000                                                                                                                 •    Cubiro

    -
                                                                                       2019e

                                                                                               2020e

                                                                                                       2021e

                                                                                                               2022e
         Q117

                Q217

                         Q317

                                Q417

                                       Q118

                                               Q218

                                                       Q318

                                                               Q418

                                                                      Q1 19

                                                                              Q2 19

                       Colombia core            Peru          Sustaining              Growth

                             $250 MM to $300 MM in Annual Capital Expenditures to
                           Maintain Core and Sustaining Production at over 65,000 Boe/d
                                                                                                                                                 10
Our Portfolio
Large Diversified Asset Base with Significant Acreage and Infrastructure
CORE
• Quifa
• Guatiquía
• Cubiro
SUSTAINING
• CPE-6
• Z-1 (Peru)
• Near field exploration
GROWTH
• Colombia existing
exploration and new
acreage
• Offshore Guyana
• Ecuador (Perico & Espejo)
• New contract opportunity
Block 192
• Farm-in opportunities
11Balance Sheet Strength
Strong Cash Position, Low Leverage Ratios
Balance Sheet Metrics – March 31, 2019
Total Cash(1)/Cash and Cash Equivalents ($MM) $486 / $354
Net Debt/EBITDA(2) 0.3x
Debt to Book Capitalization(3) 21.7%
Interest Coverage(4) 15.8x
2019 Hedged Production (April – December)(5) 44%
Dividends (YTD 2019)(6) C$1.44 / 10.3% yield
No debt maturities until 2023
Credit Ratings
Outlook: Stable S&P affirmed a rating of
‘BB-’ on Frontera’s
S&P Issuer Rating: BB- senior unsecured notes
Senior Notes: BB- on October 4, 2018.
Outlook: Negative Fitch reaffirmed a
rating of “B+/RR4” on
Fitch Issuer Rating: B+ Frontera’s senior
Senior Notes: B+/RR4 unsecured notes on
November 27, 2018.
(1) Total cash balance includes current restricted cash $38 MM and non-current restricted cash $93 MM
(2) Net debt/EBITDA is net debt divided by trailing 12 month Operating EBITDA of $538 MM. Net debt is defined as long-term debt minus working capital. Net debt
and Operating EBITDA are Non-IFRS measures
(3) Debt to book capitalization is long term debt divided by long term debt plus shareholders equity
(4) Interest coverage uses trailing 12 month Operating EBITDA of $538 MM divided by the expected annual cash interest of $33.95 MM 12
(5) 35% of production hedged with puts, 9% with cost collarsCorporate Responsibility and Partner of Choice
Committed to Sustainable Operations
Sustainability & Shared Value Model
2018 and 2017 United Nations Global
Compact awards recipient
Nominated by World Finance as “The
Most Sustainable Oil and Gas
Company”
Certified under the ISO 9001:2008, ISO
14001:2004 and OHSAS 18001:2007
norms
• Frontera continues to implement its social investment framework in a manner that encourages local community engagement
and involvement.
• Adopted the Declarations on Human Rights and Gender Equality and remain committed to the promotion and protection of
human rights, freedom of association, eradication of child and forced labour, security, and the economic, social and cultural
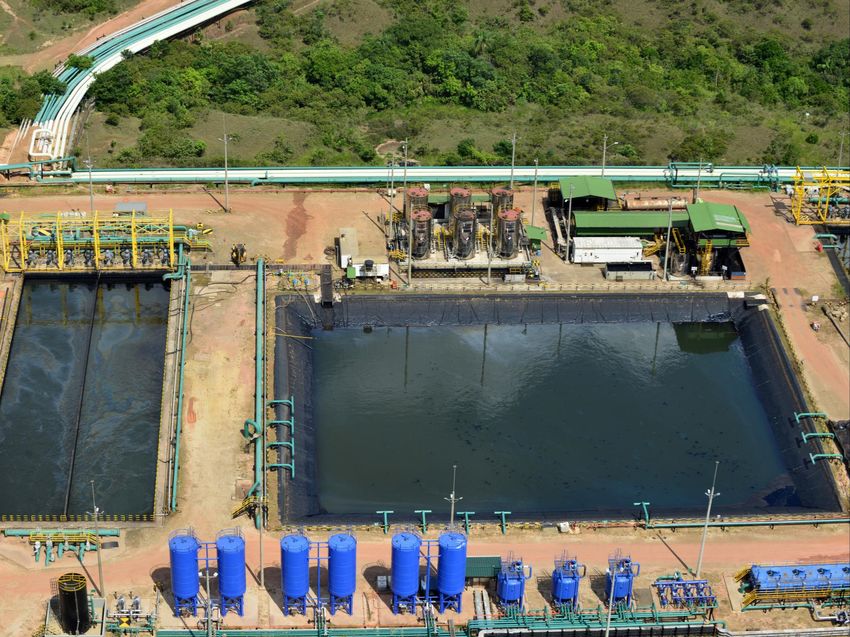
rights of local communities. Delfin Sur Dip Line
• To view Frontera’s annual sustainability report please visit http://www.fronteraenergy.ca/sustainability-reports/
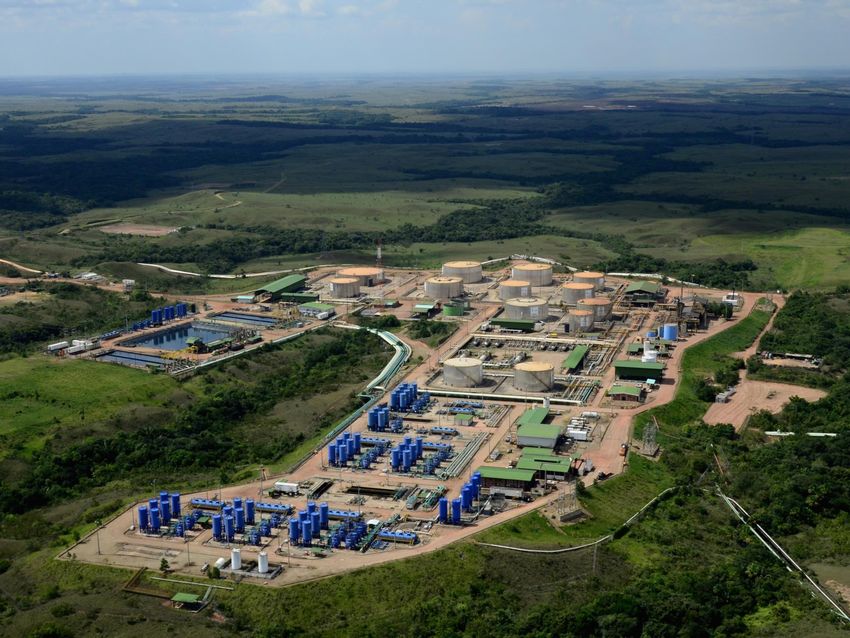
13Core Assets
Quifa: Cornerstone of Heavy Oil Production
                            Stable Production at 27,000 bbl/d for Five Years
                                                           Recent Exploration
                                                              Discoveries                                    Reserves Balances:
                                                                                                             • As of December 31, 2018 (before/after royalties)
                                                                                                                   • 1P: 45.0/38.6 MMbbl
                                                                                                                   • 2P: 56.8/48.4 MMbbl

                                                                                                             Key Characteristics:
                                                                                                             • ~300 wells on production
                                                                                                             • Facilities capacity in excess of 1.7 MMbbl/d of water
                                                                                                               handling capacity
                                                                       Future Development                    • ~ 600 wells to be drilled in the next 7-8 years
                                                                            Potential
                                                                                                             • Additional exploration potential in the area
                                                        Core Production and
                                                             Reserves

                                                                                                             Contract Name                         Quifa Contract
                                                                                                             Contract Type                         Exploration, Development and Exploitation
                                                                                                             Contract Term Expiry                  December 2031
                                                                                                             2018 Production
                                                                                                                                                   ~27,500/~23,000 bbl/d
                           30,000             Quifa, Cajua, Jaspe & Sabanero                                 (before/after royalties)
bbl/d (before royalties)

                           25,000                                                                            2018 2P Reserves                      56.8 MMbbl
                           20,000                                                                            2019 Estimated Capital Expenditures   $105 MM
                           15,000                                                                            Net Acreage                           159,572
                           10,000                                                                            Working Interest                      60% (operator) / 70% of costs
                            5,000
                                                                                                             Partner                               Ecopetrol
                               0
                                Jan-19      Jan-20          Jan-21        Jan-22       Jan-23                Base Royalty Rate                     6% to 25%(1)
                                     PD   1P       2P       3P     Block Expansion   Exploration Potential

                                               At $65 Brent, Generates ~ $250 MM Per Year in Operating Netback
                                                                                                                                                         15
             (1) Depending on oil price and production.
Guatiquía: Building on Deep Llanos Success
Stable Production at 15,000 bbl/d for Three Years
Key Activities:
• Two development wells in 2019
• Cocodrilo exploration in 2020
• Potential expansion of Yatay field
Key Characteristics:
• High productivity light and medium oil reservoirs
• Existing under utilized infrastructure
• Successful appraisal drilling
• Additional exploration potential on the block
• Comingled production added over 900 bbl/d of
incremental production in 2018 from three wells
• Waterflooding potential in 2020 and beyond
Contract Name Guatiquía Contract
Contract Type Exploration, Development and Exploitation
Contract Term Expiry August 2035
18,000 2018 Production
ACAA, Candelilla, Yatay, Coralillo ~15,300/~14,300 bbl/d
16,000 (before/after royalties)
bbl/d (before royalties)
14,000
2018 2P Reserves
12,000 16.6/15.3 MMbbl
(before/after royalties)
$25 Primary
10,000
2019 Estimated Capital Expenditures MM
8,000
Net Acreage 9,274
6,000
4,000 Working Interest 100%
2,000 Base Royalty Rate 6% to 25%(1)
0
Jan-19 Jan-20 Jan-21 Jan-22 Jan-23
1P 2P 3P Block Expansion Exploration Potential 16
(1) Depending on oil price and production.Cubiro: Additional Light Oil Potential
Waterflood to Increase Recovery Efficiency and 3X Production Potential
Key 2019 Activities:
• Six development wells
• Two water injector wells
• Start water injection throughout the whole field
Key Features:
• Growing production during the next two years
Successful Waterflood • Successful waterflooding pilot performed in 2018
Pilot Project
• Full field development plan starting in 2019
• Additional appraisal potential in the area
• Copa Trend has three main objectives; Carbonera C3, Carbonera C5 and Carbonera
Additional C7
Development Drilling • The net pay of Copa wells is ~10 ft in Carbonera C5D1 and ~15 ft in Carbonera
and Waterflood C5D2
Pressure Maintenance
• Full field waterflooding project will be implemented in 2019 and 2020
Programs
• Producer wells are located along the crest of the reservoir 64 producer wells, 23 in
Copa, 14 in Copa A, 8 in Copa B, 4 in Copa C and 14 in Copa D
Contract Name Cubiro
Contract Type Exploration and Production
Contract Term Expiry September 2037
14,000 Cubiro 2018 Production (before/after royalties) ~3,550/~3,275 bbl/d
12,000 2018 2P Reserves
bbl/d (before royalties)
15.6/14.3 MMbbl
10,000 (before/after royalties)
8,000 2019 Estimated Capital Expenditures $35 MM
6,000 Net Acreage 44,360
4,000
Working Interest 100%
2,000
PAP After 5 MMbbl
0
Jan-19 Jan-20 Jan-21 Jan-22 Jan-23 Base Royalty Rate 6% to 25%(1)
1P 2P 3P Block Expansion Exploration Potential
17
(1) Depending on oil price and production.Sustaining & Growth Assets
Hamaca Field (CPE-6)
Large Oil In Place, Reserves, Production Upside
2018 Reserves Balance (before/after royalties)
• 1P: 21.6/21.6 MMbbl
• 2P: 27.4/27.4 MMbbl
• ~ 190 wells for a 5 Mbbl/d and 250 Mbbl/d of water plateau
Key 2019 Activities:
• Drill two exploration wells, seven development wells and one
injection well
• The Amanecer-1 exploration well extended the northwest part of the
field with impressive results
• Two horizontal well tests at over 350 bbl/d of oil with good water
cuts
• Currently drilling the Coplero-1 exploration well drilling which is
evaluating the southeast extension of the field.
Key Features:
• Potential to grow production following pilot project
• 5 to 8 Mbbl/d of oil production potential
Waterflood
Contract Name CPE-6
9,000
Contract Type Exploration and Production
8,000 CPE-6 Contract Term Expiry January 2042
Primary
bbl/d (before royalties)
7,000 2018 Production (before/after royalties) 940/940 bbl/d
6,000
2018 2P Reserves
5,000 27.4/27.4 MMbbl
(before/after royalties)
4,000 Phase 4 2019 Estimated Capital Expenditures $17 MM
3,000 Phase 3 Net Acreage 26,700
2,000
Stable plateau production for5 year + Phase 2
1,000 Working Interest 100%
0
Phase 1
Base Royalty Rate 6% to 25%(1)
Jan-19 Jan-20 Jan-21 Jan-22 Jan-23
1P Block Expansion 19
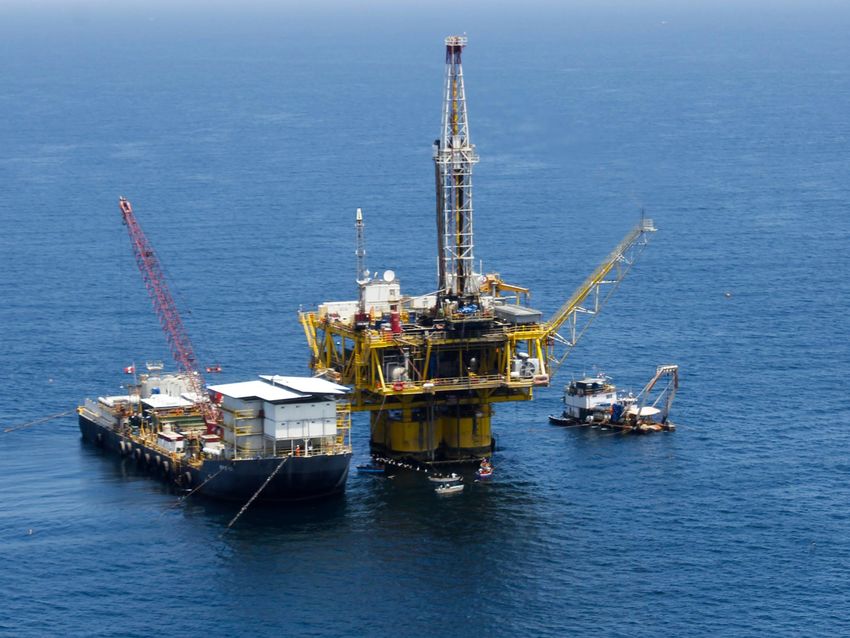
(1) Depending on oil price and production.Guyana
Exciting Exploration Opportunities
• Over 1.8 million gross acres in the hottest offshore exploration
basin in the world
• Two well commitment plus a two well option, total capital
estimated at less than $50 million net to Frontera
• Multiple play types with vertical and lateral migration derisked by
ten discoveries on adjacent block
• Two wells to be drilled in 2020, one on each block following
evaluation of 3D seismic on each block
• Jethro and Joe prospects currently being drilled on adjacent
Oriduoh block
• 8/9 prospects identified with further potential following
additional 3D seismic program and evaluation
• Both shallow and medium water depth opportunities
• Equity ownership of 67.78% in CGX (TSXV: OYL)
Contract Name Waterflood
Petroleum Prospecting License (PPL)
Contract Type Petroleum Prospecting License (PPL)
First Corentyne well to be drilled in 2020
Second Corentyne well to be drilled by
November 27, 2022
Contract Term Primary
First Demerara well to be drilled in 2020
Second Demerara well to be drilled by
February 12, 2023
Gross Acreage 1,875,000
Working Interest in the Blocks 33.333%
Base Royalty Rate 1%
20
Source: Corporate presentations from other companies active offshore guyanaEcuador: Intracampos Exploration Bid Round
Awarded the Perico and Espejo Blocks (Frontera 50% / GeoPark 50%)
• Four year exploration term with
two year extension
• Proven hydrocarbon basin near
existing production and
infrastructure
• Prospective, low-risk exploration
blocks located in Sucumbíos
Province in the north-eastern part
of Ecuador, in the Oriente basin,
and have a total area of
approximately 13,504 ha (33,369
acres), of which Frontera holds
6,752 ha net (16,685 acres)
• Both blocks are covered with 3D
seismic
• The Oriente basin currently
produces more than 500,000
bbl/d
Perico Block Espejo Block
• 7,170 ha (17,700 acres) • 6,334 ha (15,650 acres)
• The exploration work commitments include: • The exploration work commitments include:
• the drilling of four wells • the drilling of four wells
• 72 km2 of 3D seismic reprocessing • 3D seismic acquisition program of 55 km2
• 72 km2 of magnetometry and gravimetry • 74 km2 of 3D seismic reprocessing
• 63 km2 of magnetometry
21Peru
Potential for New Contract & Shallow Offshore Exploration
Block 192
• Production currently shut in under force majeure
following community dispute relating to the
NorPeruano pipeline on July 1, 2019
• Production of ~9,500 bbl/d prior to force majeure
event
• Current service contract expected to expire in Q1
2020
• Recent change of government - new policies on new
contract yet to be established
• 13 producing fields with varying API gravities
Offshore Z-1
\
• Existing producing fields at Corvina and Albacora in
close proximity to Talara Refinery
• Strong pricing - $1.00 to $2.00 discount to Brent
• In process of re-evaluating the exploration prospects
on the block
8,000 bbl/d subject to pipeline
2018 Net Production
availability
Net Acreage 1,266,037
Working Interest Service Contract(1)
Crude Split 84% FEC, 16% Perupetro
Cumulative Production(2) 734 MMbbl
Operator Frontera
(1) The Company does not hold a working interest in the block. Frontera receives payment in-kind from Perupetro S.A., which ranges from 44% to 84% of production. Frontera
currently receives 83% - 84% of production from the block 22
(2) Cumulative production of the block as of December 31, 2018Realizing Value from Non-Core Assets
Midstream and Infrastructure Assets Hold Significant Value
1) ODL Pipeline 2) Puerto Bahía
35.0% Indirect Interest(1) 39.2% Indirect Interest(2)
• Ships the Company’s heavy crude oil from Quifa SW • Greenfield liquids import-export terminal with 2.4
and Cajua fields to Coveñas export terminal via MMbbl of storage capacity and a dry terminal for
Bicentenario/OCENSA various types of cargo
• Potential near-term value accretion by connecting to
• 235 km of 24” pipeline
refinery and expanding dry dock
• 340 Mbbl/d capacity • Assessing refinancing opportunities
• Other major shareholders: • Other major shareholders:
✓ CENIT: 65.0% ✓ IFC: 32.3%(3)
✓ IFC: 12.7%(2) ✓ Blue Pacific: 19.1%
(1) Indirect interest through Pacific Midstream Limited
(2) Indirect interest through Infrastructure Ventures Inc. 23
(3) International Finance Corporation – World Bank GroupInvestment Opportunity
Enhancing the Portfolio
Experienced,
Focused asset 97% oil weighted technically-
Partner of
base in North with Brent price focused
exposure Choice
Andean Region management
team in place
Strong balance
sheet with
targeted
Attractive, low- Improved
quarterly Over 90% near-
risk “brownfield” transportation
dividend of $15 field exploration
development costs and
million with $40 commitments success in 2018
opportunities
million special
dividend and 5%
NCIBAppendix
Second Quarter 2019 Operational & Financial Highlights
   Strong Operating EBITDA and Improving Cost Structure
                                                                  Q2 2019           Q1 2019 % Chg.   Price / Revenue / Production
                                                                                                     Brent oil prices increased 7% quarter-over-quarter to $68.47/bbl
 Production Before Royalties (Boe/d)                                  74,385         67,974    9%    while realized price increased 11% quarter-over-quarter.
 Production After Royalties (Boe/d)                                   67,114         62,893    7%    Revenue was $377.3 million, relatively unchanged compared to
 Net Income (Loss) ($MM)                                                 $228           $46 >100%    $377.5 million in the first quarter of 2019.
                                                                                                     Production averaged 74,931 boe/d. Current production is over
 Net Sales ($MM)(1)                                                      $362          $293   24%    65,000 boe/d as a result of a new force majeure event on the
 Cash Flow from Ops ($MM)                                                 $176          $72   100%   NorPeruano pipeline impacting production on Block 192.
 Operating EBITDA ($MM)(2)(3)                                            $181          $145   25%    Production was 97% oil weighted in the second quarter of 2019
                                                                                                     compared to 96% in the first quarter of 2019. The higher oil mix as
 Combined Realized Price ($/Boe)(3)                                   $64.68         $57.78   12%    a percentage of total production results in better realized prices
 Operating Costs ($/Boe)                                              $11.17         $11.40   (2%)   given strong Brent oil prices and narrow Vasconia oil differentials.

 Operating Netback ($/Boe)(1)                                         $36.45         $30.23   21%    Strong Operating EBITDA
 Capital Expenditures ($MM)                                                   $73       $69    6%    Operating EBITDA of $181.2 million was 25% higher than Q1 2019
                                                                                                     and 45% higher than Q2 2018.
 G&A Expenses ($MM)                                                           $18       $16   13%
                                                                                                     Cost Improvements
                                                                                                     Production costs during the second quarter of 2019 were 2% lower
                                                                                                     compared to the first quarter of 2019. Continued cost savings and
                                                                                                     efficiency improvement initiatives are being implemented.
                                                                                                     Capital Expenditures
                                                                                                     Capital expenditures of $73 million during the second quarter of
                                                                                                     2019 were 6% higher than the first quarter of 2019 driven by the
                                                                                                     drilling of 42 wells during the quarter as compared to 31 wells in
                                                                                                     the prior quarter.

(1) Non-IFRS Measures. See advisories
(2) Excludes fees paid on suspended pipeline capacity                                                                                  26
(3) Includes other revenue and realized losses on risk management contracts
Second Quarter 2019
Financial &
Operational
Net income of $228 MM ($2.32/share) in Q2 2019 Highlights
compared to net income of $46 MM in ($0.47/share)
in Q1 2019 driven by strong realized prices and lower
operating and transportation costs. Production averaged 74,385 boe/d, an increase of 9%
compared to Q1 2019. Current production is over 65,000
boe/d, as a result of a new force majeure event on the
Cash provided by operating activities of $176 MM in Q2 NorPeruano pipeline impacting production from Block 192
2019 compared to cash provided by operating activities of in Peru.
$72 MM in Q1 2019. Cash provided by operating activities A total of 42 development and exploration wells were
adjusted for changes in non-cash working capital was drilled in Q2 2019. 39 development wells were drilled
$183 MM in Q2 2019. compared to 37 development wells planned, as efficiency
improvements at Quifa have led to wells being drilled in
Operating EBITDA of $181 MM was 25% higher than
less time.
Q1 2019.
Production costs during Q2 2019 were $11.17/boe, 2%
Operating netback during Q2 2019 was $36.45/boe, lower compared to Q1 2019.
21% higher than in Q1 2019 driven by higher production,
higher realized prices, and lower production costs.
272018 Reserves Evaluation Results
Replaced 103% of 2018 Production and Strong 2P NPV10 Value
2P Net Reserves - MMBOE NPV by Category @ 10% (MMUSD)
175
25 -24
3,000
150
2,523
2,500
125 2,206
1,932 587
1,918
2,000
100
402 778
566 714
75 154 154 155 1,500
458
577 611
50 1,000
1,072 1,222
25 500
775 817
0 0 After Taxes Before Taxes
2P Reserves Additions Production 2P Reserves 2018 2017 2018 2017
2017 2018
Proved Developed Proved Undeveloped Probable
• Replaced 103% of 2018 proved 2P reserves
• Heavy oil represents 62% of proved plus probable reserves, light oil 36% and natural gas 2%
• 68% of 2018 total company 2P reserves are proved
• Reserves additions driven by Quifa CMA project and Guatiquia discoveries
28Transportation Costs
P-135 Arbitration Settlement, Termination of Ship or Pay Contracts
Quarterly Transportation Cost ($/boe)
$13.77
$12.89 $12.70 $12.70
Transport $12.68
Cost ($/Boe)
Q2'18 Q3'18 Q4'18 Q1'19 Q2'19
Fees Paid on Suspended
$7.00 $3.94 $0.00 $0.00 $0.00
Pipeline Capacity ($/Boe)
Termination of Transportation Contracts OCENSA P-135 Project Arbitration
• Bicentenario Pipeline: • Ship or Pay: 30,000 bbl/d until June 2025
• Ship or Pay: 47,333 bbl/d, $7.56 bbl until • Settlement tariff of $6.36 bbl vs. $8.77 bbl
June 2024 • Reduces future transportation commitments
• Annual Commitment: $130.6 million by $178.3 million
• Cano Limon Pipeline: • Monetary conditions not applicable for 21.1 °API vs
• Ship or Pay: 47,333 bbl/d, $3.09 bbl 21.9 °API
• October 2028 • Eliminates the risk of increased oil quality
• Annual Commitment: $53.4 million discounts of $199.2 million
29Frontera Offers Deep Value Following Restructuring
Improved Liquidity Driven by Index Inclusion and Share Buybacks
Enterprise Value (US$)/2019 Guidance (Boe/d)(1) Enterprise Value (US$)/2P Reserves (2018/2017) (1)
$50,000 $18
$45,000 $16
$40,000 $14
$35,000 $12
$30,000
$10
$25,000
$8
$20,000
$6
$15,000
$4
$10,000
$5,000 $2
$0 $0
Frontera Canacol Gran Average GeoPark Parex Vermillion Frontera GeoPark Gran Tierra Canacol Average Parex Vermillion
Tierra
Monthly Share Repurchases and Average Price FEC 30 Day Average Volume
800,000 $20
$30 NCIB July 18, 2018
700,000 $18 Share Split 500,000
$16 $25 June 26, 2018
600,000 400,000
$14 $20
500,000 $12 300,000
$15
400,000 $10 200,000
$10
300,000 $8
$6 $5 100,000
200,000
$4 $0 -
100,000 $2
- $0
30 Average Volume FEC CN Closing Price
Monthly Volume Average Price
30
(1) Enterprise value according to Bloomberg on February 6, 2019 guidance and reserve information from Company reportsProven Management Team
Proven Leadership with Global Experience
• Over 36 years of experience with major international oil & gas companies, including BP, Talisman Energy, and
Richard Herbert
Phillips Petroleum
CEO
• Responsible for major exploration and development initiatives in 26 years at BP, including Colombia
• Former Senior Vice President and CFO of Penn West Petroleum Ltd.
David Dyck
• Proven track record of value creation. Over 30 years in senior financial and leadership roles within the Canadian
CFO
energy industry
• Senior Partner of McMillan LLP with over 35 years of experience
Andrew Kent
• Rated as AV® Preeminent™ by Martindale-Hubbell and has been repeatedly listed in Lexpert's Leading 500
General Counsel
lawyers in Canada
• Over 18 years of oil & gas industry and capital markets experience, including 10 years of sell side sales, trading
Grayson Andersen
and research
VP, Capital Markets
• Former capital markets advisor to GeoPark, and manager of Investor Relations at Canadian Natural Resources
Alejandra Bonilla
• Over 14 years of legal experience in oil & gas in multijurisdictional M&A, corporate law, and corporate finance
VP, Legal & Head of Legal
• Formerly with BP and several international and domestic law firms in Colombia
Colombia
Renata Campagnaro
• With Company since 2010; over 36 years in industry in supply operation, trading, and business development
VP, Supply, Transportation
• Former Managing Director of Petróleos de Venezuela Do Brasil
& Trading
Erik Lyngberg • Over 30 years experience in the global oil & gas industry
VP, Exploration • Former SVP, Exploration at Petrominerales; former Chief Geologist of Petrobank Energy
Duncan Nightingale
• Over 30 years experience in the global oil & gas industry
VP, Operations, Development &
• Formerly Chief Operating Officer at Gran Tierra Energy
Reservoir Management
• Over 20 years of experience in Finance as CFO and VP of Planning of leading companies in Colombia and
Alejandro Piñeros
Management Consulting with McKinsey & Company and Booz Allen & Hamilton
VP, Strategy & Planning
• Formerly Corporate Finance Director and interim CFO at Frontera Energy
31Independent Board of Directors
Engaged and Active in Unlocking Shareholder Value
Gabriel de Alba • Managing Director and Partner of The Catalyst Capital Group Inc.
Chairman • International experience restructuring public and private companies, unlocking value for investors
• Over 35 years of international experience in the oil & gas industry with BP where he held roles in Argentina,
Ellis Armstrong Colombia, Venezuela, Trinidad, Alaska, and the North Sea
Director • Former CFO of BP’s global exploration and production business
• Currently serves as independent director of Lamprell PLC
• Former President of the Colombian Association of Pension Funds
Luis F. Alarcón • Former CEO of Interconexión Electrica S.A.
Director • Former CEO of Flota Mercante GranColombiana
• Currently serves as Chairman of the Board of Directors of Grupo Sura and Almacenes Éxito
• Former Vice Minister of Energy of the Ministry of Mines and Energy in Colombia between 2013 and 2014
Orlando Cabrales Segovia • Former President of the Agencia Nacional de Hidrocarburos ("ANH") from 2011 to 2013
Director • Over 30 years of experience in the Colombian oil and gas industry having held senior roles at BP in Latin America
and at Ecopetrol S.A.
• Former Partner of PwC where he served for almost 40 years
• Led the PwC Professional, Technical, Risk and Quality Group
Raymond Bromark • Currently serves as Director and Chair of the Audit and Ethics Committee for YRC Worldwide Inc., Director and
Director Chair of the Audit Committee and member of the Conflicts Committee for Tesoro Logistics GP LLC prior to its
October 2018 merger with Marathon Petroleum Corporation, and Director and Chair of CA, Inc. prior to its
acquisition by Broadcom in November 2018.
• Over 35 years of experience in the oil & gas industry primarily with Shell
Russell Ford
• Former EVP, Contracting & Procurement, EVP, Onshore, and Head of EP Strategy and Portfolio at Shell
Director
• Former VP at Western Hemisphere
• Currently serves as Vice President and Chief Operating Officer of ISH Energy Limited in Calgary, Alberta, Canada
Veronique Giry • Over 25 years experience including senior management roles at the Alberta Energy Regulator and Total E&P in
Director Canada, Asia, Europe and Latin America
• Masters in Engineering degree from Ecole Centrale de Paris, France, with a major in Mechanics
32INVESTOR RELATIONS CONTACT:
Grayson M. Andersen
Corporate Vice President, Capital Markets
Calle 110, No 9 – 25, Piso 16
Bogota, DC, Colombia
+57 (314) 250-1467
gandersen@fronteraenergy.ca
ir@fronteraenergy.caYou can also read