Corporate Update | January 2018 - Newmont
←
→
Page content transcription
If your browser does not render page correctly, please read the page content below
Corporate Update | January 2018
Forward-Looking Statements

    This presentation contains “forward-looking statements”, within the meaning of Section 27A of the United States Securities Act of 1933, as amended, Section 21E of the United States Exchange Act of 1934, as amended, or the United
    States Private Securities Litigation Reform Act of 1995, and “forward-looking information” under the provisions of applicable Canadian securities legislation, concerning the business, operations and financial performance and condition
    of Goldcorp. Forward-looking statements include, but are not limited to, statements with respect to the future price of gold, silver, copper, lead and zinc, the estimation of Mineral Reserves (as defined in slide 28) and Mineral Resources
    (as defined in slide 28), the realization of Mineral Reserve estimates, the timing and amount of estimated future production, costs of production, targeted cost reductions, capital expenditures, free cash flow, costs and timing of the
    development of new deposits, success of exploration activities, permitting time lines, hedging practices, currency exchange rate fluctuations, requirements for additional capital, government regulation of mining operations, environmental
    risks, unanticipated reclamation expenses, timing and possible outcome of pending litigation, title disputes or claims and limitations on insurance coverage. Generally, these forward-looking statements can be identified by the use of
    words such as “plans”, “expects”, “is expected”, “budget”, “scheduled”, “estimates”, “forecasts”, “intends”, “anticipates”, “believes” or variations of such words and phrases or statements that certain actions, events or results “may”,
    “could”, “would”, “might” or “will”, “occur” or “be achieved” or the negative connotation thereof.

    Forward-looking statements are necessarily based upon a number of factors that, if untrue, could cause the actual results, performances or achievements of Goldcorp to be materially different from future results, performances or
    achievements expressed or implied by such statements. Such statements and information are based on numerous assumptions regarding present and future business strategies and the environment in which Goldcorp will operate in the
    future, including the price of gold and other by-product metals, anticipated costs and ability to achieve goals. Certain important factors that could cause actual results, performances or achievements to differ materially from those in the
    forward-looking statements include, among others, gold and other by-product metals price volatility, discrepancies between actual and estimated production, mineral reserves and mineral resources and metallurgical recoveries, mining
    operational and development risks, litigation risks, regulatory restrictions (including environmental regulatory restrictions and liability), changes in national and local government legislation, taxation, controls or regulations and/or change
    in the administration of laws, policies and practices, expropriation or nationalization of property and political or economic developments in Canada, the United States and other jurisdictions in which the Company does or may carry on
    business in the future, delays, suspension and technical challenges associated with capital projects, higher prices for fuel, steel, power, labour and other consumables, currency fluctuations, the speculative nature of gold exploration, the
    global economic climate, dilution, share price volatility, competition, loss of key employees, additional funding requirements and defective title to mineral claims or property. Although Goldcorp believes its expectations are based upon
    reasonable assumptions and has attempted to identify important factors that could cause actual actions, events or results to differ materially from those described in forward-looking statements, there may be other factors that cause
    actions, events or results not to be as anticipated, estimated or intended.

    Forward-looking statements are subject to known and unknown risks, uncertainties and other important factors that may cause the actual results, level of activity, performance or achievements of Goldcorp to be materially different from
    those expressed or implied by such forward-looking statements, including but not limited to: risks related to international operations including economic and political instability in foreign jurisdictions in which Goldcorp operates; risks
    related to current global financial conditions; risks related to joint venture operations; actual results of current exploration activities; actual results of current reclamation activities; environmental risks; conclusions of economic evaluations;
    changes in project parameters as plans continue to be refined; future prices of gold and other by-product metals; possible variations in ore reserves, grade or recovery rates; failure of plant, equipment or processes to operate as
    anticipated; the benefits of the acquisition not being realized; risks related to the integration of acquisitions; accidents, labour disputes; delays in obtaining governmental approvals or financing or in the completion of development or
    construction activities and other risks of the mining industry, as well as those factors discussed in the section entitled “Description of the Business – Risk Factors” in Goldcorp’s most recent annual information form available on SEDAR at
    www.sedar.com and on EDGAR at www.sec.gov. Although Goldcorp has attempted to identify important factors that could cause actual results to differ materially from those contained in forward-looking statements, there may be other
    factors that cause results not to be as anticipated, estimated or intended. There can be no assurance that such statements will prove to be accurate, as actual results and future events could differ materially from those anticipated in
    such statements. Accordingly, readers should not place undue reliance on forward-looking statements. Forward-looking statements are made as of the date hereof and, accordingly, are subject to change after such date. Except as
    otherwise indicated by Goldcorp, these statements do not reflect the potential impact of any non-recurring or other special items or of any dispositions, monetizations, mergers, acquisitions, other business combinations or other
    transactions that may be announced or that may occur after the date hereof. Forward-looking statements are provided for the purpose of providing information about management’s current expectations and plans and allowing investors
    and others to get a better understanding of the Company’s operating environment. Goldcorp does not intend or undertake to publicly update any forward-looking statements that are included in this document, whether as a result of new
    information, future events or otherwise, except in accordance with applicable securities laws.

2
Bitcoin And Blockchain Here To Stay But So Is Gold

                                    Price of Gold & Bitcoin                    Value of Bitcoin Market ~$300 Billion

         $20,000
                                                                               •   The removal of intermediaries in financial transactions
                                                                               •   Finite quantities
         $18,000
                                                                               •   Store of value outside of fiat currencies
         $16,000

         $14,000
                                                                               Value of Gold Market ~$8 Trillion
         $12,000
                                                                               •   5,000 year history as a store of value
         $10,000
                                                                               •   Physical, tangible asset
           $8,000                                                              •   Much more liquid and less volatile
           $6,000

           $4,000                                                              Opportunity to tap demand by combining
                                                                               gold and blockchain
           $2,000
                                                                                                       STAY TUNED!
                $0
                  2010     2011     2012    2013   2014   2015   2016   2017

Source: Bloomberg, as of January 11, 2018

  3
Gold Price Momentum During Tightening Cycles

                                                                                                                                      Great
                                                 1979 Energy                                                                        Recession
                                 $2,000                                                                                                           20
                                                    Crisis
                                 $1,800                                                                                                           18

                                 $1,600                  1981 -1982                                                                               16
                                                         Recession              1990 Oil Price
                                                                                   Shock
                                 $1,400                                                                                                           14

                                                                                                                                                       Fed Funds Rate (%)
           Gold Price (US$/oz)

                                                                                                                   Dot Com
                                 $1,200                                                                             Bubble                        12

                                 $1,000                                                                                                           10

                                  $800                                                                                                            8

                                  $600                                                                                                            6

                                  $400                                                                                                            4

                                  $200                                                                                                            2

                                    $0                                                                                                            0
                                          1975
                                          1976
                                          1977
                                          1978
                                          1979
                                          1980
                                          1981
                                          1982
                                          1983
                                          1984
                                          1985
                                          1986
                                          1987
                                          1988
                                          1989
                                          1990
                                          1991
                                          1992
                                          1993
                                          1994
                                          1995
                                          1996
                                          1997
                                          1998
                                          1999
                                          2000
                                          2001
                                          2002
                                          2003
                                          2004
                                          2005
                                          2006
                                          2007
                                          2008
                                          2009
                                          2010
                                          2011
                                          2012
                                          2013
                                          2014
                                          2015
                                          2016
                                                               Fed Funds Rate           Real Gold Price - 2017 Dollars       Nominal Gold Price
Source: Facset, as of December 31 of each year

   4
Goldcorp’s Portfolio and Strategy

                                            CANADA
                                            •   Porcupine, ONTARIO        OPTIMUM        3 to 4 Million Ounces
                                            •   Musselwhite, ONTARIO        SIZE         from 6 to 8 Camps
                                            •   Red Lake, ONTARIO
                                            •   Éléonore, QUEBEC
                                            •   Coffee, YUKON
                                            •   Borden, ONTARIO
                                            •   Century, ONTARIO          OPTIMUM
                                            •   Cochenour, ONTARIO                       Americas Focused
                                                                         GEOGRAPHY

    LATAM
    •     Peñasquito, MEXICO                                            OPTIMUM COST
    •     Cerro Negro, ARGENTINA                                                         $700/oz All-in Sustaining Cost
    •     Alumbrera, ARGENTINA 37.5%                                     STRUCTURE
    •     Pueblo Viejo, DOM. REPUBLIC 40%
    •     NuevaUnión, CHILE 50%
    •     Norte Abierto, CHILE 50%
                                                                                         Driving Toward Zero Net Debt1
                                                                       OPTIMUM CAPITAL
         Operations                                                      STRUCTURE       Highest Rated Balance Sheet in
         Projects
                                                                                         Gold Industry

    1   See appendix C for footnotes.

5
Deleveraging Before the Next Capital Investment Cycle
                                                                             $3,000                                             1.4
    Harvest mode over the next 5 years
       •   Generating strong cash flow from core assets                      $2,500
                                                                                                                                1.2

                                                                                                                                1.0
    Balance sheet remains strong                                             $2,000

                                                                                                                                      Net Debt / EBITDA (Adj.)
       •   Driving towards zero net debt
                                                                                                                                0.8

                                                          Adj. EBITDA ($M)
       •   More than $3 billion in liquidity                                 $1,500
       •   Strong credit rating: BBB+/Baa3                                                                                      0.6

                                                                             $1,000
    Preparing for the next capital investment                                                                                   0.4
    cycle ‘Beyond 20/20’:
                                                                              $500
       •   Century                                                                                                              0.2

       •   NuevaUnión
       •   Norte Abierto                                                        $0                                              0.0
                                                                                       2018E     2019E     2020E      2021E

                                                                                  Adj. EBITDA ($M)       Net Debt to EBITDA (Adj.)

6
Executed on 2017 Objectives

    Objectives                                                                  Results

    ✓ Production of 2.5 Moz (+/- 5%)                                            2.57 Moz

    ✓ AISC initial guidance $850/oz (+/- 5%)                                    $825/oz

    ✓ Annual efficiencies of $250 million by mid-2018                           $200 million to date

    ✓ Advance Peñasquito Pyrite Leach Project to completion by Q1 2019          One quarter ahead of schedule

    ✓ Advance Musselwhite Materials Handling Project to completion by Q1 2019   On schedule and under budget

    ✓ Dome Century base case pre-feasibility and initial reserves               Completed Q3 2017 with 5.7Moz in reserves

    ✓ Initial reserves and mine plan at Cochenour                               30-50 koz per year starting in 2019

    ✓ Advance Borden studies to provide more ore to Porcupine                   Ramp advance to 680m; Production H2 2019

                                                                                >$500M of non-core asset sales reinvested
    ✓ Portfolio Optimization
                                                                                in new growth in Chile and the Yukon

7
Goldcorp’s 20/20/20 Plan Unchanged

                   Production     AISC      Reserves

                     20%          20%        20%
           2017     Growth      Reduction              2021
                                            Growth

8
20% Growth in Production1

                                                                   20% Growth

                                                                                                 3.0          3.0
                                                                                                 Moz          Moz
                                                                       2.7
                                                                       Moz
               2.5                            2.5
                                             2.5
                                             2.7
               2017
               Moz                            Moz
                                             Moz                                                 2020        2021
                                                                     2019                                  Additional
                                                                                                           Optionality
              2017                             2018
                                         •   Complete ramp-up at Éléonore and Cerro Negro                   HG Young
                                         •   Increased grade at Peñasquito following stripping               Century
                                         •   Pyrite Leach Project at Peñasquito                            Chilean JV’s
                                         •   Materials Handling Project at Musselwhite                  Brownfield Growth
                                         •   Coffee and Borden projects

    1 Production   guidance are +/- 5%

9
20% Reduction in All-In Sustaining Costs1

                                                                                              20% Reduction

             $825
             2017
               /oz
                                                             $800
                                                                 /oz

              2017                                                                                      $750
                                                                                                           /oz
                                                              2018                                                                         $700   $700
                                                                                                                                            /oz    /oz
              $850/OZ(1)                                                                                2019

                                                                                                                                           2020   $700
                                                                                                                                                  2021
                                                     • $250M in annual sustainable efficiencies target
                                                     • Increased metals production
                                                     • Lower sustaining capital expenditures

     1 Guidance   figures are +/- 5%, 2017 AISC of $825/oz is based on an estimate. See appendix C for pricing assumptions and footnotes

10
20% Reserve Growth Target1
20% Growth
2016 2017 2021
Coffee
Pueblo Viejo
50.0 53.5 Cerro Negro 60.0
Moz Moz Norte Abierto Moz
Other Targets
1 Refer to the reserves and resources statement on Goldcorp’s website at www.goldcorp.com for more details on June 30, 2016 and June 30, 2017 mineral reserve and mineral resource estimate
11Strongest Pipeline in Gold Industry
Concept Study Pre-Feasibility Study Feasibility Study Permitting Construction Commercial Production
PEÑASQUITO – PYRITE LEACH
OPERATIONS
MUSSELWHITE – MATERIALS HANDLING
OPERATIONS
PORCUPINE – BORDEN
OPERATIONS
COFFEE OPERATIONS
RED LAKE – COCHENOUR
OPERATIONS
RED LAKE – HG YOUNG
PORCUPINE – CENTURY PROJECT
NUEVAUNIÓN
NORTE ABIERTO
2017 2018 2019 2020 2021
12Peñasquito - Responsible Performance to Plan
2018 gold production of 310 koz and 1,050 koz gold equivalent
ounces
• Mining activities in Phase 5D to be completed by Q1 2018
resulting in high strip year, 55% of mill feed from lower grade
310koz $250/oz
Production2 AISC2
stockpiles 2018 2018
• Chile Colorado pit development advancing to plan – ore expected
in late 2018
2018 stripping exposing higher grade ore from Phase 6D –
setting up for strong 2019-2021
Ownership 100%
Pyrite Leach Project – Schedule advancing ahead of plan Location Zacatecas, Mexico
• Commissioning and planned commercial production for the Pyrite P&P gold reserves1 9.0 moz
Leach Project advanced to Q4 2018 – 3 months ahead of schedule
M&I gold resources1 2.4 moz
Innovation – EcoTails Program advancing – expecting Inferred gold resources1 0.2 moz
feasibility study approval for prototype in 2018
2018 exploration budget2 $5 M
Target generation successful – positive discussions ongoing 2018 capital budget2 $555 M
regarding regional exploration program
1As of June 30, 2017. Refer to the reserve and resource statement on Goldcorp’s website for more details
2 Guidance figures are +/- 5%. See appendix C for pricing assumptions and footnotes
13Grade Profile Driving Strong Gold Equivalent Production
Gold Silver
1.0 50
Actual
0.8 0.66 40
0.78 Actual 40.56
Au, g/t
Ag, g/t
0.6 30 23.51 35.53
0.63 30.70
0.4 0.53 20 26.88
0.44 23.65
0.40
0.2 10
0.0 0
2017 2018E 2019E 2020E 2021E 2017 2018E 2019E 2020E 2021E
Lead Zinc
0.5% 1.0%
Actual
0.4% 0.47% 0.8% 0.64%
Actual 0.41%
0.3% 0.6% 0.71% 0.75%
Pb (%)
Zn (%)
0.23% 0.70%
0.61%
0.28% 0.27% 0.56%
0.2% 0.4%
0.23%
0.1% 0.2%
0.0% 0.0%
2017 2018E 2019E 2020E 2021E 2017 2018E 2019E 2020E 2021E
14Cerro Negro – Stabilization and Growth
Continue bringing development and overall productivity
up, providing for sustainability of production rates
• Mine productivity – meters and tonnes per person
490koz $600/oz
Production2 AISC2
• Mariana Norte coming online in the second half of 2018, allows 2018 2018
full mill utilization by Q4 2018
• Emilia and Mariana Norte Este coming online in 2019 and 2020,
providing stable production profile
Ownership 100%
Additional mining areas may be exploited to increase Location Santa Cruz, Argentina
production levels ‘Beyond 20/20’
P&P gold reserves1 4.9 moz
• New discoveries and productivity improvements key to growth
beyond nameplate capacity with minimal additional investments M&I gold resources1 1.2 moz
• Key to long-term Cerro Negro growth Inferred gold resources1 0.1 moz
• Stable socio-political environment 2018 exploration budget2 $20 M
• Efficient new mine development 2018 capital budget2 $130 M
1 As of June 30, 2017. Refer to the reserve and resource statement on Goldcorp’s website for more details
2 Guidance figures are +/- 5%. See appendix C for pricing assumptions and footnotes
15Éléonore - Strategic Plan Supports Ramp-Up
Several mining fronts re-sequenced in 2017 to
address geotechnical conditions 360koz $900/oz
Ramp-up to sustainable production rate continues Production2 AISC2
2018 2018
throughout 2018
• Horizon 5 (H5) production expected in mid-2018
• Development in 2018 to add additional mining fronts based
on new sequence
• Strategic optimization of the mine plan through improved
sequencing and cut off grade analysis Ownership 100%
Location Quebec, Canada
Exploration development now in place to continue P&P gold reserves1 3.8 moz
testing deposit extensions at depth M&I gold resources1 1.3 moz
Inferred gold resources1 2.0 moz
2018 exploration budget2 $10 M
2018 capital budget2 $70 M
1 As of June 30, 2017. Refer to the reserve and resource statement on Goldcorp’s website for more details
2 Guidance figures are +/- 5%. See appendix C for pricing assumptions and footnotes
16Porcupine – Building a New Future for the Camp
Sustained productivity improvement at Hoyle Pond
• Hoyle Pond – 1,300 ore tonnes per day 275koz $925/oz
• Development averaging 30 meters per day Production2 AISC2
2018 2018
• Hollinger – achieving 30,000 tonnes per day (Ore and Waste)
Borden
• Commercial production expected in Q3 2019
• Expected to contribute to one-third of Porcupine gold
production by 2020 Ownership 100%
Century Location Ontario, Canada
• Complete optimization of base case pre-feasibility study in P&P gold reserves1 8.1 moz
2018, progress to feasibility study M&I gold resources1 8.4 moz
Exploration Inferred gold resources1 3.7 moz
• Prospectivity study re-invigorates Timmins district 2018 exploration budget $15M
2018 capital budget2 $175M
1 As of June 30, 2017. Refer to the reserve and resource statement on Goldcorp’s website for more details
2 Guidance figures are +/- 5%. See appendix C for pricing assumptions and footnotes
17Century – Optimization Underway, 2018 – 2020 Overview
• 2018 – Complete infill drilling campaign to convert a
portion of in-pit inferred resources (1Moz); Continue
trade-off studies and PFS optimization - budgeted cost of
$15 million
• Optimization trade-off studies of modern technologies: Base Case Pre-Feasibility Study
• Reduce project footprint Mine Life 14 years
• Improve mining and processing efficiencies Contained Gold Reserves 5.7 moz
• Optimize capital and operating costs
Plant Size 50,000 t/d
Gold Grade (diluted) 0.87 g/t
• 2019 – Complete feasibility study; Continue engaging
with key government authorities and stakeholders for Gold Recovery 88%
permitting / Environment Assessment (EA). Strip Ratio (waste to ore) 4.5:1
Operating Costs US$17 to US$18/t processed
• 2020 – Initiate detailed engineering and prepare
applications for critical permits; EPCM to be initiated Initial Capex US$950 to US$1,050 million
upon EA approval
Sustaining Capital & Tailings Expansion US$350 to US$400 million
18Musselwhite - Transitioning to the Next Generation
Materials Handling Project on schedule and below
budget 265koz $775/oz
• Ore tonnage movement restricted to 3,600 tonnes per day Production2 AISC2
until winze online, expanding to 4,300 tonnes per day 2018 2018
thereafter
Investing in technology to improve efficiencies and
further reduce costs
Ownership 100%
• Tele-remote mucking, dispatch, autonomous drilling
Location Ontario, Canada
P&P gold reserves1 1.9 moz
Consistently replacing mine reserves and discovering
M&I gold resources1 0.3 moz
new mineralization
Inferred gold resources1 1.2 moz
• Cost of discovery under $25/oz
2018 exploration budget2 $10 M
• Potential for resource growth
2018 capital budget2 $75 M
1 As of June 30, 2017. Refer to the reserve and resource statement on Goldcorp’s website for more details
2 Guidance figures are +/- 5%. See appendix C for pricing assumptions and footnotes
19Red Lake - Transitioning for a Sustainable Future
Adjusting the cost structure to the current reality of a
lower grade ore body
235koz $1,000/oz
Production2 AISC2
2018 2018
Transitioning from cut-and-fill mining to longhole
mechanized mining and focus on innovation and
automation
Developing Cochenour starter mine for full production Ownership 100%
in 2019
Location Ontario, Canada
• 2018 focus: Level sill development, mine infrastructure
(pastefill / material movement / vent raises) and exploration P&P gold reserves1 2.2 moz
platforms M&I gold resources1 2.7 moz
Inferred gold resources1 4.4 moz
Advancing HG Young to pre-feasibility stage
2018 exploration budget2 $30 M
• Access development and exploration drill platforms on 14 and
21 level as part of the Concept Study 2018 capital budget2 $100 M
1 As of June 30, 2017. Refer to the reserve and resource statement on Goldcorp’s website for more details
2 Guidance figures are +/- 5%. See appendix C for pricing assumptions and footnotes
20Coffee - Advancing Development of a New Mine
Entry into a prospective new district
• Advancing towards production in 2021
• Environmental Socioeconomic Assessment application re-
submitted with First Nations support
• Advancing First Nation Agreement negotiations
• Finalized EPC Agreement
• Federal and Territorial support through C$360M infrastructure
program
Ownership 100%
Location Yukon, Canada
Exploration success looking ‘Beyond 20/20’ P&P gold reserves1 2.16moz
• Large and underexplored land package (+60,000 hectares) with M&I gold resources1 0.78moz
camp scale potential Inferred gold resources1 1.2moz
• 70,000m of drilling completed in 2017 2018 exploration budget2 $15M
• Three new satellite deposits discovered
• Additional positive drill results identified over 1.5 km of strike length
at AmeriKona
1 As of June 30, 2017. Refer to the reserve and resource statement on Goldcorp’s website for more details
1 Guidance
2 figures are +/- 5. See appendix C for pricing assumptions and footnotes
21Coffee Project Schedule
2017 2018 2019 2020 2021 2022
Q2 Q3 Q4 Q1 Q2 Q3 Q4 Q1 Q2 Q3 Q4 Q1 Q2 Q3 Q4 Q1 Q2 Q3 Q4 Q1 Q2 Q3 Q4
YESAB Assessment
Permit Road
Permit Mine
Build Road
Early Works
First
Full Project Execution
Gold
• Project assessment • Project assessment • Water Use License • Construction and
(YESAB) (YESAB) preparation for
• Engineering & commercial production
• Engineering • Licensing procurement
• Exploration
• FN consultation and • Engineering & • First Nation
negotiations Procurement consultation
• New camp & site • First Nation • Site construction
infrastructure consultation begins
improvements
• Road construction • Exploration
• Exploration
• Exploration
22TOGETHER, CREATING SUSTAINABLE VALUE
23
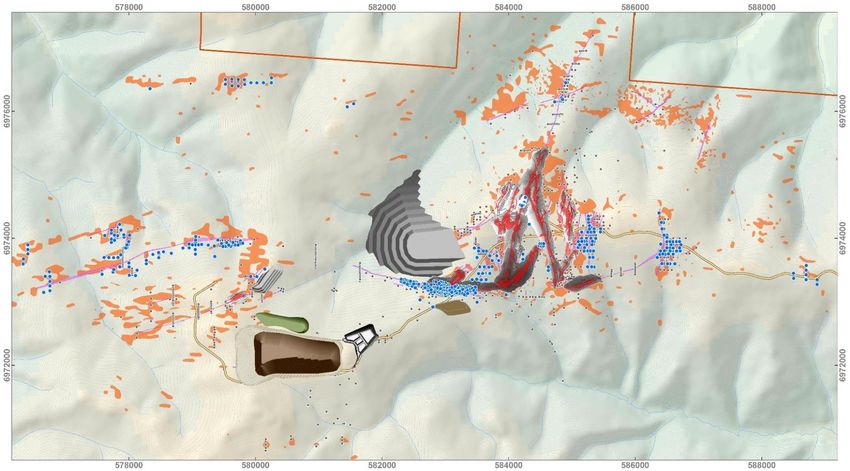
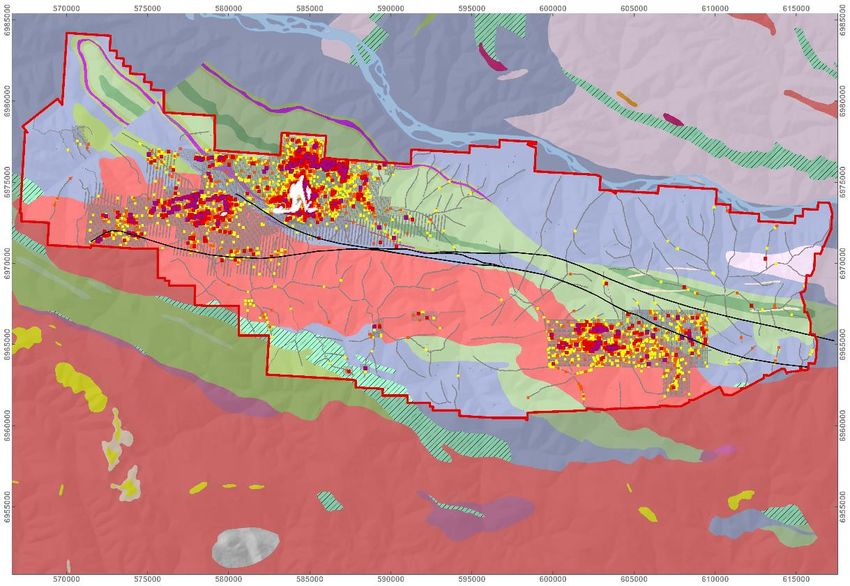
Property Geology and Exploration
• 70,000 metres drilled 2017
• Broad range of exploration targets drilled
from greenfields to advanced
Coffee Reserve
• New discoveries at AmeriKona, Decaf and
Kazaar
• Infill drilling generates new deposits
Coffee Property
• Arabica, T8-9 and Supremiato
• Infill drilling to upgrade resources
• Updated reserves and resources coming in
Q1 2018
• Drill hole spacing study underway
Coffee Creek - Biotite monzogranite Coffee Property Auppb in soils
>180
• Generative programs delivering new
Sulphur Ck - Qtz/felds/biotite schist Proposed pit 60-180
30-60
exploration opportunities
Biotite Qtz monzonite gneiss Exploration Targets 15-30
0-15
• Soil geochemistry, geophysics, and
Klondike - Qtz muscovite chl schist Coffee Creek Fault prospectivity analysis
0 5 10
Snowcap - Calcareous schist km
23Coffee Project: Adding Resources and New Discoveries
Kazaar
Supremiato
West Coffee East Coffee
Supremo
T8-9 Arabica
Americano AmeriKona
Decaf
Kona North
Kona Double Double
Latte
Espresso
New deposits Drilling 2017 >30 ppb Au in soils
New discoveries Drilling 2010-2016 Mineral reserve &
planned pit shell
Resource Definition 0 1000 2000
Meters
24Beyond 20/20 – The Next Generation of Mines
Beyond 20/20
Century
Opportunities for Norte Abierto
Organic Growth
Cerro Negro
NuevaUnión Coffee
252018 Milestones
Deliverable Target Date
2017 production and 2018 guidance Q1 2018
NuevaUnión pre-feasibility study completion Q1 2018
Coffee updated reserves & resources Q2 2018
Completion of $250M sustainable efficiency program Mid-2018
Éléonore ramp-up: Horizon 5 Q2 2018
Cerro Negro ramp-up: Mariana Norte first production mining Q3 2018
Mineral reserves and resources annual update Q4 2018
Century completion of optimized pre-feasibility study Q4 2018
Peñasquito PLP completion Q4 2018
Cerro Negro expansion studies Q4 2018
26Goldcorp Advantage
• 20/20/20 plan delivering increase
in margins and returns
Positioned to
• Efficiency initiatives on track to
Deliver deliver $250 million per annum by
2018
Increasing
• ‘Beyond 20/20’ - Plan to grow in
Shareholder reserves and production in an
Value industry with declining reserves
and production
27APPENDIX A: 2018 SENSITIVITIES
Base Change Operating Cash All-In Sustaining
Price Increments Flow per Share1 EBITDA1 ($M) Costs ($/oz)1
Gold price ($/oz) $1,300 $100 $0.26 $240 $1
Silver price ($/oz) $19.00 $3.00 $0.08 $74 $30
Zinc price ($/lb) $1.30 $0.10 $0.04 $32 $12
Lead price ($/lb) $1.10 $0.10 $0.02 $17 $6
Canadian dollar $1.25 10% $0.10 $84 $43
Mexican peso $19.00 10% $0.04 $33 $13
1 Refer to Appendix C for footnotes
28APPENDIX B: 2018 PRODUCTION COSTS
Consolidated Canada Latin Associates and
America Joint Ventures
6%
5%
3% 27% 4% 5% 7% 7%
3% 5% 19% 6% 18%
2% 1% 4% 2%
42% 2% 1%
14%
15% 17%
13%
22% 16%
7%
5% 15% 8%
3% 9% 9%
9% 17% 6% 13%
19%
7%
7%
Labour Contractors
Fuel Costs Power
Maintenance Parts Consumables
Tires Explosives
Site Costs Others
29APPENDIX C: FOOTNOTES
Note 1: Guidance projections used in this document (“Guidance”) are considered “forward-looking statements” and represent management’s good faith estimates or expectations of future production results as of the
date hereof. Guidance is based upon certain assumptions, including, but not limited to, metal prices, oil prices, certain exchange rates and other assumptions. 2018-2019 guidance assumes Au=$1,300/oz,
Ag=$19.00/oz, Cu=$2.75/lb, Zn=$1.30/lb, Pb=$1.10/lb, $1.25 CAD/USD, 19.00 MXN/USD. 2020-2021 guidance assumes Au=$1,300/oz, Ag=$18.00/oz, Cu=$3.00/lb, Zn=$1.15/lb, Pb=$1.00/lb, $1.25 CAD/USD, 19.00
MXN/USD. Such assumptions may prove to be incorrect and actual results may differ materially from those anticipated. Consequently, Guidance cannot be guaranteed. As such, investors are cautioned not to place
undue reliance upon Guidance and forward-looking statements as there can be no assurance that the plans, assumptions or expectations upon which they are placed will occur.
Note 2: Non-GAAP performance measures including adjusted operating cash flow, adjusted EBITDA, adjusted net debt, by-product cash costs and AISC are calculated on an attributable (or Goldcorp’s share) basis.
Attributable performance measures include the Company’s mining operations and projects, and the Company’s share of Pueblo Viejo, Alumbrera, Leagold and NuevaUnión. The Company believes that disclosing
certain performance measures on an attributable basis is a more relevant measurement of the Company’s operating and economic performance, and reflects the Company’s view of its core mining operations. The
Company believes that, in addition to conventional measures prepared in accordance with GAAP, the Company and certain investors use this information to evaluate the Company’s performance and ability to generate
cash flow; however, these performance measures do not have any standardized meaning. Accordingly, it is intended to provide additional information and should not be considered in isolation or as a substitute for
measures of performance prepared in accordance with GAAP.
Note 3: The Company’s projected all-in sustaining costs are not based on GAAP total production cash costs, which forms the basis of the Company’s by-product cash costs. The projected range of all-in sustaining
costs is anticipated to be adjusted to include sustaining capital expenditures, corporate administrative expense, exploration and evaluation costs and reclamation cost accretion and amortization, and exclude the effects
of expansionary capital, tax payments, dividends and financing costs. Projected GAAP total production cash costs for the full year would require inclusion of the projected impact of future included and excluded items,
including items that are not currently determinable, but may be significant, such as sustaining capital expenditures, reclamation cost accretion and amortization and tax payments. Due to the uncertainty of the likelihood,
amount and timing of any such items, we do not have information available to provide a quantitative reconciliation of projected all-in sustaining costs to a total production cash costs projection.
Note 4: AISC include total production cash costs incurred at the Company’s mining operations, which forms the basis of the Company’s by-product cash costs. Additionally, the Company includes sustaining capital
expenditures, corporate administrative expense, mine-site exploration and evaluation costs, and reclamation cost accretion and amortization. The measure seeks to reflect the full cost of gold production from current
operations, therefore growth capital and non-sustaining expenditures are excluded. Certain other cash expenditures, including tax payments, dividends and financing costs are also excluded.
AISC is a non-GAAP performance measure that the Company believes more fully defines the total costs associated with producing gold; however, this performance measure has no standardized meaning. Accordingly,
it is intended to provide additional information and should not be considered in isolation or as a substitute for measures of performance prepared in accordance with GAAP. The Company reports this measure on a gold
ounces sold basis. The Company’s all-in sustaining cost definition conforms to the guidance note released by the World Gold Council, which became effective January 1, 2014. The World Gold Council is a non-
regulatory market development organization for the gold industry whose members comprise global senior gold mining companies.
Note 5: Sustaining capital expenditures are defined as those expenditures which do not increase annual gold ounce production at a mine site and excludes all expenditures at the Company’s projects and certain
expenditures at the Company’s operating sites which are deemed expansionary in nature.
30APPENDIX C: FOOTNOTES Note 6: Net Debt, Adjusted Net Debt, EBITDA, Adjusted EBITDA and Adjusted Net Debt/Adjusted EBITDA are non-GAAP performance measures. Accordingly, they are intended to provide additional information and should not be considered in isolation or as a substitute for measures of performance prepared in accordance with GAAP and they have no standardized meaning. Adjusted net debt is calculated, on an attributable basis, to include the Company’s share of Pueblo Viejo, Alumbrera, Leagold and NuevaUnión by adding short-term and long-term debt less cash and cash equivalents and short-term investments. EBITDA is calculated, on an attributable basis, to include the Company’s share of Pueblo Viejo, Alumbrera, Leagold and NuevaUnión as net earnings (loss) before taxes, depreciation and depletion, finance income and finance costs. Adjusted EBITDA also removes the effect of impairment charges and reversals and income (loss) from discontinued operations. Management uses Earnings before interest, taxes and depreciation and amortization (“EBITDA”) and EBITDA adjusted for certain items that do not represent continuing results for a particular period (“Adjusted EBITDA”) as non-GAAP measures to evaluate the Company’s operating performance. EBITDA and Adjusted EBITDA do not represent, and should not be considered an alternative to, net income (loss), operating income (loss), or cash flow from operations as those terms are defined by GAAP, and do not necessarily indicate whether cash flows will be sufficient to fund cash needs. Although Adjusted EBITDA and similar measures are frequently used as measures of operations and the ability to meet debt service requirements by other companies, our calculation of Adjusted EBITDA is not necessarily comparable to such other similarly titled captions of other companies. The Company believes that Adjusted EBITDA provides useful information to investors and others in understanding and evaluating our operating results in the same manner as our management and board of directors. Management’s determination of the components of Adjusted EBITDA are evaluated periodically and based, in part, on a review of non-GAAP financial measures used by mining industry analysts. Net earnings (loss) attributable to Goldcorp Inc. shareholders is reconciled to EBITDA and Adjusted EBITDA as follows: 31
APPENDIX D: RESERVE & RESOURCE REPORTING NOTES

 Cautionary Note Regarding Reserves and Resources:

 Scientific and technical information contained on this website was reviewed and approved by Ivan Mullany, FAusIMM, Senior Vice President, Technical Services for Goldcorp, and a “qualified person” as defined by
 National Instrument 43-101 – Standards of Disclosure for Mineral Projects (“NI 43-101”). Scientific and technical information in this presentation relating to exploration results was reviewed and approved by Sally
 Goodman, PhD, P.Geo., Director, Generative Geology for Goldcorp, and a "qualified person" as defined by NI 43-101. All Mineral Reserves and Mineral Resources have been estimated in accordance with the
 standards of the Canadian Institute of Mining, Metallurgy and Petroleum ("CIM") and NI 43-101, or the Australasian Code for Reporting of Exploration Results, Mineral Resources and Ore Reserves equivalent
 (“JORC”). All Mineral Resources are reported exclusive of Mineral Reserves. Mineral Resources that are not Mineral Reserves do not have demonstrated economic viability. Information on data verification
 performed on the mineral properties mentioned in this table that are considered to be material mineral properties to the Company are contained in Goldcorp’s annual information form for the year ended December
 31, 2016 and the current technical report for each of those properties, all available at www.sedar.com.

 The Mineral Resource and Mineral Reserve estimates contained in this presentation have been prepared in accordance with the requirements of Canadian securities laws, which differ from the requirements of
 United States securities laws and uses terms that are not recognized by the SEC. Canadian reporting requirements for disclosure of mineral properties are governed by the Canadian Securities Administrators’ NI
 43-101. The definitions used in NI 43-101 are incorporated by reference from the Canadian Institute of Mining, Metallurgy and Petroleum (“CIM”) — Definition Standards adopted by CIM Council on May 10, 2014
 (the “CIM Definition Standards”). U.S. reporting requirements are governed by the SEC Industry Guide 7 (“Industry Guide 7”) under the United States Securities Act of 1933, as amended. These reporting
 standards have similar goals in terms of conveying an appropriate level of confidence in the disclosures being reported, but embody different approaches and definitions. For example, the terms “Mineral Reserve”,
 “Proven Mineral Reserve” and “Probable Mineral Reserve” are Canadian mining terms as defined in NI 43-101, and these definitions differ from the definitions in Industry Guide 7. Under Industry Guide 7 standards,
 a “final” or “bankable” feasibility study is required to report reserves and the primary environmental analysis or report must be filed with the appropriate governmental authority. Further, under Industry Guide 7,
 mineralization may not be classified as a “reserve” unless the determination has been made that the mineralization could be economically and legally produced or extracted at the time the reserve determination is
 made.

 While the terms “Mineral Resource”, “Measured Mineral Resource”, “Indicated Mineral Resource” and “Inferred Mineral Resource” are defined in and required to be disclosed by NI 43-101, these terms are not
 defined terms under Industry Guide 7 and are normally not permitted to be used in reports and registration statements filed with the SEC. United States readers are cautioned not to assume that any part or all of
 mineral deposits in these categories will ever be converted into reserves. In addition, “Inferred Mineral Resources” have a great amount of uncertainty as to their existence and their economic and legal feasibility. A
 significant amount of exploration must be completed in order to determine whether an Inferred Mineral Resource may be upgraded to a higher category. Under Canadian regulations, estimates of Inferred Mineral
 Resources may not form the basis of feasibility or pre-feasibility studies, except in rare cases. United States readers are cautioned not to assume that all or any part of an Inferred Mineral Resource exists or is
 economically or legally mineable. Disclosure of “contained ounces” in a resource is permitted disclosure under Canadian regulations if such disclosure includes the grade or quality and the quantity for each category
 of Mineral Resource and Mineral Reserve; however, the SEC normally only permits issuers to report mineralization that does not constitute “reserves” by SEC standards as in place tonnage and grade without
 reference to unit measures.

 Accordingly, information contained in this presentation containing descriptions of the Company’s mineral deposits may not be comparable to similar information made public by United States companies subject to
 the reporting and disclosure requirements under the United States federal securities laws and the rules and regulations thereunder.

32
APPENDIX E: 2017 PRODUCTION, 2018 GUIDANCE
2017 2018 Guidance
Gold Gold Capital Expenditure
Mine Production1 (oz) Production1 (oz) AISC1 ($/oz) Sustaining1 Growth1 Exploration1
Peñasquito 476,000 310,000 $250 $220M $335M $5M
Cerro Negro 452,000 490,000 $600 $55M $75M $20M
Pueblo Viejo 433,000 415,000 $600 $70M $0 $0
Éléonore 305,000 360,000 $900 $40M $30M $10M
Red Lake 209,000 235,000 $1,000 $50M $50M $30M
Porcupine 272,000 275,000 $925 $55M $120M $15M
Musselwhite 236,000 265,000 $775 $40M $35M $10M
Other 186,000 100,000 $1,000 $20M $105M $35M
Consolidated 2,569,000 2,500,000 (+/- 5%) $800 (+/- 5%) $550M $750M $125M
Consolidated by-product costs1 $450 (+/- 5%)
1 Refer to Appendix C for footnotes
33APPENDIX E: 2018 GUIDANCE (cont’d)
20/20/20 Plan
Gold Production1 (oz) AISC1 ($/oz) By-product1 ($/oz) Capital Expenditure1 (+/- 5%)
Year
(+/- 5%) (+/- 5%) (+/- 5%) Sustaining Growth2
2018E 2,500,000 $800 $450 $550M $750M
2019E 2,700,000 $750 $400 $575M $250M
2020E 3,000,000 $700 $400 $575M $300M
2021E 3,000,000 $700 $400 $575M $300M
1 Refer to Appendix C for footnotes
2 Growth capital includes capital for those projects which are in execution and/or have an approved Feasibility Study. Other projects only include capital to progress to the next Stage Gate.
34www.goldcorp.com
facebook.com/Goldcorp
@Goldcorp_Inc
linkedin.com/company/goldcorp-inc
youtube.com/user/GoldcorpInc
Trading Symbols | NYSE: GG; TSE: G
Investor Relations | 1-800-567-6223 | info@goldcorp.comYou can also read