2017 Results and 2018 Operating Plan - FEBRUARY 21, 2018 PREMIER OPERATOR OF TOP TIER ASSETS - Criterion Research
←
→
Page content transcription
If your browser does not render page correctly, please read the page content below
2017 Results and
2018 Operating Plan
FEBRUARY 21, 2018
PREMIER OPERATOR OF TOP TIER ASSETS

                                      1
Please Read This presentation makes reference to:
Forward-looking statements
This presentation contains forward-looking statements within the meaning of securities laws. The words “anticipate,” “assume,” “believe,” “pending,” “budget,”
“estimate,” “expect,” “forecast,” “guidance,” “intend,” “plan,” “project,” “will” and similar expressions are intended to identify forward-looking statements. These
statements involve known and unknown risks, which may cause SM Energy's actual results to differ materially from results expressed or implied by the forward-
looking statements. Forward-looking statements in this presentation include, among other things, full year 2018 guidance, first quarter of 2018 guidance,
expectations concerning the planned closing of a previously announced divestiture, expectations about future cost inflation, and the expected benefits from
joint venture arrangements. General risk factors include the availability of and access to capital markets; the availability, proximity and capacity of gathering,
processing and transportation facilities; the volatility and level of oil, natural gas, and natural gas liquids prices, including any impact on the Company’s asset
carrying values or reserves arising from price declines; uncertainties inherent in projecting future rates of production or other results from drilling and
completion activities; the imprecise nature of estimating oil and natural gas reserves; uncertainties inherent in projecting future drilling and completion activities,
costs or results, including from pilot tests; the uncertainty of negotiations to result in an agreement or a completed transaction (including any delay in closing
our announced PRB divestiture as a result of litigation); uncertainties inherent in projecting the timing and ultimate outcome of litigation; the uncertain nature of
acquisition, divestiture, joint venture, farm down or similar efforts and the ability to complete any such transactions; the uncertain nature of expected benefits
from the actual or expected acquisition, divestiture, drilling carry, farm down or similar efforts; the availability of additional economically attractive exploration,
development, and acquisition opportunities for future growth and any necessary financings; unexpected drilling conditions and results; unsuccessful exploration
and development drilling results; the availability of drilling, completion, and operating equipment and services; the risks associated with the Company's
commodity price risk management strategy; uncertainty regarding the ultimate impact of potentially dilutive securities; and other such matters discussed in the
“Risk Factors” section of SM Energy's 2017 Annual Report on Form 10-K, as such risk factors may be updated from time to time in the Company's other
periodic reports filed with the Securities and Exchange Commission. The forward-looking statements contained herein speak as of the date of this
announcement. Although SM Energy may from time to time voluntarily update its prior forward-looking statements, it disclaims any commitment to do so except
as required by securities laws.

            Non-GAAP financial measures: See Appendix for reconciliations

           Reserves and resources: See Appendix for disclosure statement

            Non-GAAP forward looking metrics: See Appendix for definitions

                                                                                                                                                                    2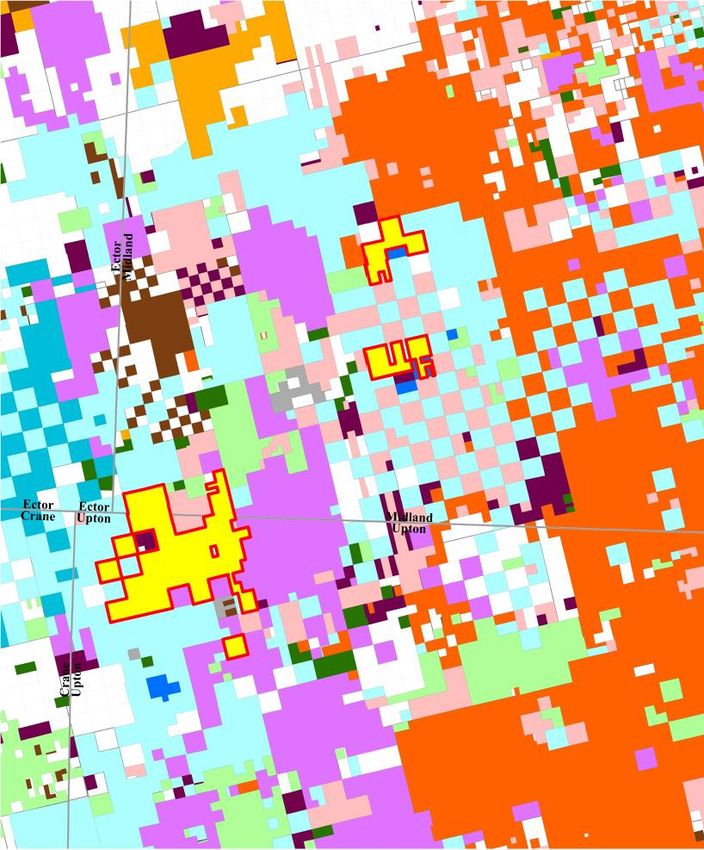
2017 – 2019 Driving Differential Value
Measuring returns: cash flow growth per debt adjusted share(1)

 “Cash flow growth per debt adjusted share is the metric with the highest
 correlation to intra sector relative performance”
                                                – Credit Suisse 12/11/17(2)

 Premier Operator

                    +                                           =              ~35%
    Top Tier assets                                                      Cash Flow Growth
                                                                     per Debt Adjusted Share(1)

 (1) See Appendix for Cash Flow per Debt Adjusted Share definition
 (2) William Featherston/Betty Jiang, Credit Suisse                                               3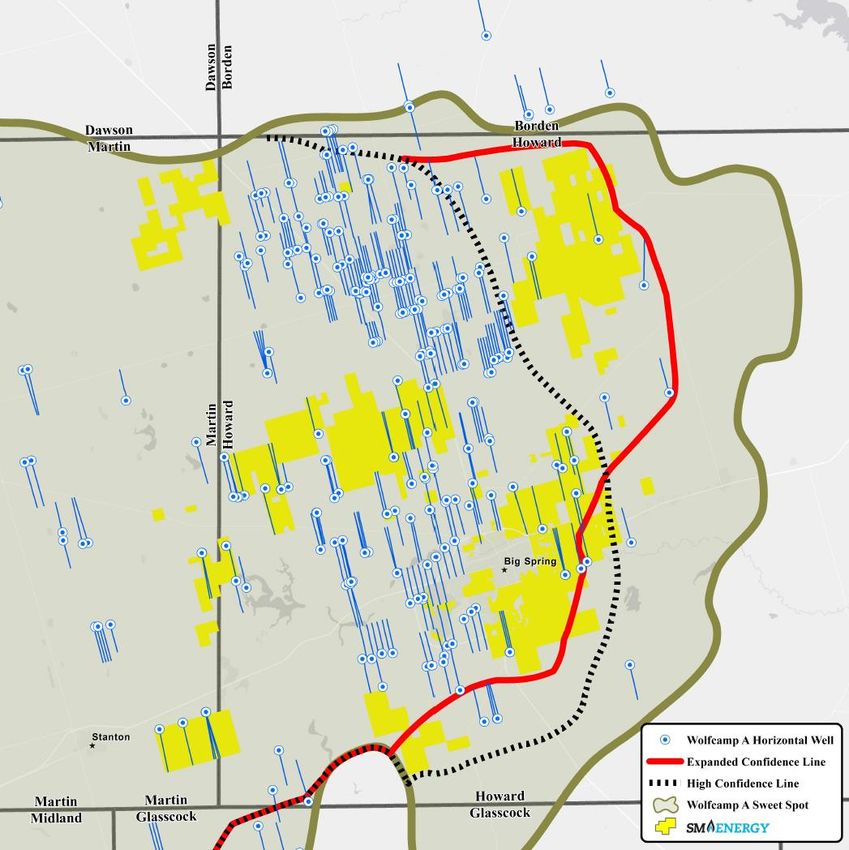
Premier Operator of Top Tier Assets
2017 marked by outstanding execution

        “Top operator…SM ranks #1 in
                                                                                                            “Key differentiator is
        the Midland Basin on a
                                                                                                            Howard County acreage”
        revenues per lateral foot basis”
                                                                                                                      - Deutsche Bank(2)
                     - Baird(1)

                 Midland Basin                                           Increased average                                       Raised cash operating
              production growth(3)                                      lateral feet per well(4)                                       margin(3)

                   165%                                                    ~1,200                                                     48%

                                             Increased proved                                            Increased PV-10(6)
                                                 reserves(5)

                                                  47%                                                           2.5x
 (1)   Baird 12/18/17 – Joseph Allman       (4) 2017 average lateral feet compared to acquisition assumptions
 (2)   Deutsche Bank 2/1/18 – Nitin Kumar   (5) 2017/2016; retained assets                                                                               4
 (3)   4Q17/4Q16                            (6) See Appendix for reconciliation of PV-10 (Non-GAAP) to Standardized Measure (GAAP)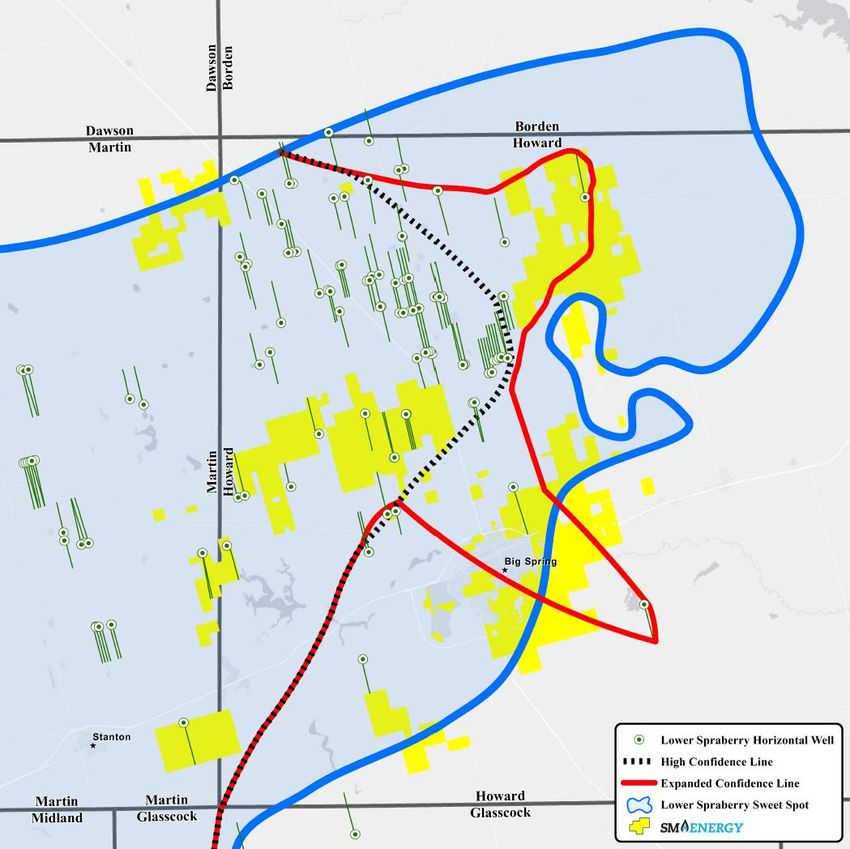
2018-2019

            Plan Overview
             & Guidance

                            5
2018 – 2019 Plan Highlights
Big cash flow growth per debt adjusted share – near 35% projected CAGR
► Expected to nearly double cash flow per debt adjusted share in two years
► Expected to cut Net Debt : TTM EBITDAX by approximately 1.5 turns

             $4.00                                                                                                6

                                                                                                                      Net Debt : TTM EBITDAX
                 per Net Debt Adjusted Share

                                                                                                                  4
     Cash Flow

             $2.00

                                                                                                                  2

             $0.00                                                                                                0
                                               2017                          2018e                     2019e
                                                                                   (1)
                                               Cash Flow per Net Debt Adjusted Share     Net Debt : TTM EBITDAX

  (1) See Appendix for Cash Flow per Debt Adjusted Share definition
  (2) Net Debt : TTM EBITDAX: see Appendix for definition.                                                                                     6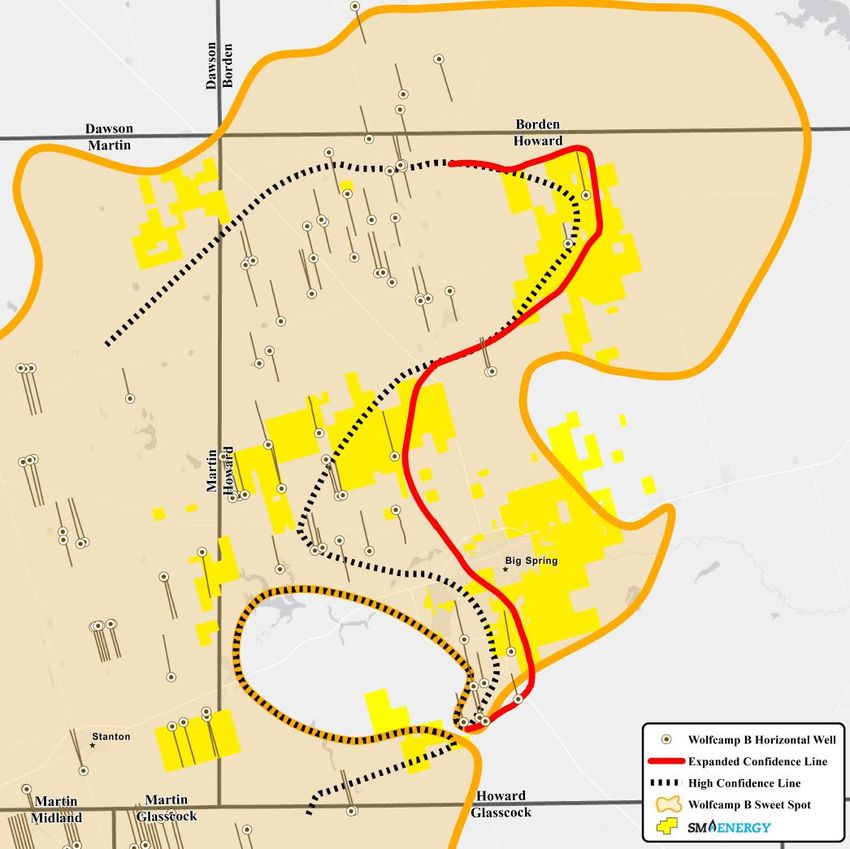
2018 – 2019 Plan Highlights
Big Midland production growth driving expected margin expansion
► Midland projected production growth up ~135% 2017-2019
► Company projected cash operating margin up over 45% 2017-2019
                      60,000                                                                                                                        $22

                      50,000

                                                                                                                                                            Cash Operating Margin
                      40,000
Production
             (MBoe)

                                                                                                                                                                                    $/Boe
                      30,000                                                                                                                        $16

                      20,000

                      10,000

                            0                                                                                                                       $10
                                                2017                                2018e                                   2019e
                                                                                                                                                          (1)
                                Midland Basin             Eagle Ford              Rockies             Sold/Pending Sale               Operating Margin

                      (1) Realized price before the effect of hedges (2018e: current strip pricing through 1Q18 and $55/$3 for remainder of 2018;
                          price normalized for 2019e) less LOE, ad valorem, transportation, production taxes, and cash G&A.
                                                                                                                                                                                            7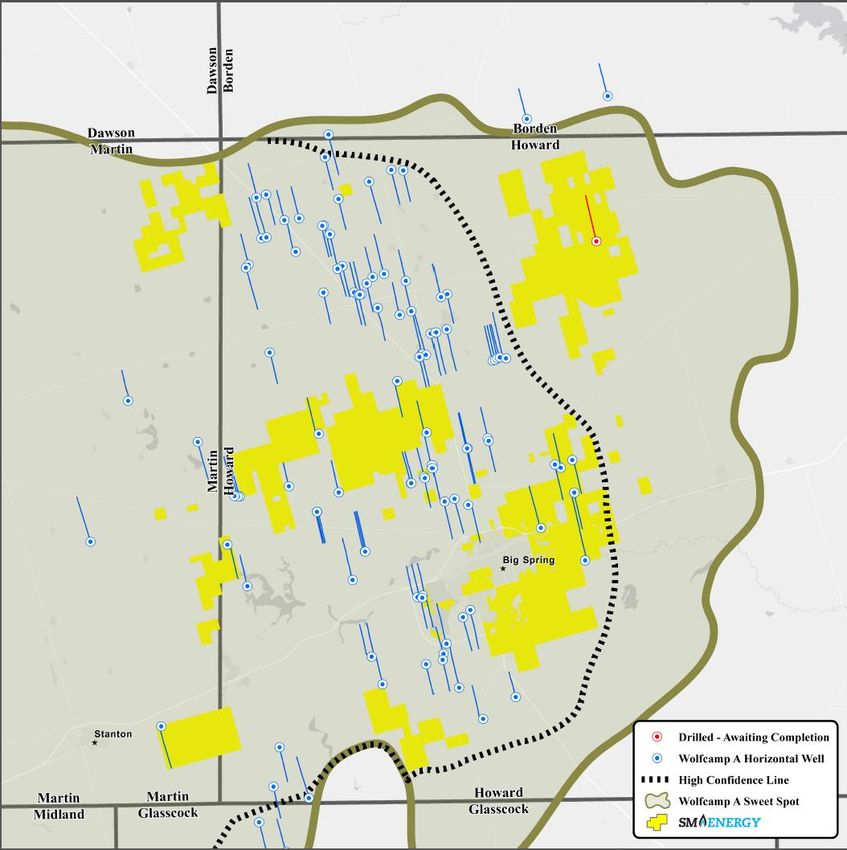
SM Energy A Premier Operator of Top Tier Assets
Objective: to deliver long-term growth in cash flow per debt adjusted share

                    2 Year Plan Expected Outcomes:

          Big growth in         Cash flow                Net
          high-margin          neutrality by        Debt:EBITDAX
           production            MY 2019            ~2.5x YE 2019

                             2018 Priorities:

          Operational         Reduce debt /            Focused
          excellence /         continue to         capital program
            capital              core up           to drive margin
           efficiency           portfolio             expansion

                                                                          8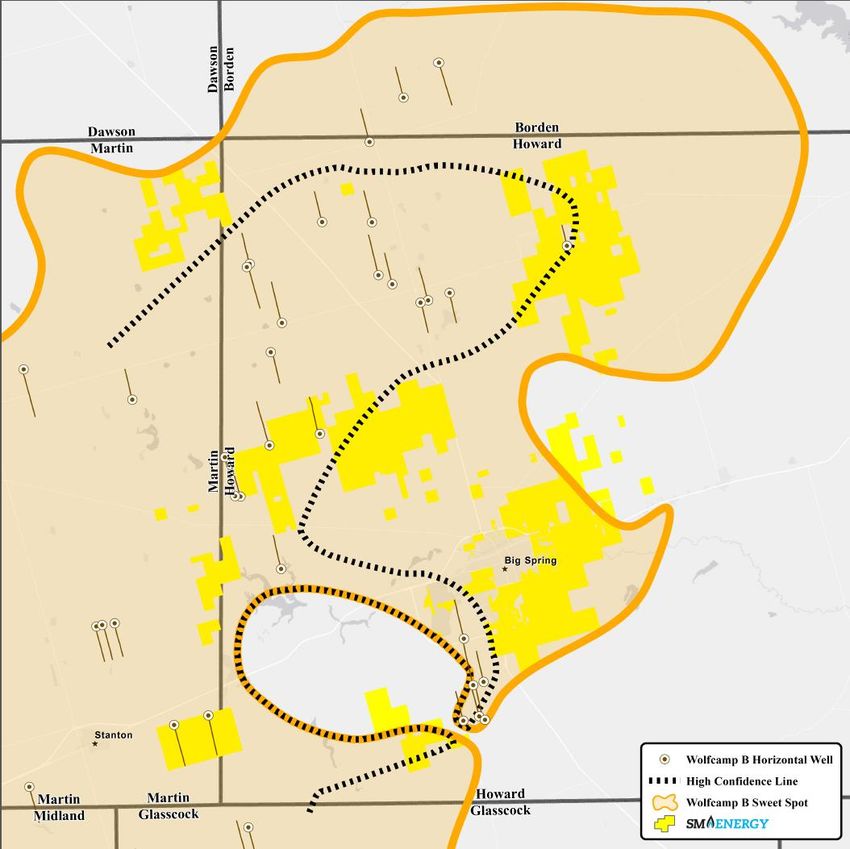
2018 Capital Program
Aggressive growth expected in the Midland Basin
             Total Capital Spend                                                                D&C Budget
                            ~$1.27B                                                                   ~$1.04B

                                                                                                                Eagle Ford
                                                                                                                   14%
                                                   Facilities
                                                     10%
              Drilling and                           Other(1)
              Completion                               8%
                  82%
                                                                                                 Midland
                                                                                                  Basin
                                                                                                   86%

► Currently running 9 rigs in Midland Basin; expected to decline to 7 rigs by year-end (expected
  average of 8 for full year); expected average 1 rig in Eagle Ford for full year

► Planning ~150 net wells drilled(2) and ~125 net completions(3)

► D&C budget assumes 10-15% cost inflation per lateral foot versus 2017 average

► Facilities expenditures include buildout of Midland water handling system for ~$70MM
  (1) Other includes exploration, allocated overhead, and land.                   (3) Expect to complete ~100 net wells in Midland and ~25 net
  (2) Expect to drill ~130 net wells in Midland and ~17 net wells in Eagle Ford       wells in Eagle Ford
                                                                                                                                                 9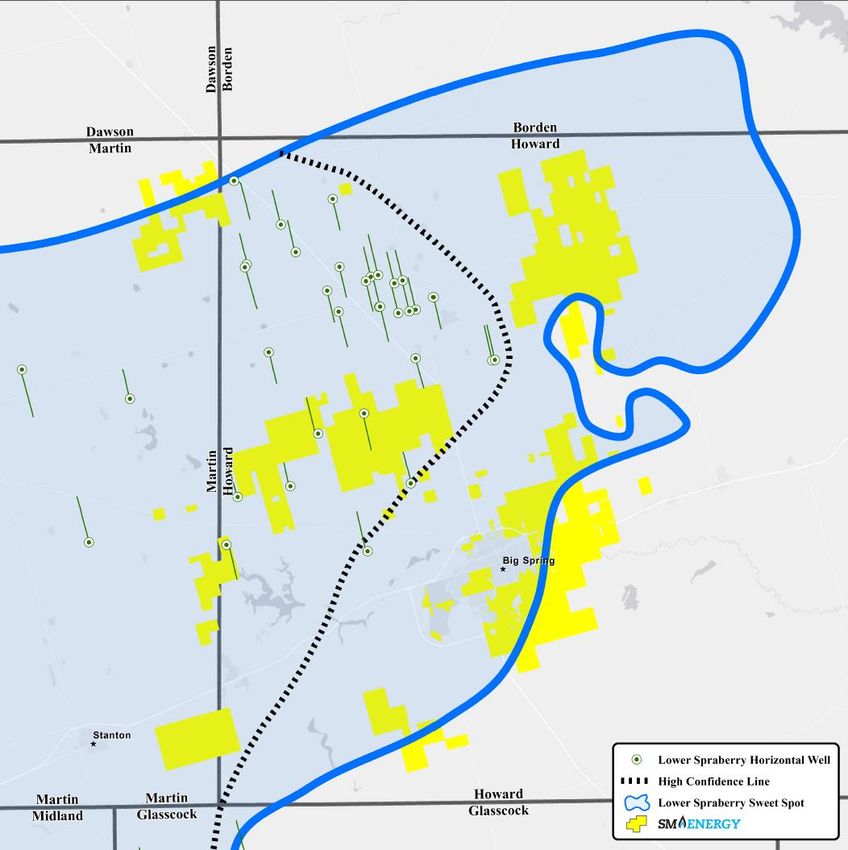
2018 Plan Guidance(1)
    Capital & Production                                         FY 2018
    Total Capital Spend ($MM)(2) (before acquisitions)                  ~$1,270
                                                                                                                           2018 Production Guidance
    Total Production (MMBoe)                                             42 - 46                                                  by Quarter
                                                                                                                    150
    Oil %                                                                  ~41%
                                                                                                                    125
    Costs

                                                                                               Production (Boe/d)
    LOE ($/Boe)                                                          ~$5.00                                     100

    Ad Valorem taxes ($/Boe)         Operated Eagle              $0.55 - $0.65                                       75
    Transportation ($/Boe)               Ford
                                                                         ~$4.50
                                          20%                                                                        50
    Production taxes ($/Boe)                                             ~$1.55
                                                                                                                     25
    G&A ($MM)                                                       $125 – 135
             – includes ~$20MM non-cash compensation
                                                                                                    0
    Capitalized Overhead/Exploration ($MM)                              $70 - 75                  86%                     1Q18e    2Q18e    3Q18e   4Q18e
             – before dry hole expense, all of which is                                           86%                                       8%
             included in capital expenditure guidance                                                                     Retained Assets    Pending Sale
    DD&A ($/Boe)                                              $13.00 - $15.00

    >     1Q18 production guidance 9.5 to 10.0 MMBoe

    >     LOE expected to exceed the average in 1H18 and be below the average in 2H18 as Permian costs are
          reduced with completion of water handling systems

    >     Transportation expense expected to decline sequentially through the year as higher cost Eagle Ford
          production is a reduced proportion of the commodity mix

 (1) As of February 21, 2018
 (2) Total Capital Spend is a non-GAAP financial measure. Please see the reconciliation of this measure in the Appendix.                                    10
2017
Reserves at Year-End
112017 Proved Reserves Additions and Revisions
► Proved reserves of retained assets up 47%
► Net proved reserve additions of 192MM Boe equaled 4.3 times production
► More than doubled proved reserve PV-10 to $3.1B(1)
500
7
450 23
14
Proved Reserves (MMBoe)
400
175
44
468
350
396
76
300
1
250
YE16 Production Divestitures Acquisitions Adds/ Aged Price Performance YE17
Proved Infills PUD's Revision Revision Proved
Reserves Reserves
192 MMBoe
► 46% Proved Developed
► 34% Oil, 46% Natural Gas, 20% NGLs
Note: Calculated in accordance with SEC Pricing at $51.34 per barrel of oil NYMEX, $3.00 per MMBtu of natural gas at Henry Hub and $27.69 per barrel of natural gas
liquids (“NGLs”) at Mt. Belvieu. 12
(1) See Appendix for reconciliation of PV-10 (Non-GAAP) to Standardized Measure (GAAP)2017 Proved Reserves By Region
Coring up the portfolio to top tier assets
YE 2016(1) (MMBoe) 228.9 53.0 36.3 318.2
Rocky
YE 2017 Eagle Ford Permian Total
Mountain
Oil (MMBbl) 13.3 117.5 27.4 158.2
Gas (Bcf) 998.1 252.8 29.2 1,280.1
NGL (MMBbl) 95.6 0.2 0.7 96.5
Total (MMBoe) 275.2 159.9 33.0 468.1
% Proved Developed 52% 34% 53% 46%
Reserve growth 20% 202% (9%) 47%
Permian proved reserves tripled to 160 MMBoe
Note: Proved reserves at year-end 2017 include approximately 4.2 MMBoe associated with the pending sale of certain Powder River Basin assets.
(1) Adjusted to show retained assets only 132018
Operations Plan
14Eagle Ford 2018 Plan Objectives
Value creation through better wells, longer laterals, and optimum number of wells per section
Eagle Ford
► Employ new technology and optimized spacing ~165,000 net acres
to drive improved well performance and cost
savings
Dimmit County
► Expect to drill ~17 net wells Webb County
> 2 rigs in 1Q18 to 1 in 2Q18
> Average lateral length increased to 9,300’ (from
6,500’ in 2017) North
Area
► Expect to complete ~25 net wells, optimize East
Area
completions
Mexico
> Average 1 completion crew
> Increase fracture injection points by decreasing South
Area
cluster spacing from 50 feet to 25 feet
► JV expected to drill and complete 16 North Area
wells testing new technology, improve capital
efficiency in the area, and increase asset value
► Test new intervals, including Austin Chalk
15Midland Basin 2018 Plan Objectives
Value creation through better wells, longer laterals, and increasing wells per section
Midland Basin
~88,000 net acres
► Initiate development stage in western
RockStar, continue delineation in RockStar
central Howard County
► Expect to drill ~130 net wells, optimize
landing zones
> 9 rigs in 1Q18 to 7 rigs at year-end
(average 8 for full year)
> 2 – 6 wells per pad
Sweetie
Peck
► Expect to complete ~100 net wells,
optimize completions
> Average 4 completion crews for full
year
Halff East
16Top Midland Basin Operator
SM Energy Ranks #1 in revenue per well and revenue per lateral foot
(1) Baird Equity Research 1/18/18 – Joseph Allman
17Premier Operator Permian
Top tier capital efficiency
Drilling Costs Completion Costs
800 12,000 1,200 3,000
Completion Cost Per Lateral Foot ($/ft)
Drilling Cost Per Lateral Foot ($/ft)
Proppant Per Lateral Foot (lb/ft)
700 10,500
1,000 2,500
Average Lateral Length (ft)
600 9,000
800 2,000
500 7,500
400 6,000 600 1,500
300 4,500
400 1,000
200 3,000
200 500
100 1,500
- - - -
2014 2015 2016 2017 2014 2015 2016 2017
Longer, faster and cheaper! Bigger, better and faster!
> Lateral lengths up 62% since 2014 > Stages per day up 71% since 2014
> Lateral Feet/Day up 171% since 2014 > Fluid per lateral foot up 55% since 2014
> $/Lateral Foot down 67% since 2014 > Sand per lateral foot up 24% since 2014
> Reduced stage spacing (200 to 167 ft/stage)
18Midland Basin Infrastructure Regional Sand Deal
Best in basin arrangement with US Silica and Sandbox Logistics
New sand mines
close to SM
locations ~55 miles(1)
~48 miles(1)
>$400K
expected capital Lamesa (3Q18)
savings per well Crane (1Q18)
(1) Road miles
19Midland Basin Infrastructure Water Management
Invest $70MM in fresh and produced water infrastructure
Expected cost
Accelerates System
savings
development control
(LOE + Capital)
20New Well Results
21New Well Results Howard County
Great results in multiple intervals across acreage position
Sundown 4566WB
Sundown 4524LS
Iceman 2-10A 1LS
Iceman 2-10A 2LS
Iceman 2-10A 3LS
Papagiorgio 33-40 B 1LS
Maverick 0341WA
Maverick 0361WB Fletch C 1352WA
Maverick 0342WA Fletch C 1368WB
Maverick 0321LS Fletch B 1351WA
Maverick 0322LS Fletch A 1350WA
Jester 2131LS
22Howard County New Well Results
Peak IP 24 Hour Clusters
Lateral IP per Proppant Oil
Well Name Interval Rate IP Days Peak IP Stages per
Length 1,000’ (lbs./ft) %
(BOE/d) Rate Stage
Maverick 0341WA(1) WCA 10,418 2,079 30-day 200 2,316 62 8 2,482 91
Maverick 0361WB(2) WCB 10,412 1,431 30-day 137 1,683 62 8 1,850 86
Maverick 0342WA(3) WCA 10,418 1,999 30-day 192 2,242 62 8 1,849 90
Fletch C 1352WA WCA 10,282 1,321 30-day 128 2,053 62 8 1,851 87
Fletch C 1368WB WCB 10,287 1,082 30-day 105 1,700 62 8 1,891 87
Fletch B 1351WA WCA 10,113 1,300 30-day 129 1,967 61 8 1,888 88
Fletch A 1350WA WCA 9,636 1,445 30-day 150 2,127 58 8 1,870 86
Sundown 4566WB WCB 10,336 1,035 30-day 100 1,435 83 8 1,966 91
Lower Spraberry
Iceman 2-10A 1LS LS 7,830 518 30-day 66 739 47 8 1,827 88
Iceman 2-10A 2LS LS 7,828 824 30-day 105 1,063 47 8 1,865 85
Iceman 2-10A 3LS LS 7,819 676 30-day 86 916 47 8 1,870 88
Papagiorgio 33-40 B 1LS LS 10,370 779 30-day 75 1,006 62 8 1,853 91
Jester 2131LS(4) LS 10,209 931 30-day 91 1,105 61 8 1,869 87
Maverick 0321LS(5) LS 10,419 1,048 30-day 101 1,194 62 8 1,849 88
Maverick 0322LS(6) LS 10,418 951 30-day 91 1,221 62 8 1,849 89
Sundown 4524LS LS 10,352 696 30-day 67 959 83 8 1,964 90
(1) Name changed from Maverick 09-03 A 1WA (4) Name changed from Jester 21-28 B 1LS
(2) Name changed from Maverick 09-03 A 1WB (5) Name changed from Maverick 09-03 A 1LS 23
(3) Name changed from Maverick 09-03 A 2WA (6) Name changed from Maverick 09-03 A 2LSHoward County Top Tier Well Performance Continues
New Wolfcamp wells continue outperformance trend
300,000
Gross Cumulative Production (BOE)
250,000
200,000
150,000
100,000
50,000
0
0 30 60 90 120 150 180 210 240 270 300 330 360
Days on Production
(1)
Previously Reported Well Avg New Well Avg(2) PEER 1MMBOE
Note: Monthly data normalized to days on production.
(1) Previously Reported Well Average includes all (19) previously reported SM operated wells on production since 11/3/2017.
(2) New Well Avg includes new Wolfcamp A and Wolfcamp B wells that have not been previously reported. 24Howard County Average Production by Formation
All intervals exceed peer 1 MMBoe type curve
300,000
Gross Cumulative Production (BOE)
250,000
200,000
150,000
100,000
50,000
0
0 50 100 150 200 250 300
Days on Production
WCA Average WCB Average LS Average PEER 1MMBOE
Note: Includes SM wells completed subsequent to 10/1/16.
25Differing Decline Characteristics of LS and WCA Wells
% of Peak Initial Production (IP) Rates vs Time, Jester and Papagiorgio Pads
Jester Pad Wells Papagiorgio Pad Wells
120% 120%
100% 100%
80% 80%
% of IP
% of IP
60% 60%
40% 40%
20% 20%
0% 0%
1
10
19
28
37
46
55
64
73
82
91
100
109
118
127
136
145
154
163
172
181
190
199
208
217
226
235
244
253
262
1
7
13
19
25
31
37
43
49
55
61
67
73
79
85
91
97
103
109
115
121
127
133
139
145
151
157
163
169
175
181
DAYS DAYS
JESTER WCA (BOPD/IP24HR) JESTER LS (BOPD/IP24HR) PAPAGIORGIO WCA (BOPD/IP24HR) PAPAGIORGIO LS (BOPD/IP24HR)
Lower Spraberry wells reach IP peak later but decline more slowly
26Inventory & Returns
27Howard County Wolfcamp A Evolution of SM Sweet Spot Mapping
January 2017 February 2018
Higginbotham Unit B 30-19 1AH Cassidy 26-23 1H
Tall City – 6,397’ Tall City – 7,314’
Hyden 47-38 WA 1H 24hrIP = 403 BOEPD
24hrIP = 398 BOEPD
Grenadier – 9,639’
24hrIP = 848 BOEPD Viper 14-9 1WA
SM – 10,422’
24hrIP = 1,316 BOEPD
Oldham Trust 40-25 WA 1H
Grenadier – 10,426’
24hrIP = 1,274 BOEPD
Thumper 14-23 1AH
Sabalo – 10,105’
24hrIP = 1,357 BOEPD
Midland 15-10 1WA
Hannathon – 7,726’
24hrIP = 1,259 BOEPD
Broughton Wise 18-19 WA 1H
Grenadier – 7,012’
24hrIP = 875 BOEPD
Morgan Ranch 38-47 1WA
Hannathon – 7,727’
24hrIP = 713 BOEPD
28Howard County Wolfcamp B Evolution of SM Sweet Spot Mapping
January 2017 February 2018
Sundown 4566WB
SM – 10,336’
24hrIP = 1,435 BOEPD
Prichard J 10BH
Legacy – 7,644’
24hrIP = 602 BOEPD
Maverick 0361WB
SM – 10,412’
24hrIP = 1,683 BOEPD Prichard J 9BH
Legacy – 7,641’
24hrIP = 655 BOEPD
International Unit 9H
Callon – 7,579’
24hrIP = 887 BOEPD
Fletch C 1368WB
SM – 10,287’
24hrIP = 1,700 BOEPD
Tubb 1WA
Crownquest – 9,873’
24hrIP = 1,178 BOEPD
29Howard County Lower Spraberry Evolution of SM Sweet Spot Mapping
January 2017 February 2018
Sundown 4524 LS
Moby Dick 31-30 8SH
SM – 10,352’
Surge – 7,362’
24hrIP = 959 BOEPD
24hrIP = 319 BOEPD
Mr. Phillips 11-2 1SH
Sabalo – 10,047’
24hrIP = 1,032 BOEPD
Papagiorgio 33-40 B1LS
SM – 10,370’
24hrIP = 1,006 BOEPD
Allar LS
Hannathon – 7,580’
24hrIP = 1,135 BOEPD
30Drilling Inventory Midland Basin
Increasing inventory and NPV per section
4,000
3,500 Average Lateral Average Working
Length Interest
3,000
9,600’ 72%
Drilling Locations
(gross operated)
2,500
(up 13% from 2016) (up 10% from 2016)
2,000
Economic lateral feet 10% IRR threshold
1,500 increased economic locations:
17% 1,640(2)
1,000
~1,250 (from 2016) (comparable to peers)
500
0
(1)
Economic Resource Additional Resource
(1) Economic Resource represents 3P inventory within the confirmed contours and 20% IRR at $60/Bbl oil, $3/MMBtu natural gas, $30/Bbl NGLs
(2) 3P inventory inside and outside the confirmed contours; 10% IRR
31Drilling Inventory ~15 Years at Current Activity Level
Approximately 45 years including upside resources
Midland Basin and Eagle Ford
6,000
5,000
Drilling Locations
4,000
(gross operated)
3,000
2,000
1,000
0
Economic Resource(1) Additional Resource
Note: Eagle Ford 2017 average lateral length = 9,000’; up 18% from 2016
(1) Economic Resource represents 3P inventory within the confirmed contours for Howard and Martin Counties and 20% IRR at $60/Bbl oil,
$3/MMBtu natural gas, $30/Bbl NGLs
32Top-Tier Assets Regional Well Projected Economics
RockStar Sweetie Peck
Wells(1) across all intervals (WCA, WCB, LS) in the 2018 drilling program Wells(1) across all intervals (WCA, WCB, LS) in the 2018 drilling program
120% 100%
100%
80%
80%
60%
IRR
IRR
60%
40%
40%
20% 20%
0% 0%
$50 $55 $60 $65 $50 $55 $60 $65
NYMEX WTI NYMEX WTI
Well Cost: $8.3MM Well Spacing: 513’ – 660’ Well Cost: $7.5MM Well Spacing: 660’
Sand loading: 1,900 lbs/ft; Stage Spacing: 167’; Length: 10,000’ Sand loading: 1,900 lbs/ft; Stage Spacing: 167’; Length: 8,333’
Eagle Ford
Wells(1) across UEF/LEF in East, South and North Area in the 2018 drilling program
60%
50%
40%
IRR
30%
January 2018 Average
Mt. Belvieu ($/Gal)
20%
10%
0%
$0.60 $0.70 $0.80
Mt. Belvieu $/Gal
Well Cost: $6.8MM, Lateral Length: 8,800’, Well Spacing: 625’-900’, Sand Loading: 2,000 lbs/ft, Stage Spacing: 150’
Note: well costs include drill, complete, and equip; sensitivities at $3.00/MMBtu NYMEX; Eagle Ford oil flat at $60/Bbl WTI, excludes JV wells
(1) Weighted average by interval
332018 Planned Rig Activity and Completions By Month
2018: expected ~100 net completions Midland Basin; expected ~25 net completions Eagle Ford
14 120
12
100
Drilled But Uncompleted Wells
10
80
Operated Rigs
8
60
(1)
6
40
4
20
2
0 0
Dec Jan Feb Mar Apr May Jun Jul Aug Sep Oct Nov Dec
Midland Basin Eagle Ford Total Net DUCs
Note: The Company is currently operating one rig in the Powder River Basin, Wyoming, which is funded entirely through a carry arrangement with a third party
34SM Energy Premier Operator of Top Tier Assets
4 recent analyst initiation reports, 4 great recommendations
Value
proposition
“SM undervalued based on CF growth per debt adjusted share”
- Credit Suisse 12/11/17 - William Featherston
“Key differentiator is its Howard County acreage that has lived
up to management’s expectations and belied industry and
investor skepticism”
- Deutsche Bank 2/1/18 - Nitin Kumar
Drilling
“Top Midland Basin operator…SM ranks #1 in the Midland
catalysts Basin on a revenues per lateral foot basis”
- Baird 12/18/17 - Joseph Allman
“…growth asset base (Permian) sufficiently geologically de-
risked and SM now ideally positioned… From this point
forward should create a disproportionate amount of risk
adjusted equity value”
- FBR 2/5/18 - Rehan Rashid
“see upside to 2018 oil production given strong Howard County
well results and solid execution in 2017; less concerned about
2018 outspend given more constructive oil prices and visibility to
cash flow neutrality in 2019”
- Credit Suisse 12/11/17 - William Featherston
35Appendix
362017
Financial & Operating
Results
374th Quarter and FY 2017 Performance Solid Execution
Production 4Q17 FY 2017
Total Production (MMBoe) 10.4 44.5
Average Daily Production (MBoe/d) 112.6 121.8
Pre-Hedge Realized Price ($/Boe) $32.95 $28.20
Post-Hedge Realized Price ($/Boe) $32.16 $28.68
Costs $/Boe $/Boe
LOE $5.10 $4.43
Ad Valorem $0.33 $0.34
LOE including Ad Valorem $5.43 $4.77
Transportation $5.01 $5.48
Production Taxes (~4.0 – 4.5% of pre-derivative oil,
$1.41 $1.18
gas & NGL revenue)
Production Expenses $11.85 $11.43
Cash Production Margin (pre-hedge) $21.10 $16.77
G&A – Cash $2.69 $2.28
Cash Margin (pre-hedge) $18.41 $14.49
G&A – Non Cash $0.69 $0.43
DD&A $12.69 $12.53
38Well Hedged(1)
2018 percentage of expected production hedged
► ~85% of expected 1Q18 production
Production Hedged volumes hedged(2); ~65% of oil
volumes, ~85% of gas volumes (NGLs
hedged by product)
► ~75% of expected 2018 production95%
volumes hedged(2) : ~75% of oil
volumes, ~65% of gas volumes (NGLs
2018 75% hedged by product)
► Credit Agreement allows hedging of up
to 85% of projected production for the
first three years
► Significant hedge positions limit effect of
oil price changes when price is greater
than $57/Boe or less than $51/Boe
Note: The hedged volumes on this slide do not include any volumes related to basis swaps. See Appendix for details.
(1) Hedging data as of February 15, 2018 39
(2) At mid-point of guidanceBalance Sheet Solid Position Entering 2018
Liquidity of $1.2B, including $314MM cash on hand(1)
Balance Sheet offers financial flexibility
> No bond maturities until 2021
> Senior Secured Debt:TTM Adjusted EBITDAX at ~0.0 times; max ratio allowed 2.75 times
> TTM Adjusted EBITDAX:Interest at ~3.8 times; minimum ratio required 2.0 times
Debt Maturities(1)
(in millions)
$1,000
Facilities
Commitments and Borrowing Base: $925 million(3) 6%
Drilling and $750(1)
Completion Other
Corporate ratings: S&P BB-, Moody’s B1 8%
86% Other
$500
$172.5 86% 8%
$562 $500 $500 $500 $250
$345 $395
~$0 drawn
$0
2018 2019 2020 2021 2022 2023 2024 2025 2026
1.500%
Coupon 6.500%
6.125% 6.500% 5.000% 5.625% 6.750%
Yield to worst(2) 5.66% 5.64% 6.38% 6.13% 6.56% 6.59%
Initial call date 11/2016 11/2018 7/2017 7/2018 6/2020 9/2021
Initial call price 103.25% 103.06% 103.25% 102.50% 102.81% 103.38%
(1) As of December 31, 2017 (3) Reaffirmed November 2017
(2) As of February 15, 2018 404Q17 Regional Realizations
Benchmark Pricing
NYMEX WTI Oil ($/Bbl) $55.40
NYMEX LLS Oil ($/Bbl) $60.98
NYMEX Henry Hub Gas ($/MMBTU) $2.93
Hart Composite NGL ($/Bbl) $32.12
Production Volumes Eagle Ford(1) Permian Rocky Mountain SM Total
Oil (MBbls) 355 2,826 636 3,817
Gas (MMcf) 20,423 4,619 950 25,992
NGL (MBbls) 2,163 5 38 2,206
MBOE 5,922 3,601 833 10,356
Revenue (in thousands)
Oil $17,012 $152,432 $34,105 $203,549
Gas 56,750 21,501 2,003 80,254
NGL 56,093 142 1,149 57,384
Total $129,855 $174,075 $37,257 $341,188
Expenses (in thousands)
LOE $16,381 $25,383 $11,042 $52,807
Ad Valorem 2,469 940 35 3,444
Transportation 50,201 166 1,564 51,931
Production Taxes 2,421 8,637 3,592 14,650
Per Unit Metrics:
Realized Oil/Bbl $47.91 $53.94 $53.58 $53.32
% of Benchmark - WTI 86% 97% 97% 96%
Realized Gas/Mcf $2.78 $4.66 $2.11 $3.09
% of Benchmark – NYMEX HH 95% 159% 72% 105%
Realized NGL/Bbl $25.94 $26.36 $30.12 $26.01
% of Benchmark – HART 81% 82% 94% 81%
Realized BOE $21.93 $48.34 $44.73 $32.95
LOE/BOE $2.77 $7.05 $13.26 $5.10
Ad Val/BOE $0.42 $0.26 $0.04 $0.33
Transportation/BOE $8.48 $0.05 $1.88 $5.01
Production Tax- per BOE/% of Pre-Hedge $0.41/1.9% $2.40/5.0% $4.31/9.6% $1.41/4.3%
Revenue
Production Margin $9.86 $38.59 $25.24 $21.09
Note: Totals may not sum due to rounding and other classifications
(1) Includes nominal amounts of other production and expenses from the region. 412017 Activity Wells Drilled, Flowing Completions & DUC Count
Wells Drilled Flowing Completions DUC Count
4th Quarter 2017 2017 YTD 4th Quarter 2017 2017 YTD As of 12/31/17
Region Gross Net Gross Net Gross Net Gross Net Gross Net
Permian
Sweetie Peck 5 5 30 28 9 8 32 31 9 8
RockStar 27 22 74 66 15 14 40 39 40 33
Permian total 32 27 104 94 24 22 72 70 49 41
Eagle Ford 10 7 27 24 - - 38 35 33 30
Rocky Mountain
Divide County - - - - 2 2 2 2 18 15
Powder River Basin(1) 3 - 11 1 2 - 8 1 4 -
Rocky Mountain total 3 - 11 1 4 2 10 3 22 15
Subtotal Operated Wells 45 34 142 119 28 24 120 108 104 86
Non-operated Wells(2) n/a 1 n/a 4 n/a - n/a 3 n/a 1
Total n/a 35 n/a 123 n/a 24 n/a 111 n/a 87
As of December 31, 2017
(1) Activity in the Powder River Basin is provided by third party services and funding.
(2) Non-operated activity relates to wells located in the Permian Basin. 42Leasehold Summary
Pro-forma for pending transactions
Net Acres(1) Pro-forma
12/31/17 Pending Sales Net Acres
Midland Basin
RockStar 65,150 - 65,150
Sweetie Peck(2) 17,265 - 17,265
Halff East (Upton County) 5,420 - 5,420
Midland Basin Total 87,835 - 87,835
Eagle Ford 164,605 - 164,605
Rocky Mountain
Divide 119,415 - 119,415
Powder River Basin 138,545 (112,125) 26,420
Rocky Mountain Other(3) 186,845 - 186,845
Other Areas/Exploration 24,915 - 24,915
Total 722,160 (112,125) 610,035
(1) Includes developed and undeveloped oil and gas leasehold, fee properties, and mineral servitudes held as of December 31, 2017.
(2) Sweetie Peck acreage includes 2,450 net acres of drill-to-earn acreage.
(3) Rocky Mountain Other includes non-core Williston Basin, and other non-core acreage located in North Dakota, Montana, Wyoming, and Utah.
43Adjusted EBITDAX Reconciliation
Reconciliation of net loss (GAAP) to adjusted EBITDAX (non-GAAP) to Three Months Ended Twelve Months Ended
net cash provided by operating activities (GAAP): (in thousands) December 31, 2017 December 31, 2017
Net loss (GAAP) $(26,258) $(160,843)
Interest expense 43,618 179,257
Interest income (1,067) (3,968)
Income tax benefit (117,145) (182,970)
Depletion, depreciation, amortization, and asset retirement obligation liability accretion 131,393 557,036
Exploration(1) 14,484 49,879
Impairment of proved properties - 3,806
Abandonment and impairment of unproved properties 12,115 12,272
Stock-based compensation expense 6,540 22,700
Net derivative loss 115,778 26,414
Derivative settlement gain (loss) (8,168) 21,234
Net (gain) loss on divestiture activity (537) 131,028
Loss on extinguishment of debt - 35
Other, net 3,200 8,820
Adjusted EBITDAX (Non-GAAP) $173,953 $664,700
Interest expense (43,618) (179,257)
Interest income 1,067 3,968
Income tax benefit 117,145 182,970
Exploration(1) (14,484) (49,879)
Exploratory dry hole expense 2,381 2,381
Amortization of debt discount and deferred financing costs 3,798 16,276
Deferred income taxes (124,608) (192,066)
Plugging and abandonment (640) (2,735)
Other, net 326 (581)
Changes in current assets and liabilities 29,460 69,613
Net cash provided by operating activities (GAAP) $144,780 $515,390
Adjusted EBITDAX represents net income (loss) before interest expense, interest income, income taxes, depletion, depreciation, amortization and asset retirement obligation liability accretion expense, exploration expense, property abandonment and
impairment expense, non-cash stock-based compensation expense, derivative gains and losses net of settlements, gains and losses on divestitures, gains and losses on extinguishment of debt, and certain other items. Adjusted EBITDAX excludes
certain items that we believe affect the comparability of operating results and can exclude items that are generally one-time in nature or whose timing and/or amount cannot be reasonably estimated. Adjusted EBITDAX is a non-GAAP measure that we
present because we believe it provides useful additional information to investors and analysts, as a performance measure, for analysis of our ability to internally generate funds for exploration, development, acquisitions, and to service debt. We are also
subject to financial covenants under our Credit Agreement based on adjusted EBITDAX ratios. In addition, adjusted EBITDAX is widely used by professional research analysts and others in the valuation, comparison, and investment recommendations
of companies in the oil and gas exploration and production industry, and many investors use the published research of industry research analysts in making investment decisions. Adjusted EBITDAX should not be considered in isolation or as a
substitute for net income (loss), income (loss) from operations, net cash provided by operating activities, or other profitability or liquidity measures prepared under GAAP. Because adjusted EBITDAX excludes some, but not all items that affect net
income (loss) and may vary among companies, the adjusted EBITDAX amounts presented may not be comparable to similar metrics of other companies. Our credit facility provides a material source of liquidity for us. Under the terms of our Credit
Agreement, if we failed to comply with the covenants that establish a maximum permitted ratio of senior secured debt to adjusted EBITDAX and a minimum permitted ratio of adjusted EBITDAX to interest, we would be in default, an event that would
prevent us from borrowing under our credit facility and would therefore materially limit our sources of liquidity. In additi on, if we are in default under our credit facility and are unable to obtain a waiver of that default from our lenders, lenders under that
facility and under the indentures governing our outstanding Senior Notes and Senior Convertible Notes would be entitled to exercise all of their remedies for default.
(1) Stock-based compensation expense is a component of exploration expense and general and administrative expense on the statements of operations. Therefore, the exploration line
items shown in the reconciliation above will vary from the amount shown on the statements of operations for the component of stock-based compensation expense recorded to
exploration expense.
44Adjusted Net Loss Reconciliation
Reconciliation of net loss (GAAP) to adjusted net loss Three Months Ended Twelve Months Ended
(non-GAAP): (in thousands, except per share data) December 31, 2017 December 31, 2017
Net loss (GAAP) $(26,258) $(160,843)
Net derivative loss 115,778 26,414
Derivative settlement gain (loss) (8,168) 21,234
Net (gain) loss on divestiture activity (537) 131,028
Impairment of proved properties - 3,806
Abandonment and impairment of unproved properties 12,115 12,272
Loss on extinguishment of debt - 35
Other, net 8,200 13,820
Tax effect of adjustments(1) (45,987) (75,308)
US tax reform (63,675) (63,675)
Adjusted net loss (Non-GAAP) $(8,532) $(91,217)
Diluted net loss per common share (GAAP) $(0.24) $(1.44)
Net derivative loss 1.04 0.24
Derivative settlement gain (loss) (0.07) 0.19
Net (gain) loss on divestiture activity - 1.18
Impairment of proved properties - 0.03
Abandonment and impairment of unproved properties 0.11 0.11
Loss on extinguishment of debt - -
Other, net 0.07 0.12
Tax effect of adjustments(1) (0.42) (0.68)
US tax reform (0.57) (0.57)
Adjusted net loss per diluted common share (Non-GAAP) $(0.08) $(0.82)
Diluted weighted-average common shares outstanding (GAAP): 111,611 111,428
Adjusted net loss excludes certain items that the Company believes affect the comparability of operating results. Items excluded generally are non-recurring items or are items whose timing
and/or amount cannot be reasonably estimated. These items include non-cash and other adjustments, such as derivative gains and losses net of settlements, impairments, net (gain) loss on
divestiture activity, materials inventory loss, and gains or losses on extinguishment of debt. The non-GAAP measure of adjusted net income (loss) is presented because management believes
it provides useful additional information to investors for analysis of SM Energy's fundamental business on a recurring basis. In addition, management believes that adjusted net income (loss) is
widely used by professional research analysts and others in the valuation, comparison, and investment recommendations of companies in the oil and gas exploration and production industry,
and many investors use the published research of industry research analysts in making investment decisions. Adjusted net income (loss) should not be considered in isolation or as a
substitute for net income (loss), income (loss) from operations, cash provided by operating activities, or other income, profitability, cash flow, or liquidity measures prepared under GAAP.
Since adjusted net income (loss) excludes some, but not all, items that affect net income (loss) and may vary among companies, the adjusted net income (loss) amounts presented may not
be comparable to similarly titled measures of other companies.
(1) Income taxes are calculated using a tax rate of 36.1%, for the three and twelve-month periods ended December 31, 2017. These rates approximate
the Company's statutory tax rate adjusted for ordinary permanent differences. 45Total Capital Spend Reconciliation
Reconciliation of costs incurred in oil and gas
activities (GAAP) to Total capital spend Twelve Months Ended
(Non-GAAP)(1)(3) (in millions) December 31, 2017
Costs incurred in oil and gas activities (GAAP): $1,040.0
Asset retirement obligation (12.1)
Capitalized interest (12.6)
Proved property acquisitions(2) (1.6)
Unproved property acquisitions (78.6)
Other 1.3
Total capital spend (Non-GAAP): $936.4
(1) The non-GAAP measure of total capital spend is presented because management believes it provides useful information to investors for analysis of
SM Energy's fundamental business on a recurring basis. In addition, management believes that total capital spend is widely used by professional
research analysts and others in the valuation, comparison, and investment recommendations of companies in the oil and gas exploration and
production industry, and many investors use the published research of industry research analysts in making investment decisions. Total capital spend
should not be considered in isolation or as a substitute for Costs Incurred or other capital spending measures prepared under GAAP. The total capital
spend amounts presented may not be comparable to similarly titled measures of other companies.
(2) Includes approximately $1.4 million of ARO associated with proved property acquisitions for the year ended December 31, 2017.
(3) The Company completed several primarily non-monetary acreage trades in the Midland Basin during 2017 totaling $294.0 million of value attributed to
the properties surrendered. This non-monetary consideration is not reflected in the costs incurred or capital spend amounts presented above.
46PV-10 Reconciliation
Reconciliation of standardized measure (GAAP) to As of
PV-10 (Non-GAAP)(1) (in millions) December 31, 2017
Standardized measure of discounted future net cash flows (GAAP): $3,024.1
Add: 10 percent annual discount, net of income taxes 2,573.2
Add: future undiscounted income taxes 205.7
Undiscounted future net cash flows 5,803.0
Less: 10 percent annual discount without tax effect (2,746.5)
PV-10 (Non-GAAP): $3,056.5
(1) The non-GAAP measure of PV-10 is presented because management believes it provides useful information to investors for analysis of SM Energy's
fundamental business on a recurring basis. In addition, management believes that PV-10 is widely used by professional research analysts and others
in the valuation, comparison, and investment recommendations of companies in the oil and gas exploration and production industry, and many
investors use the published research of industry research analysts in making investment decisions. PV-10 should not be considered in isolation or as
a substitute for other measures prepared under GAAP.
47Oil and Gas Derivative Positions
By quarter through 2019
Fixed Swaps Oil Gas
Volume Volume
Period (MBbls) $/Bbl(1) (BBTU) $/MMBTU(1)
1Q’18 1,075 $50.16 20,788 $3.25
2Q’18 1,534 $49.57 15,712 $2.85
3Q’18 1,769 $49.77 17,147 $2.88
4Q’18 1,894 $49.87 18,646 $2.91
1Q’19 442 $50.70 16,979 $2.92
2Q’19 439 $50.70 - -
3Q’19 524 $50.70 - -
4Q’19 535 $50.70 - -
Collars Oil Midland – Cushing Oil Basis Swaps
Volume Ceiling Floor Volume Price Differential
Period (MBbls) $/Bbl(1) $/Bbl(1) Period (MBbls) $/Bbl(1)
1Q’18 1,445 $59.07 $50.00 1Q’18 2,113 ($1.15)
2Q’18 1,459 $59.03 $50.00 2Q’18 2,392 ($1.03)
3Q’18 1,948 $58.61 $50.00 3Q’18 3,018 ($1.06)
4Q’18 2,222 $58.44 $50.00 4Q’18 3,327 ($1.08)
1Q’19 1,445 $59.25 $47.75 1Q’19 1,366 ($1.07)
2Q’19 1,450 $59.23 $47.67 2Q’19 1,411 ($1.08)
3Q’19 1,501 $59.18 $47.59 3Q’19 1,497 ($1.09)
4Q’19 1,511 $59.12 $47.58 4Q’19 1,515 ($1.10)
Note: Includes all commodity derivative contracts for settlement at any time during the first quarter of 2018 and later periods through 2019, entered into as of 2/15/18.
(1) Prices are weighted averages; natural gas prices reflect the weighted average of regional contract positions and are no longer adjusted to a
NYMEX equivalent. 48NGL Derivative Position Detail(1)
NGL Swaps OPIS Eth Purity Mt Belv NGL Swaps OPIS Propane Mt Belv Non-TET NGL Swaps OPIS IsoButane Mt Belv Non TET
Volume Volume Volume
(2) (2) (2)
Period (MBbls) $/Bbl Period (MBbls) $/Bbl Period (MBbls) $/Bbl
1Q’18 923 $10.90 1Q’18 628 $25.39 1Q’18 167 $35.76
2Q’18 915 $10.87 2Q’18 554 $24.94 2Q’18 66 $35.07
3Q’18 1,033 $10.99 3Q’18 610 $24.27 3Q’18 70 $35.07
4Q’18 1,146 $11.18 4Q’18 671 $24.39 4Q’18 76 $35.07
2018 Total 4,017 2018 Total 2,463 2018 Total 379
1Q’19 853 $12.25 1Q’19 440 $26.13 1Q’19 29 $35.70
2Q’19 877 $12.29 2Q’19 348 $28.53 2Q’19 29 $35.70
3Q’19 907 $12.34 3Q’19 360 $28.53 3Q’19 30 $35.70
4Q’19 896 $12.36 4Q’19 355 $28.53 4Q’19 29 $35.70
2019 Total 3,533 2019 Total 1,503 2019 Total 117
1Q’20 275 $11.13
NGL Swaps Natural Gasoline Mt Belv Non TET NGL Swaps OPIS NButane Mt Belv Non TET
2Q’20 264 $11.13
Volume Volume
2020 Total 539 (2) (2)
Period (MBbls) $/Bbl Period (MBbls) $/Bbl
1Q’18 189 $49.40 1Q’18 206 $35.83
2Q’18 175 $50.99 2Q’18 84 $35.69
3Q’18 202 $51.13 3Q’18 93 $35.70
4Q’18 208 $50.99 4Q’18 102 $35.70
2018 Total 774 2018 Total 485
1Q’19 48 $50.93 1Q’19 37 $35.64
2Q’19 49 $50.93 2Q’19 38 $35.64
3Q’19 50 $50.93 3Q’19 39 $35.64
4Q’19 50 $50.93 4Q’19 39 $35.64
2019 Total 197 2019 Total 153
(1) Includes all commodity derivative contracts for settlement at any time during the first quarter of 2017 and later periods entered into as of February 15, 2018.
(2) Weighted-Average Contract Price 49NGL Realizations
• 30% increase in realized price (before hedges) from 4Q16 to 4Q17
• SM NGL price realizations are predominately tied to Mont Belvieu, fee
based contracts
• Differential reflects NGL barrel product mix and transportation and
fractionation fees
SM Typical NGL Bbl(1)
4Q16 1Q17 2Q17 3Q17 4Q17
13%
Mt. Belvieu ($/Bbl) $24.11 $26.74 $24.11 $27.55 $32.12
9%
42%
SM Realization $20.02 $22.06 $19.71 $22.40 $26.01 9%
($/Bbl)
27%
% Differential to 83% 82% 82% 81% 81%
Mt. Belvieu
Ethane Propane
Iso Butane Normal Butane
Natural Gasoline
(1) Includes the effects of ethane rejection
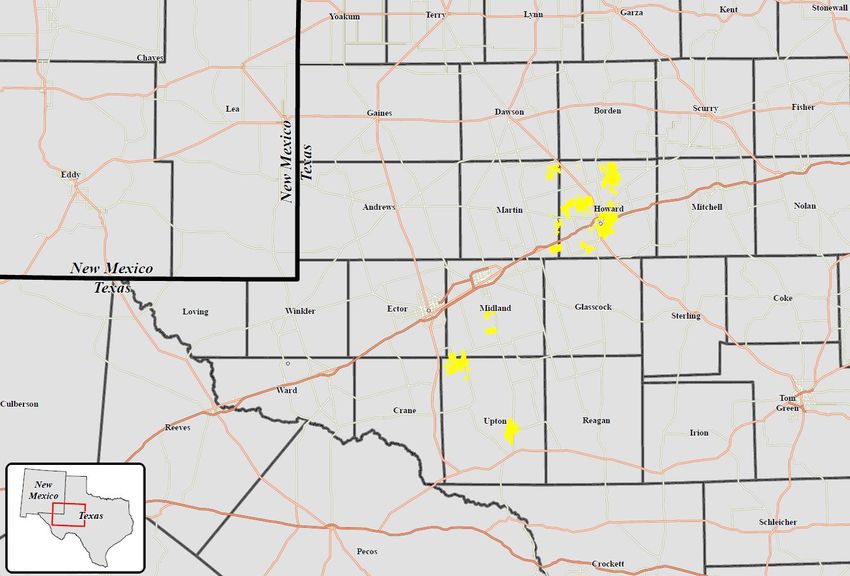
50Howard County Operators
SM Energy
Callon
Encana
Surge/Yantai Xinchao
Diamondback
Oxy
Energen
Breitburn
Sabalo
Grenadier
51Sweetie Peck Operators
SM Energy
Apache
Chevron
Concho
Devon
Diamondback
Discovery
Endeavor
Exxon
Legacy
Oxy
Pioneer
Summit
Miscellaneous
52Eagle Ford Operators
Dimmit
Maverick
Dimmit
Webb
Area
North
Fasken
Area
East
Area
South
53Divide County Operators
Canada
CPEG
RE
RE HES
CPEG RE
FAC
FAC
CLR
MRX HNT
NP
Divide
Williams
KKN CLR
HES
CPEG
54Reserves and Resources
Information about the terms “economic resources” and “economic inventory”
The Securities and Exchange Commission (“SEC”) requires oil and natural gas companies, in their filings with the SEC, to disclose proved
reserves, which are those quantities of oil, natural gas and NGLs, which, by analysis of geoscience and engineering data, can be estimated with
reasonable certainty to be economically producible—from a given date forward, from known reservoirs and under existing economic conditions
(using the trailing 12-month average first-day-of-the-month prices), operating methods and government regulations—prior to the time at which
contracts providing the right to operate expire, unless evidence indicates that renewal is reasonably certain, regardless of whether deterministic
or probabilistic methods are used for the estimation. The SEC also permits the disclosure of separate estimates of probable or possible
reserves that meet SEC definitions for such reserves; however, the Company currently does not disclose probable or possible reserves in its
SEC filings.
In this presentation, proved reserves attributable to the Company at December 31, 2017, are estimated utilizing SEC reserve recognition
standards and pricing assumptions based on the trailing 12-month average first-day-of-the-month prices of $51.34 per Bbl of oil, $3.00 per
MMBtu of natural gas, and $27.69 per Bbl of NGLs. At least 80% of the PV-10 of the Company’s estimate of its total proved reserves at
December 31, 2017, was audited by Ryder Scott Company, L.P. The Company may use the terms “economic resource,” “economic inventory,”
“additional resource” and similar phrases to describe estimates of gross drilling locations that the SEC rules may prohibit from being included in
filings with the SEC. These are the Company’s internal estimates of drilling locations. These quantities may not constitute “reserves” within the
meaning of the Society of Petroleum Engineer’s Petroleum Resource Management System or SEC rules. Such estimates and identified drilling
locations may not have been fully risked by Company management and are inherently more speculative than proved reserves estimates. Actual
locations drilled and quantities that may be ultimately recovered from the Company’s interests could differ substantially from these estimates.
There is no commitment by the Company to drill all of these drilling locations.
The calculation of economic resources is not necessarily calculated in accordance with SEC guidelines for proved reserves and is not reviewed
by third party engineers. Economic resources presented in this presentation are calculated using benchmark pricing and projected pricing,
which differs from the pricing used for proved reserves. Management believes the presentation of economic resources and economic drilling
inventory are useful to investors in the valuation of SM Energy; however, the calculations may not be consistent with similar metrics provided by
peers.
55Definitions of Non-GAAP, forward looking metrics
The following metrics are forward-looking non-GAAP financial measures. The Company believes these measures are commonly
used in the E&P industry, and other industries, by shareholders, professional research analysts and others in valuation,
comparison and investment recommendations. Certain forward-looking metrics cannot be presented in conjunction with a
reconciliation to the closest GAAP measure, because certain portions of the forecast calculation would are inherently
unpredictable. Accordingly, investors are cautioned not to place undue reliance on these numbers.
1) Projected cash flow per debt adjusted share:
For purposes of forward-looking cash flow from operations, it is not possible to project changes in working capital. The Company calculates
forward-looking cash flow as projected adjusted EBITDAX (reconciled above to GAAP Net Loss and GAAP Net cash provided by operating
activities for actual results) less projected cash interest expense and cash taxes.
The calculation of debt adjusted shares is the sum of average fully diluted common shares outstanding plus the quotient of total principal value
of long-term debt outstanding (including senior notes, convertible stock, credit facility) less cash and cash equivalents divided by the price of
common stock. In the case of the current 2-year plan, the price of common stock used is the closing price at year-end 2017.
2) Capital spend:
For purposes of forward-looking capital spend, it is the sum of projected capital expenditures for drilling and completion of wells, capitalized
geologic and geophysical work, exploration costs excluding dry hole expenses, facilities and infrastructure, allocated overhead and land costs
exclusive of acquisitions.
Capital spend as reported for actual results is reconciled above to GAAP costs incurred in oil and gas activities.
3) Net debt:EBITDAX:
Net debt is total principle value of long-term debt outstanding less cash and cash equivalents. Projected net debt:EBITDAX is projected net debt
divided by projected adjusted EBITDAX. Adjusted EBITDAX is reconciled above to GAAP Net Loss and GAAP Net cash provided by operating
activities for actual results.
56Contact Information
Jennifer Martin Samuels
Vice President - Investor Relations
303-864-2507
jsamuels@sm-energy.com
57You can also read