Analyst Day Presentation - Taboola
←
→
Page content transcription
If your browser does not render page correctly, please read the page content below

Analyst Day
    Presentation

1        March 30, 2021
Forward-Looking Statements

Disclaimer   Certain statements in this Presentation may be considered forward-looking statements. Forward-looking statements generally relate to future events or ION Acquisition Corp 1 LTD. (“ION”) and Taboola.com Ltd.’s (the
             “Company”) future financial or operating performance. For example, projections of future Revenue, Adjusted EBITDA, Net Dollar Retention, New Publisher Growth, and other metrics are forward-looking statements. In some
             cases, you can identify forward-looking statements by terminology such as “may”, “should”, “expect”, “intend”, “will”, “estimate”, “anticipate”, “believe”, “predict”, “potential” or “continue”, or the negatives of these terms or
             variations of them or similar terminology. Such forward-looking statements are subject to risks, uncertainties, and other factors which could cause actual results to differ materially from those expressed or implied by such
             forward looking statements.
             These forward-looking statements are based upon estimates and assumptions that, while considered reasonable by ION and its management, and the Company and its management, as the case may be, are inherently uncertain.
             Uncertainties and risk factors that could affect the Company’s and ION’s future performance and cause results to differ from the forward-looking statements in this presentation include, but are not limited to: the occurrence of
             any event, change or other circumstances that could give rise to the termination of the proposed transaction involving the Company and ION (such transaction, the “Business Combination”); the outcome of any legal proceedings
             that may be instituted against ION or the Company, the combined company or others following the announcement of the Business Combination; the inability to complete the Business Combination due to the failure to obtain
             approval of the shareholders of ION or to satisfy other conditions to closing; changes to the proposed structure of the Business Combination that may be required or appropriate as a result of applicable laws or regulations or as a
             condition to obtaining regulatory approval of the Business Combination; the ability to meet stock exchange listing standards following the consummation of the Business Combination; the risk that the Business Combination
             disrupts current plans and operations of ION or the Company as a result of the announcement and consummation of the Business Combination; the ability to recognize the anticipated benefits of the Business Combination, which
             may be affected by, among other things, competition, the ability of the combined company to grow and manage growth profitably, maintain relationships with customers and retain its management and key employees; costs
             related to the Business Combination; changes in applicable laws or regulations; the Company’s estimates of expenses and profitability and underlying assumptions with respect to shareholder redemptions and purchase price and
             other adjustments; ability to attract new digital properties and advertisers; ability to meet minimum guarantee requirements in contracts with digital properties; intense competition in the digital advertising space, including with
             competitors who have significantly more resources; ability to grow and scale the Company’s ad and content platform through new relationships with advertisers and digital properties; ability to secure high quality content from
             digital properties; ability to maintain relationships with current advertiser and digital property partners; ability to make continued investments in the Company’s AI-powered technology platform; the need to attract, train and
             retain highly-skilled technical workforce; changes in the regulation of, or market practice with respect to, “third party cookies” and its impact on digital advertising; continued engagement by users who interact with the
             Company’s platform on various digital properties; the impact of the ongoing COVID-19 pandemic; reliance on a limited number of partners for a significant portion of the Company’s revenue; changes in laws and regulations
             related to privacy, data protection, advertising regulation, competition and other areas related to digital advertising; ability to enforce, protect and maintain intellectual property rights; and risks related to the fact that we are
             incorporated in Israel and governed by Israeli law; and other risks and uncertainties set forth in the section entitled “Risk Factors” and “Cautionary Note Regarding Forward-Looking Statements” in ION’s final prospectus
             relating to its initial public offering dated October 1, 2020 and in subsequent filings with the Securities and Exchange Commission (“SEC”), including the proxy statement relating to the Business Combination expected to be
             filed by ION.
             Nothing in this Presentation should be regarded as a representation by any person that the forward-looking statements set forth herein will be achieved or that any of the contemplated results of such forward-looking statements
             will be achieved. You should not place undue reliance on forward-looking statements, which speak only as of the date they were made, January 29, 2021. The inclusion of these projections does not constitute republication or
             affirmation thereof as any other date. Neither ION nor the Company undertakes any duty to update these forward-looking statements.
             Non-GAAP Financial Measures
             This Presentation includes certain financial measures not presented in accordance with GAAP including, but not limited to, Adjusted EBITDA and certain ratios and other metrics derived therefrom, including free cash flow and
             ex-TAC Revenue, and related margin measures, as well as Real RPM and New Publisher Revenue (ex-TAC). These non-GAAP financial measures are not measures of financial performance in accordance with GAAP and may
             exclude items that are significant in understanding and assessing the Company’s financial results. Therefore, these measures should not be considered in isolation or as an alternative to net income, cash flows from operations or
             other measures of profitability, liquidity or performance under GAAP. You should be aware that the Company’s presentation of these measures may not be comparable to similarly-titled measures used by other companies.
             The Company believes these non-GAAP measures of financial results provide useful information to management and investors regarding certain financial and business trends relating to the Company’s financial condition and
             results of operations. The Company believes that the use of these non-GAAP financial measures provides an additional tool for investors to use in evaluating ongoing operating results and trends in and in comparing the
             Company’s financial measures with other similar companies, many of which present similar non-GAAP financial measures to investors. These non-GAAP financial measures are subject to inherent limitations as they reflect the
             exercise of judgments by management about which expense and income are excluded or included in determining these non-GAAP financial measures. Please refer to footnotes where presented on each page of this Presentation
             or to the appendix found at the end of this Presentation for a reconciliation of these measures to what the Company believes are the most directly comparable measure evaluated in accordance with GAAP.
             This Presentation also includes certain projections of non-GAAP financial measures. Due to the high variability and difficulty in making accurate forecasts and projections of some of the information excluded from these
             projected measures, together with some of the excluded information not being ascertainable or accessible, the Company is unable to quantify certain amounts that would be required to be included in the most directly comparable
             GAAP financial measures without unreasonable effort. Consequently, no disclosure of estimated comparable GAAP measures is included and no reconciliation of the forward-looking non-GAAP financial measures is included.

                                                                                                                                                                                                                                                    2
Use of Projections
             This Presentation contains financial forecasts with respect to the Company’s projected financial results, including Revenue and Adjusted EBITDA, for the Company's fiscal years 2021 through 2025. The Company's independent

Disclaimer   auditors have not audited, reviewed, compiled or performed any procedures with respect to the projections for the purpose of their inclusion in this Presentation, and accordingly, they did not express an opinion or provide any
             other form of assurance with respect thereto for the purpose of this Presentation. As discussed under “Financial Information” above, all financial information, including the projected information, was prepared in accordance with

(cont’d)
             GAAP. These projections should not be relied upon as being necessarily indicative of future results. The assumptions and estimates underlying the prospective financial information are inherently uncertain and are subject to a
             wide variety of significant business, economic and competitive risks and uncertainties that could cause actual results to differ materially from those contained in the prospective financial information. Accordingly, there can be no
             assurance that the prospective results are indicative of the future performance of the Company or that actual results will not differ materially from those presented in the prospective financial information or that the prospective
             financial information will be the same as that presented in the proxy statement related to the Business Combination. Inclusion of the prospective financial information in this Presentation should not be regarded as a
             representation by any person that the results contained in the prospective financial information will be achieved.
             Industry and Market Data
             In this Presentation, the Company relies on and refer to certain information and statistics obtained from third-party sources, which it believes to be reliable. The Company has not independently verified the accuracy or
             completeness of any such third-party information. You are cautioned not to give undue weight to such industry and market data.
             This Presentation may include trademarks, service marks, trade names and copyrights of other companies, which are the property of their respective owners. Solely for convenience, some of the trademarks, service marks, trade
             names and copyrights referred to in this Presentation may be listed without the TM, SM, (c) or (r) symbols, but ION and the Company will assert, to the fullest extent under applicable law, the right of the applicable owners, if
             any, to these trademarks, service marks, trade names and copyrights.
             Additional Information
             These communications are being made in respect of the Business Combination. These communications do not constitute an offer to sell or the solicitation of an offer to buy any securities or a solicitation of any vote or approval,
             nor shall there be any sale of securities in any jurisdiction in which such offer, solicitation or sale would be unlawful prior to registration or qualification under the securities laws of such jurisdiction. In connection with the
             proposed Business Combination, the Company intends to file with the SEC the Registration Statement on Form F-4 required to be prepared in connection with the proposed transaction (the “Registration Statement”) which will
             include a proxy statement/prospectus and certain other related documents, which will include both the proxy statement to be distributed to holders of Class A ordinary shares of ION in connection with ION’s solicitation of
             proxies for the vote by ION’s shareholders with respect to the Business Combination and other matters as may be described in the Registration Statement, as well as the prospectus relating to the offer and sale of the securities of
             the Company to be issued in the Business Combination. ION’s shareholders and other interested persons are advised to read, when available, the preliminary proxy statement/prospectus included in the Registration Statement and
             the amendments thereto and the definitive proxy statement/prospectus, as these materials will contain important information about the Company, ION and the Business Combination. After the Registration Statement is declared
             effective, the definitive proxy statement/prospectus will be mailed to shareholders of ION as of a record date to be established for voting on the Business Combination and other matters as may be described in the Registration
             Statement. Shareholders of ION will also be able to obtain copies of the proxy statement/prospectus and other documents filed with the SEC that may be incorporated by reference therein, without charge, once available, at the
             SEC’s web site at www.sec.gov, or by directing a request to: ION Acquisition Corp 1 Ltd., 89 Medinat Hayehudim Street, Herzliya 4676672, Israel, Attention: Secretary, +972 (9) 970-3620.
             Participants in the Solicitation
             The Company, ION and certain of their respective directors, executive officers and other members of management and employees may, under SEC rules, be deemed to be participants in the solicitation of proxies from ION’s
             shareholders in connection with the proposed transaction. You can find more information about ION’s directors and executive officers in ION’s final prospectus dated October 1, 2020 and filed with the SEC on October 5, 2020.
             Additional information regarding the participants in the proxy solicitation and a description of their direct and indirect interests will be included in the proxy statement/prospectus when it becomes available. Shareholders,
             potential investors and other interested persons should read the proxy statement/prospectus carefully when it becomes available before making any voting or investment decisions. You may obtain free copies of these documents
             from the sources indicated above.

                                                                                                                                                                                                                                                   3
AGENDA

•   Introduction

•   Overview

•   About Taboola

•   Investment Highlights

•   Financial Information

•   Valuation & Comparables

                              4
PRESENTERS AND SENIOR LEADERSHIP

       Adam Singolda                 Stephen Walker                      Gilad Shany                    Avrom Gilbert
        Founder & CEO                       CFO                              CEO                              COO

 ▪ Founded Taboola over 13      ▪ 6+ years at Taboola            ▪ CEO of ION Acquisition         ▪ President and COO of ION
   years ago, and has led the                                      Corp. 1 and Managing             Acquisition Corp. 1
                                ▪ Previously held positions in
   Company as its CEO ever                                         Partner of ION Crossover
                                  Idealab’s New Ventures                                          ▪ COO of growth tech
   since                          Group and also led several       Partners (ICP)                   companies SimilarWeb &
                                  of Idealab's portfolio         ▪ Prior to co-founding ICP, 10     Seeking Alpha.
                                  companies, including             years of experience
                                                                                                  ▪ 8 years public & private
                                  Perfect Market                   investing in public and          investments, incl. equities
                                                                   private companies with
                                ▪ Prior experience at Disney                                        analyst with UBS & Venture
                                  & General Electric               Baron Capital (NY),              Capital at Jerusalem Global
                                                                   and Magma Venture                Ventures.
                                                                   Partners (TLV)

                                                                                                                                  5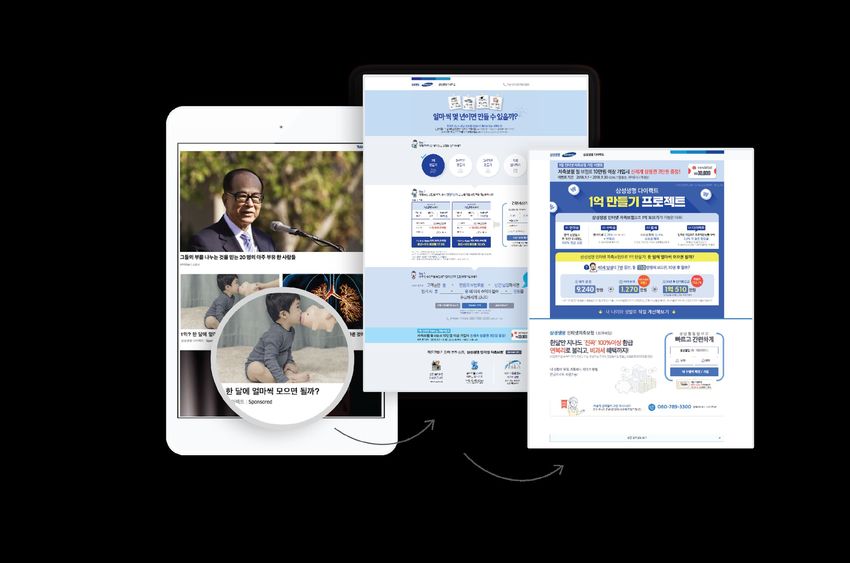
AGENDA

•   Introduction

•   Overview

•   About Taboola

•   Investment Highlights

•   Financial Information

•   Valuation & Comparables

                              6
We Power Recommendations
     for The Open Web
  Helping people discover things they may like

                                                 7
TABOOLA = SEARCH “IN REVERSE”
From people looking for information
to information looking for people

                                      8
YOU HAVE
SEEN
TABOOLA
BEFORE

           9
SOLVING TREMENDOUSLY DIFFICULT
TECHNOLOGICAL CHALLENGES
Predicting what people might be interested in without the intent data that Google
has or the personal data that Facebook has and doing it at massive scale.

  516M
                                DAILY
                                ACTIVE
                                USERS1

            More than Twitter and Snap combined2

  1 Petabyte                              330K+                                           1 Trillion
  Data Processed by Taboola AI Daily3     CPU Cores4                                       Monthly Recommendations5

                                               (1) Daily Active Users measures the 7-day average number of users exposed to Taboola recommendations
                                                                 (2) Twitter and Snap reported 187M and 249M (respectively) in Q3-2020 Earnings reports
                                                                                                                  (3)(4)(5)Source: Company estimates      10
ENABLING PUBLISHERS TO
COMPETE WITH WALLED GARDEN
BEHEMOTHS
Bringing the user data, AI technology and scale of demand
to open Web players
75%
25%3
News sites
eCommerce sites
Apps / Games
SEARCH SOCIAL ECOMMERCE OPEN WEB2
CTV
WALLED GARDENS1
(1) Walled Gardens includes other closed platforms including Snap, Twitter, and Netflix
(2) Open Web: Digital properties not owned by walled gardens such as websites, apps, games, Connected-TV apps, etc.
(3) Percentages reflect time spent on digital media according to company estimates based on eMarketer data. 25% reflects total
time spent on Open Web properties, not just on Taboola 11TABOOLA CAN CAPTURE
SHARE OF THE HIGHLY
FRAGMENTED $64B OPEN
WEB MARKET1 SEARCH SOCIAL ECOMMERCE
Open Web
App Install Affiliates
RECOMMENDATIONS
ENGINE
Video
Banners
(1) Jounce Media, 2020 Market Outlook Report 12TABOOLA IS FOR ADVERTISING WHAT
SHOPIFY IS FOR E-COMMERCE
E-COMMERCE ADVERTISING
13AGENDA
• Introduction
• Overview
• About Taboola
• Investment Highlights
• Financial Information
• Valuation & Comparables
14FULL TECH STACK FOR PUBLISHERS:
MISSION CRITICAL FOR THE OPEN WEB
$2B+ Paid To Publishers
Over 3 Years1
Monetization
Monetizing with non-interruptive,
native ads
Engagement
Engaging users by recommending
organic content
Audience
Driving quality audiences from
across the network
Empowering editorial teams with
actionable data insights
(1) See Appendix for historical annual Traffic Acquisition Costs (TAC)THAT’S WHY TABOOLA GETS
LONG-TERM, EXCLUSIVE
PARTNERSHIPS WITH PUBLISHERS
“NBC News Group is excited to continue working with Taboola to expand the reach
of our content and continue driving our already impressive growth. We recognize the • 120% NDR in 20201
value of Taboola’s technology and their ability to drive meaningful engagement with
NBC News content, especially at a time when competition for user attention is at an • 9,000 publishers
all-time high.” • Global
- Elisabeth Sami, SVP of Global Strategy and Business Development for NBC News Group
Publishers on a 5+ Year Contract with Taboola
(1) Source: Company Data. Net Dollar Retention is the simple arithmetic
average of our Monthly Net Dollar Retention for the last twelve months.
Monthly Net Dollar Retention for a given month is the ex-TAC Revenue
in that month from digital properties partners that were Taboola digital
property partners in the same month of the prior year divided by the
ex-TAC Revenue attributable to that same group of partners in the
prior-year month. Current period ex-TAC Revenue includes any upsells
and are net of contraction or attrition over the trailing 12 months, but
excludes ex-TAC Revenue from new digital properties partners in the
current period.
16ADVERTISERS CHOOSE
TABOOLA FOR THE OPEN WEB
• Massive reach – 516M Daily Active Users
• Performance focus with measurable ROI
• Brand safe ad placements Time
• Target ads based on what people truly care about
Largest advertiser is 3% of total ad spend
10th largest advertiser is 1% of total ad spend1
101% Net Dollar Retention over last 8 quarters2
(1) Source: Company Data
(2) Last 8 quarters, excluding Q2-2020 due to expected
one-time impact of COVID-19 (Q4, 2018 - Q3, 2020,
excluding Q2-20). See prior slide for a definition of NDR 17KEEPING THE OPEN WEB SAFE CONTENT / ADS
Ongoing monitoring of the network and removal of
undesirable content and actors.
CONTENT REVIEW TEAM
Manual Automated
+
Review Review
30+ Reviewers
24/5 manual review + 14h per day on weekends Labeling
24/7 automated review - Taboola automations including AI tools
13 Languages
English, Danish, Swedish, Norwegian, Spanish, Portuguese, ACCEPTED REJECTED
German, French, Hebrew, Japanese, Korean, Dutch, Italian
Go Live
QUALITY CONTROL
500K+ Items reviewed every week(1) Manual Internal & External
Content + Automated Scans
Sweep
(1) Company data, based on weekly averages in Q4-2020
18“Mack Weldon is a digitally native—growth focused—menswear startup brand that
designs and delivers premium basics for men. As a performance marketer I’m constantly Discovering
looking for new ways to create awareness for our products while growing our customer
base cost efficiently. With Taboola, we more than doubled down on content marketing Direct-To-Consumer
this year and grew our campaigns to drive thousands of customers every month.
Recently, we found especially high-converting audiences on Taboola’s Data Marketplace.
Targeting those audiences gave us greater scale and drove more purchases on sites that
Brands on Taboola
either previously did not convert or converted at too high of a cost.” Taboola drives discovery and purchases of premium
- Zach Jacobs, Director of Marketing at Mack Weldon basics for men.
19“We built a website to sell our insurance product online. To
drive more sign ups, we started running digital campaigns. To
encourage sign-ups, the completion of our quote calculator Generating Quality
was the most important behavior. Taboola hugely contributed
in expanding our strategy to new digital channels, and helped
is gain more online customers.”
Leads for Samsung Life
Insurance with Taboola
- Gahee Lee, Digital Sales Section Manager, Samsung Life Insurance
20MARKETPLACE
BUSINESS MODEL
$
$
$
$
$
$
$
AI-Powered
Biddable
$ Marketplace
Advertisers place bids to appear Taboola shares ad revenue
on Taboola and pay per click/view with Publishers
21AGENDA
• Introduction
• Overview
• About Taboola
• Investment Highlights
• Financial Information
• Valuation & Comparables
22INVESTMENT
HIGHLIGHTS
1● The Open Web is a massive category
2● Taboola’s technology is resilient to the future
disappearance of third-party cookies
3● Product-led growth fueled by a network effect
4● Platform advantage driven by Taboola’s
technology
5● Numerous paths to accelerate growth
6● Proven, founder-led management team
7● Superior financial profile with recurring
revenues, scale, and profitable growth
231 TABOOLA IS POISED TO CAPTURE
SHARE OF THE $64B OPEN WEB
MARKET • More than ads, product led -
driving engagement, and audience
to the entire publisher org
• Exclusive & direct relationships
with publishers/advertisers -
enables end-to-end innovation and
predictable growth
• 1st party & contextual data, built
Audience
Network
for a cookieless world - We’re
“always on” - all users, all GEOs,
The Open
all platforms. 500M+ DAU.(1)
Web
Amazon
DSP
Source: Original Image: “State of the Open Internet” by Jounce
Media, January 2020, Modified to reflect Taboola as part of The
Open Web
(1) Daily Active Users measures the 7-day average number of users
exposed to Taboola recommendations
242 TABOOLA TECH IS BUILT
FOR A COOKIE-LESS WORLD
• Taboola has its own 1st party cookie - Taboola’s strong yield performance despite 3rd party
cookies being blocked in the industry for years:
recommending personalized editorial content - Apple started blocking 3rd party cookies in 2017
enables serving our own 1st party identifier - Firefox, Edge, etc are also blocking 3rd party cookies
- GDPR launched in 2018
- CCPA launched in 2019
• Unique readership context - deep access to
the context of the page, allowing advertisers to
target context (vs. “3rd party cookie behavior”) Yield
• People click on Taboola recommendations
tens of billions of times a year1 - re-hashing
Taboola identifier across websites
(1) Source: Company data. Clicks represent total clicks on Taboola recommendations,
including paid advertisements (“sponsored content”) and editorial ("organic") content 253 PRODUCT-LED GROWTH WITH
A BUILT-IN NETWORK EFFECT
More Publisher More Users Reached,
Partners More Often
Higher Yield More User Data
(Better Results for Advertisers Gathered
and Publishers)
264 PLATFORM ADVANTAGE
DRIVEN BY INVESTMENT IN
TECH
500 R&D staff
100 in Algo & Data
$100M Annual R&D Investment
Source: Company data, 2021 estimates
27
275 RECOMMENDING ANYTHING, ANYWHERE
A MULTI BILLION DOLLAR OPPORTUNITY
Core Business
$10M’s in 20201 $10M’s in 20203
ANYWHERE $1B+ in 2020 & ANYTHING
Taboola News Growing Rapidly2 New products and segments
(mobile carriers, device (TV ads, eCommerce, app
manufacturers, CTV...) downloads, gaming...)
This Game Will Keep You Up All
Night!
Good Game | Sponsored
(1)(2)(3)Source: Company data, Gross Revenue
Note: Financial models take into consideration only the core business
28RECENT
DEVELOPMENTS:
TABOOLA HIGH
IMPACT LAUNCH
Specialized Solution for
Brands & Agencies Running
Brand Awareness Campaigns
Premium Ad Brand Safety, Unique
Placements & Suitability & Readership
Experiences Adjacency Control Data & Insights
295 GROWTH CASE STUDY:
CONVERTMEDIA ACQUISITION
$90M+ 2020
Technology
Integration &
Go-To-Market
Acquired ConvertMedia
$20M 2016
Annual Run
Rate1
(1) Annual run-rates are expressed in Gross Revenue 30
306 PROVEN, FOUNDER-LED MANAGEMENT TEAM
Adam Singolda Stephen Walker Eldad Maniv Lior Golan
13 years at Taboola 6 years at Taboola 8 years at Taboola 11 years at Taboola
Founder & CEO CFO President & COO CTO
Kristy Sundjaja Aviv Sinai Ran Buck
1 year at Taboola 13 years at Taboola 7 years at Taboola
SVP, People Operations SVP, R&D SVP, Global Revenue
317 FINANCIAL
HIGHLIGHTS
$1.2B Gross
Revenue
$382M
2020
ex-TAC1
$106M Adj.
EBITDA2
WE POWER
$160M Raised to
date
RECOMMENDATIONS
$240M+ on the balance
sheet3 FOR THE OPEN WEB
(1),(2) Non-GAAP measure, see appendix for reconciliation to GAAP
(3) Cash & cash equivalents, balance as of 12/31/2020
32AGENDA
• Introduction
• Overview
• About Taboola
• Investment Highlights
• Financial Information
• Valuation & Comparables
33OUR MODEL IN A NUTSHELL
Model components: Sample inputs / financials: Illustrative Taboola economics:
Gross revenue(1) $909 $1.00 (100%)
–
Traffic Acq Cost (Value to publishers) ($627) ($0.69)
=
ex-TAC Revenue(2) $282 $0.31
–
Cost of Revenues ($48) ($0.05)
=
Gross profit $234 $0.26
– 34
R&D ($73) ($0.08)
–
S&M ($110) ($0.12)
–
G&A ($34) ($0.04)
=
Operating Income $17
+
Dep, Amort, Share Based Comp, Other item $50
=
Adjusted EBITDA(3) $67
+
Change in WC, Other items(5) + (1) Revenue paid by Advertisers, before traffic acquisition costs (TAC) paid to
($24) Publishers.
PP&E and Capitalized Platform Costs (2) Revenue to Taboola after TAC paid to Publishers. Non-GAAP measure, see
= appendix for reconciliation to GAAP
Free Cash Flow(4) $43 (3)(4) Non-GAAP measure, see appendix for reconciliation to GAAP
(5) Non cash charges, Cash charges excluded from Adjusted EBITDA 34TABOOLA FOCUSES ON
PROFITABLE GROWTH
1 2
1 2
ex
PROFITABLE GROWTH
Rule of 40 Business
UPSIDE IN OUR MODEL
• Growth from Core Open Web business only
• Conservative growth assumed for existing
base
• Additional upside from existing growth
initiatives and inorganic
LONG-TERM MODEL
• 20%+ ex-TAC Revenue Growth
• 30%+ Adj. EBITDA Margin
(1)3
(1),(2) Non-GAAP measure, see appendix for reconciliation to GAAP
(3) Non-GAAP measure, see appendix for reconciliation to GAAP, Adj. EBITDA Margin = Adj. EBITDA / ex-TAC Revenue 352019 METRICS WERE INFLUENCED
BY OUR INVESTMENT STRATEGY
In 2019, Taboola made the decision to invest $60 million in long-term partnerships with a number of very
large, brand name publishing networks1
Given that investment, Adj. EBITDA Margin2 …Without that investment, Adj. EBITDA Margin
(% of ex-TAC) was 11.5%... would have been 26.4%
27.8% 27.8%
26.4%
23.8% 23.8%
11.5%
2018A 2019A 2020A 2018A 2019A 2020A
In 2020 that investment has paid off as projected Adj. EBITDA Margins are above 27% - higher than historical trends
(1) "Invest” means initial losses on these publisher networks plus management’s estimate of margin lost on other publishers due to lower yields as demand was spread thinner.
(2) Non-GAAP measure, see appendix for reconciliation to GAAP
36COVID-19 IN 2020 PROVED THE Leaving 2020 stronger than we entered
RESILIENCY OF OUR MODEL with sustainably higher profitability
Yield1
1. Strong Recovery 1. Sustainable yield increase, driving higher
margins
Relentless
• Worked with publisher partners to
Focus on
optimize for yield
Yields…
• • Signed more advertisers seeking
consumers digitally
COVID-19 / Recession Dip
• Dramatic improvements in algorithms
2. 2. Reset cost base
• Hiring freeze permanently “right sized”
… Combined organization (sustainable)
with Historically • Reduced travel, real estate and
Low Costs overhead (partially sustainable)
E
(1) Yield is a normalized measure of performance that controls for changes due to traffic shifts.
(2) Cash Expenses is the difference between Adj. EBITDA and exTAC Revenue. 2019 is adjusted to reflect an ex-TAC margin of
26.4% as detailed on the previous slide. 37GROWTH DRIVEN BY CORE OPEN
WEB INSTALLED BASE
1. 1. New Publisher ex-TAC Revenue1
• Historically 15% new supply growth
• Projecting 8-11% going forward
Continued
growth from
new supply...
Outlier
2. 2. Net Dollar Retention2 Growth Has
Two Elements
• Improvements in yield
… helps provide
fuel for growth • More supply from existing publishers
from a strong • Projecting 101-103% net dollar
installed base. retention - historically 110-120%
(1) “New Publisher” refers to publishers that begin working with Taboola on new contracts in the period.
(2) Net Dollar Retention is the simple arithmetic average of our Monthly Net Dollar Retention for the last twelve months. Monthly Net Dollar Retention for a given month is the ex-TAC Revenue in that month from digital properties partners that were Taboola
digital property partners in the same month of the prior year divided by the ex-TAC Revenue attributable to that same group of partners in the prior-year month. Current period ex-TAC Revenue includes any upsells and are net of contraction or attrition over the
trailing 12 months, but excludes ex-TAC Revenue from new digital properties partners in the current period.
38SELECTED NON-GAAP METRICS
16%
ex-TAC Revenue Growth1
$516M
27%+
$445M Adj EBITDA Margin2
$382M
$143M
$127M
2020A
$106M
2021E 2022E
16%+
Adj EBITDA Growth3
ADJ. EBITDA ($ in millions) ex-TAC ($ in millions)
80%+
Adj. Gross Profit Margin4
(1),(2),(3) Growth rates reflect 2020-2023 CAGR. ex-TAC, Adj. EBITDA Margin, and Adj. EBITDA are Non-GAAP measures, see appendix for
reconciliation to GAAP
(4) Adj. Gross Profit Margin is projected to exceed 80% in 2020, 2021, and 2022. Adj. Gross Profit Margin is calculated as a percentage of ex-TAC
revenue and is a non-GAAP measure, see appendix for reconciliation to GAAP. 392021 QUARTERLY AND FY PROJECTION
1
1
2
2
Quarterly results in 2020 do not reflect standard seasonality due to impact of recession and special publisher arrangements related to COVID-19.
Note: dollar values in this table reflect rounded values; growth and margin calculations are based on exact values calculated to nine decimal places.
(1),(2): Non-GAAP measure, see appendix for reconciliation to GAAP
40AGENDA
• Introduction
• Overview
• About Taboola
• Investment Highlights
• Financial Information
• Valuation & Comparables
41VALUATION FRAMEWORK
Primary Secondary
Mid-Cap Advertising Technology Advertising Technology Majors Marketing Technology
• Funded by digital marketers / • Funded by digital marketers / • Recurring revenues
advertisers looking for new advertisers looking for new
customers customers • B2B-oriented solutions that are
consumer focused
• Similar scale
• Support marketers / advertisers
looking for new customers
42Thank you.
43APPENDIX
HISTORICAL & PROJECTED REVENUE & EX-TAC
REVENUE1

                                                                                               YoY growth                  ex-TAC revenue margin2

   (1) Non-GAAP measure, see appendix for reconciliation to GAAP
   (2) ex-TAC Revenue Margin reflects ex-TAC Revenue / Gross Revenue, Non-GAAP measure, see appendix for reconciliation to GAAP                     45
KEY MODEL ASSUMPTIONS
Operating costs:
REVENUE (ex-TAC)1 ($ in millions)
▪ Historically, Taboola grew 20%+ (CAGR ’17A-’20E) ($19) $34 ($45) $34 $62
▪ In 2020, Taboola generated $382 million ex-TAC (6.4%) 8.9% (10.1%) 6.6% 10.4%
▪ Conservatively modeled ~16% growth, doubling ex-TAC in 5 years
ADJUSTED EBITDA2
▪ $106 million in 2020 and growing faster than ex-TAC Revenue
▪ >25% of ex-TAC Revenue (2020)
▪ Rule of 40: ex-TAC growth + Adj. EBITDA Margin3 always above 40%
COST ASSUMPTIONS
▪ Return to “normal” operations and cost basis in H1 2021
(conservative)
▪ Two primary costs (headcount and hardware / IT) grow commensurate
with revenue growth
Operating income ($ in millions) Operating margin (% of ex-TAC revenue)
(1),(2),(3) Non-GAAP measures, see appendix for reconciliation to GAAP
48SELECTED GAAP AND NON-GAAP METRICS
1
2
ADJ. EBITDA MARGIN LONG-TERM EX-TAC REVENUE GROWTH
3
▪ Return to “normal” operations and cost basis in H1 2021 ▪ Current Model only forecasts growth from Core Business
▪ Investing in serving infrastructure and Algo beginning 2021 ▪ Long-Term Growth of 20%+ includes core business growth, inorganic
and existing growth initiatives
▪ IPO readiness costs added starting 2021
(1),(2),(3) Non-GAAP measure, see appendix for reconciliation to GAAP
47ADJUSTED EBITDA RECONCILIATION
48PROJECTED ADJUSTED EBITDA RECONCILIATION
49EX-TAC REVENUE RECONCILIATION
50PROJECTED EX-TAC REVENUE RECONCILIATION
51ADJUSTED EBITDA MARGIN RECONCILIATION
52PROJECTED ADJUSTED EBITDA MARGIN
RECONCILIATION
53EX-TAC REVENUES MARGIN
RECONCILIATION
54PROJECTED EX-TAC REVENUES
MARGIN RECONCILIATION
55HISTORICAL & PROJECTED ADJ. GROSS PROFIT MARGIN RECONCILIATION
HISTORICAL AND PROJECTED FREE CASH FLOW
RECONCILIATION

      2021 Free Cash Flow Reduced by Plan To Invest in Two Areas:
       1) Purchase of $30M of servers beyond “normal” levels as part of investment in algorithmic yield improvements
       2) Plan to remodel offices globally for post-COVID work environment

(1)     Adj. EBITDA Plus the change in working capital reflects the net cash provided by operating activities.

                                                                                                                       57
CONSOLIDATED BALANCE SHEET
As of Dec 31, As of Dec 31,
($ in millions) 2019 2020
Cash, cash equivalents and short-term deposits $ 116 $ 243
Total Assets $ 482 $ 580
Total Liabilities & Convertible Shares $ 475 $ 533
Accumulated Deficit $ (40) $ (31)
Additional Paid-in-capital $ 47 $ 78
Total Shareholders' Equity $ 7 $ 47
58VALUATION BENCHMARKING
Source: Wall Street research, filings and FactSet as of 3/26/2021.
Taboola figures calculated using ex-TAC revenue.
Figures for Alphabet, MediaAlpha, Magnite, PubMatic and Trade Desk calculated on a ex-TAC equivalent
revenue basis. Data for Advertising Technology and Marketing Technology represents means.
Advertising Technology Majors: Alphabet, Facebook, Twitter.
Marketing Technology: HubSpot, Medalia, LiveRamp, LivePerson, SVMK and Yext.
59OPERATIONAL BENCHMARKING
Source: Wall Street research, filings and FactSet as of 3/26/2021.
Taboola figures calculated using ex-TAC revenue.
Figures for Alphabet, MediaAlpha, Magnite, PubMatic and Trade Desk calculated on a ex-TAC equivalent
revenue basis. Data for Advertising Technology and Marketing Technology represents means.
Advertising Technology Majors: Alphabet, Facebook, Twitter.
Marketing Technology: HubSpot, Medalia, LiveRamp, LivePerson, SVMK and Yext.
60You can also read