IT's that simple. Analyst Presentation February 2021 - Datagroup

Page created by Harvey Carpenter
 
CONTINUE READING
IT's that simple. Analyst Presentation February 2021 - Datagroup
IT’s that simple.
Analyst Presentation February 2021
IT's that simple. Analyst Presentation February 2021 - Datagroup
The Year 19/20 in a Nutshell

                    Solid numbers with significant TOP-line growth
                    ▪ Share of service revenues further increased – low-margin hardware decreased
                    ▪ This brings the recurring revenues further up
                    ▪ Solid business in all DATAGROUP market units – some of the local branches
                      showed record results
                    ▪ 21 new Corbox customers, 14 upsells with existing customers

                    Singular negative events burdened the result heavily
                    ▪ Some small impacts from the Corona pandemics e.g. on the RPA business and
                      the Ulm branch
                    ▪ Key issue: Losses and risk provisions in DATAGROUP Financial IT Services
                      GmbH

IT's that simple.                                                             Analyst presentation 02/21 (6) |   2
IT's that simple. Analyst Presentation February 2021 - Datagroup
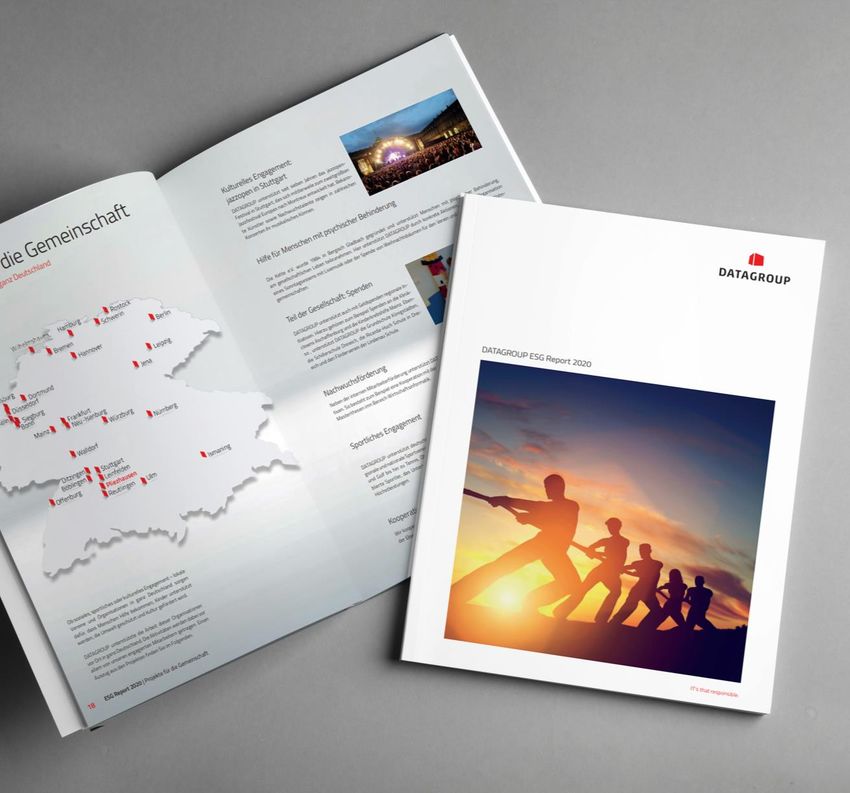
DATAGROUP Continues Expansion Course despite Corona

Revenue €m                    EBITDA €m (before risk provisions)   EPS cents (before risk provisions)       Strong increase in
                      358.2                                                     174                         Revenue, decline in
360                           56                                   180
                                                          53.8
                                                                                                            EBITDA and EPS
                                                                                                 147
                                                                                                            ▪ 11.6m € positive effect
                                                                                      -15.5%                  from Portavis bad will
340                           52                                   135
             +16.8%                       +14.7%                                                            ▪ 24.6m € extraordinary
                                                                                                              costs in the financial
                                                          EBITDA
320                           48        46.9              margin
                                                           15.0%
                                                                    90                                        service sector, thereof
                                                                                                              12.0m € risk provisions
            306.8

300                           44                                    45
                                                                                                            ■ One-off effect, lucky buy
                                        EBITDA
                                        margin           + 11.6
                                         15.3%                                                  +144
                                                                                                              Portavis

280                           40                                     0
                                                                                                        3   ■ Effects from risk provisions in
           18/19      19/20             18/19             19/20               18/19             19/20         the financial services sector

IT's that simple.                                                                                              Analyst presentation 02/21 (6) |   3
IT's that simple. Analyst Presentation February 2021 - Datagroup
Transitions Burdened DATAGROUP Financial IT Services

                    ▪ Transitions of new customers of DATAGROUP Financial IT Services GmbH (FIS)
                      required more time and led to higher personnel expenses than expected.
                    ▪ Production and delivery processes at FIS did not meet DATAGROUP standard.
                    ▪ Effective countermeasures led to significant improvement in earnings.

IT's that simple.                                                               Analyst presentation 02/21 (6) |   4
IT's that simple. Analyst Presentation February 2021 - Datagroup
Q1 20/21 Shows Strong Growth

Revenue €m                            EBITDA €m                          EPS cents                          ▪ Q1 19/20 adversely
                                                                                   174                        affected by
110                       108.6       16                                 44
                                                                                                 41           DATAGROUP Ulm and
                                                             14.8
                                                                                                              Almato
100                                   14                                 36
             +31.1%                             +57.1%                           +141.2%

                                                             EBITDA
 90                                   12                     margin      28
                                                              13.7%

            82.8

 80                                   10       9.5                       20
                                                                                  17
                                              EBITDA
                                              margin
                                               11.4%
 70                                    8                                 12
        Oct - Dec 19   Oct - Dec 20        Oct - Dec 19   Oct - Dec 20        Oct - Dec 19   Oct - Dec 20

IT's that simple.                                                                                             Analyst presentation 02/21 (6) |   5
IT's that simple. Analyst Presentation February 2021 - Datagroup
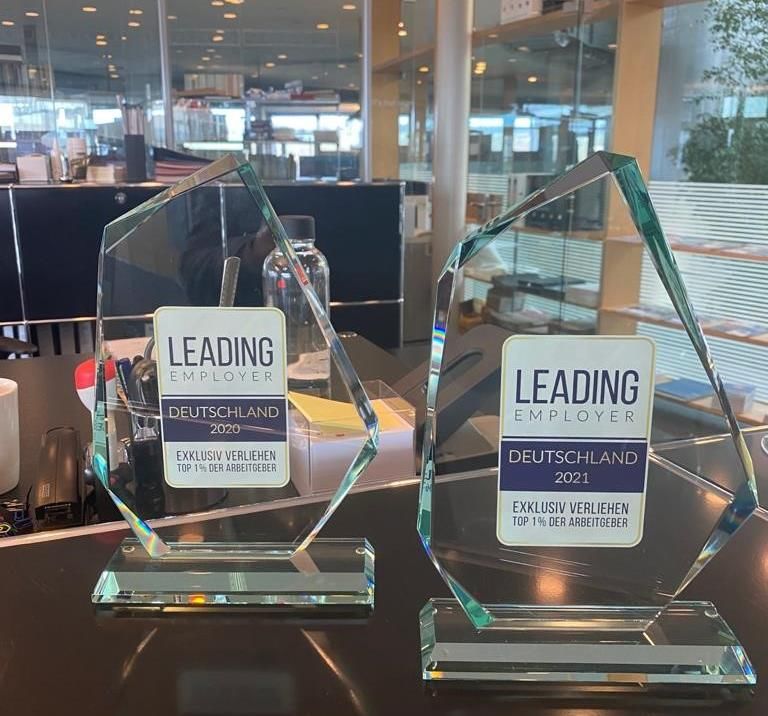
Lockdown II Does Not Have Any Negative Impact
on Business Operations

                                    ▪ Services can be delivered as usual to our customers
                                    ▪ Our strong customer base with long-term contracts
                                      delivers stable, recurring revenues and all market
                                      units are running at good / increasing profitability
                                    ▪ High level of remote work among the DATAGROUP
                                      Workforce: Up to 90% of our employees are home-
                                      office-enabled
                                    ▪ Strong focus on health protection for employees and
                                      customers
                                    ▪ Sales activities have been shifted to virtual formats
                                      and we expect an increase in new customer wins

IT's that simple.                                                    Analyst presentation 02/21 (6) |   6
IT's that simple. Analyst Presentation February 2021 - Datagroup
Good Start to the New Fiscal Year

▪ Performance of all DATAGROUP market units much
  better than anticipated
▪ Better than expected progress in restructuring FIS
▪ Risk provisions in 19/20 cover all budgeted cost
  related to DATAGROUP FIS
▪ M&A pipeline is well filled
▪ Sales activities have been sucessfully shifted to
  virtual formats
▪ High customer satisfaction
▪ Additional Corona-related revenues (e.g. vaccination
  centers)

IT's that simple.                                        Analyst presentation 02/21 (6) |   7
IT's that simple. Analyst Presentation February 2021 - Datagroup
Corona Related Order Intake: Equipment of Vaccination
Centers in Baden-Württemberg

                    Equipment of 60 vaccination centers in Baden-Württemberg with Microsoft-based
                    digital infrastructure
                    The Project
                    ▪ Design of the entire solution in Microsoft Azure Cloud
                    ▪ Set-up, roll-out and operation of managed clients
                    ▪ Service desk and technical support of vaccination centers
                    ▪ Since January 2021 the entire vaccination process is supported by the
                      DATAGROUP solutions

                    The challenge
                    ▪ Only one month from offer to productive roll-out
                    ▪ 8.000 users over 60 locations

IT´s that simple.                                                                 DATAGROUP AGM March 4, 21   8
IT's that simple. Analyst Presentation February 2021 - Datagroup
Digitalisation on the Rise: Good Order Intake With AI and
Automation and Mobilisation of Business Processes

                                                                                                         Additional contracts for the
                                                                                                         development of innovative
                                                                                                         AI-based services, e.g.
                                                                                                         ▪ Recogniton of bills for
                                                                                                           bonus programs with
                                                                                                           smartphone app
                                                                                                         ▪ Recognition of handwritten
                                                                                                           text on forms
                                                                                                         ▪ Recognition of custom
                                                                                                           documents for the
                                                                                                           automation of Brexit
Contract prolongation (Telco)   New order intake (Retail)            New order intake (Bank)               procedures
Robotic Process Automation      Mobile App for Contactless Cashier   Development of Software Robot for
Platform                                                             Backoffice Processes
ca. 2.0m €                      ca. 1.2m €                           ca. 0.6m €

IT´s that simple.                                                                                          DATAGROUP AGM March 4, 21   9
IT's that simple. Analyst Presentation February 2021 - Datagroup
Digitalisation on the Rise: Sparda Bank Counts on Almato as
Partner

„The cooperation with the team has been outstanding. Our high expectations on the solutions and the
targets related have been fully met.“
Michael Lichtner, Head of production, Sparda Bank Baden-Württemberg

Realization and support for property   Development of service app for       Automation of backoffice processes      Development and support of
portal with innovative AI services     banking customers with integration   based on the DATAGROUP Robots-          customer self service centers for
based on AWS public cloud              of innovative fintech services       as-a-Service-Platform (private cloud)   mortgages

IT´s that simple.                                                                                                     DATAGROUP AGM March 4, 21 10
Selected Profit and Loss Statement Figures Q1 20/21

 Figures in € thousand                           Q1 19/20   Q1 20/21   Changes
 Revenues                                         82,849    108,616     31.1%    ▪ Growth of revenue
 Other own work capitalized                        279        369       32.3%      because of first time
 Change of capitalized contractual costs          2,120       634      -70.1%      consolidation of Portavis
 Total revenues                                   85,248    109,619     28.6%    ▪ Organic growth
    Material expenses / expenses for purchased                                     about 10%
                                                  26,778     41,329     54.3%
    services
 Gross profit                                     58,470     68,290     16.8%
    Personnel expenses                            44,056     48,738     10.6%
 EBITDA                                           9,453      14,849     57.1%
 EBIT                                             2,706      6,553     142.2%
    Financial result                               -515       -559      8.5%
 EBT                                              2,191      5,994     173.6%
 Net income                                       1,395      3,441     146.7%
 EPS (in €)                                        0.17       0.41     141.2%

IT's that simple.                                                                   Analyst presentation 02/21 (6) |   11
Selected Key Balance Sheet Figures Q1 20/21

 Figures in € thousand                              31.12.19   31.12.20   Changes
 Goodwill                                           64,027     62,501      -2.4%    ▪ Reduction of goodwill
 Long-term financial liabilities                    162,598    209,711     29.0%      due to PPA
    thereof liabilities to financial institutions   90,257     78,273     -13.3%      DATAGROUP Ulm
    thereof liabilities from finance leases         30,736     42,478      38.2%    ▪ € 12m tranche of
    thereof pension provisions                      37,595     77,652     106.5%      promissory note repaid
 Short-term liabilities                             89,408     107,737     20.5%
    thereof liabilities to financial institutions
                                                                                    ▪ Increase in pension
                                                     8,857     12,073      36.3%
    thereof liabilities from finance lease
                                                                                      provisions related to
                                                    10,155     15,431      52.0%
 Cash and cash equivalents
                                                                                      Portavis
                                                    39,241     60,693      54.7%
 Accounts receivable                                45,909     38,694     -15.7%
 Accounts payable                                   11,441     13,632      19.2%
 Net financial debt (short and long term)           83,871     57,252     -31.7%
 Equity ratio1) (in %)                               23.3       17.3      -25.8%
                                                                                    1) Modified equity ratio incl. quasi-
 Return on   equity2)   (in %)                        7.5       20.8      178.5%    equity funds
                                                                                    2) ROE = surplus (extrapolated for
 Balance sheet total                                327,637    383,846     17.2%
                                                                                    the entire year) / average equity ratio

IT's that simple.                                                                       Analyst presentation 02/21 (6) | 12
Cash Flow from Investing Activities Q1 20/21

 Figures in € thousand                                          Q1 19/20   Q1 20/21   Changes

 Cash inflow from sale of property, plant and equipment           815        162       -80.1%   ▪ Significant decrease
 Cash outflow for investment in property, plant and equipment    -3,600     -1,134     -68.5%     of Capex
 Cash inflow from intangible assets                                4          1        -85.6%   ▪ No payment for
 Cash outflow for investments in intangible assets               -1,399      -832      -40.5%     acquisition of new
 Cash inflow from sale of financial assets                        199         0       -100.0%     companies
 Cash outflow for investments in financial assets                  0        -1,045       ./.

 Interest received                                                107        208       94.1%

 Net cash used for investing activities                          -3,873     -2,640     -31.8%

IT's that simple.                                                                                 Analyst presentation 02/21 (6) | 13
Cash Flow from Operating Activities Q1 20/21

 Figures in € thousand                                                 Q1 19/20   Q1 20/21   Changes

 Net income for the period                                              1,395      3,441     146.7%    ▪ Distorting effect: BFL
 Interest received                                                       -107       -208      94.1%      loan of € 842k repaid
 Interest paid                                                           304        350       15.2%      (categorized as cash
 Depreciation and amortisation of non-current assets                    6,655      8,296      24.7%      flow from operating
 Changes in pension provisions                                           180        234       30.2%      activities)
 Gains (-) / losses (+) on disposals of non-current assets               76         -21      -127.9%
 Increase (-) / decrease (+) of receivables or liabilities to
                                                                        1,554      -5,805    -473.5%
 shareholders, related and associated companies
 Increase (-) / decrease (+) of inventories, trade receivables and
                                                                        -6,710     3,364     -150.1%
 other assets
 Increase (+) / decrease (-) of trade payables and other liabilities    -4,597     -6,669     45.1%

 Other non-cash transactions                                             205        83        -59.3%

 Cash flow from operating activities                                    -1,045     3,065     -393.2%

IT's that simple.                                                                                         Analyst presentation 02/21 (6) | 14
IT just works.
Optimally Positioned to Meet Market Requirements
Leading IT-Service Provider in Germany (Source Lünendonk)

▪ Full service offering for IT and cloud services
▪ For companies with 100 – 5.000m € annual
  revenue as well as institutions
▪ Almost 3,000 employees exclusively in Germany
▪ Close to our customers across Germany
▪ Competent contact at eye level
▪ Innovative Service-as-a-Product approach with
  CORBOX service suite

IT's that simple.                                           Analyst presentation 02/21 (6) | 16
Strong Growth in Recurring Revenues
With High Margin Services Accelerates in 20/21

Revenues 10/11 – 19/20 €m                                                                                   82% gross margin 19/20
                                                                                    358.2
                                                                                                            through recurring revenue
350
                                                                            306.8
300
                                                                    272.1

250
                                                            223.1                   232

                                                                            188             Recurring
200                                                 174.9
                                                                     165                    revenue
                            156.9   152.4   157.6
                    146.2                                   125
150
                             37                      76
        108.6        32              42      57
                                                                                     33
                                                                                                            ■ Recurring Cloud Services
                                                                             25
100       24
                     56      63      57      45      39      32
                                                                     34
                                                                             28
                                                                                                            ■ Recurring Non-Cloud Sevices
                                                                                                            ■ One time services
          34                                                         23              40     Non-recurring
 50        9         15      16                      21      24                             revenue
                                     15      19
          42         43      41      38      37      39      42      50
                                                                             66      53                     ■ Trade + Others
  0
        10/11       11/12   12/13   13/14   14/15   15/16   16/17   17/18   18/19   19/20                   Fiscal Year 01.10 – 30.09.

IT's that simple.                                                                                               Analyst presentation 02/21 (6) | 17
Development of EBITDA

EBITDA 10/11 – 19/20 €m                                             EBITDA Margin 10/11 – 19/20 in %

60                                                                                      15.0%   16%
                                                                              15.3%
     CAGR 10/11 – 19/20: 27.6 %                                                         53.81
                                                                                                14%
                                                            12.1%     12.6%    46.9
                                                                                        11.6
45                                                  10.9%                                       12%
                                                                                7.1
                                            9.7%                      34.5                      10%
                                                                       0.8
                             6.9%                           27.0
30                                  6.8%                                                        8%
                    6.5%
        5.5%
                                                    19.1     4.4
                                                                                                6%
                                            15.3
15                          10.8    10.3
                                                     3.1
                                                                                                4%     ■ One-off effects out of
                     9.5                                                                                   acquisitions
        6.0
                                                                                                2%
                                                                                                       ■ EBITDA margin
 0                                                                                              0%     1
       10/11        11/12   12/13   13/14   14/15   15/16   16/17     17/18    18/19    19/20           Before risk provisions
                                                                                                       Fiscal Year 01.10 – 30.09

IT's that simple.                                                                                          Analyst presentation 02/21 (6) | 18
Development of EBIT

EBIT 10/11 – 19/20 €m                                               EBIT Margin 10/11 – 19/20 in %   DATAGROUP realized
                                                                                                     extraordinary purchase
                                                                                                     price bargains over the
45                                                          8.3%                               9%
     CAGR 10/11 – 19/20: 21.3 %                                                                      past five years
                                                                    7.5%      7.7%             8%
                                                    7.2%1
                                                                                               7%
                                            6.1%1
                                                                                      5.9%1
30                                                                                             6%
                                                                              23.7
                                                                                               5%
                                                                     20.4     0.6      21.01
         3.4%                       3.2%                    18.6     0.8                       4%
                             2.8%
                                                             3.7
15                  2.6%                            12.7                                       3%
                                                                                       11,6
                                             9.6
                                                     3.0                                       2%
                                                                                                     ■ One-off effects out of
                                                                                                       acquisitions
         3.7         3.8     4.3     4.8
                                                                                               1%
                                                                                                     ■ EBIT margin
 0                                                                                             0%    1 Before
        10/11       11/12   12/13   13/14   14/15   15/16   16/17   17/18    18/19     19/20                 risk provisions
                                                                                                     Fiscal Year 01.10 – 30.09.

IT's that simple.                                                                                       Analyst presentation 02/21 (6) | 19
Growth Strategy
DATAGROUP Grows Stronger Than the Market

                                                                                   ▪ Bitkom expects market
                                                                                     to recover after Covid-
    28% Telco Services                              40                               19-related downturn
                                                                 23% IT Services
                              49                                                   ▪ Projected market growth
                                                                                     of 2.7% for 2021
                                                                                   ▪ Average sales growth of
                                   ITC Market Germany
                                                                                     14.2% since 10/11 at
                                      € 174.4bn p.a.
                                                                                     DATAGROUP
                          7
                                                         32
           4% Telco
                              12
         Infrastructure
                                    8
                                                                 18% IT Hardware
 7% Telco End Devices                       27

                                                                                   in € bn
                    5% Consumer Electronics              15% Software              Source: Bitkom, January 2021

IT's that simple.                                                                      Analyst presentation 02/21 (6) | 20
Cloud Computing as a Driver
DATAGROUP as Cloud Orchestrator

To what extent does your company already use cloud computing?              ▪ Cloud computing has established as a leading
225                                                                          technology in Germany
 80%
                                                        73%                ▪ User can choose between private cloud, public cloud
 70%        65%                    66%                                       or hybrid cloud model
 60%                                                                       ▪ DATAGROUP sees itself as a cloud orchestrator
175
 50%                                                                       ▪ We offer all models and support our customers from
 40%                                                                         the transition into the cloud right through to
                                                                             operations, including continuous monitoring
 30%
125                 18% 17%
                                         21%
                                                              19%          ▪ There is still a huge potential particularly among
 20%
                                               13%                           Mittelstand companies
 10%                                                                8%

  0%
                     16                  17                   18
 75
        14/15       User
                     15/16    16/17 Planner
                                       17/18and 18/19     Not a topic
                                                         19/20     20/21   Source: Cloud Monitor 2019, Bitkom and KPMG, June 2019
                                    discusser
IT's that simple.                                                                                              Analyst presentation 02/21 (6) | 21
Every Second Company Wants to Cooperate with a
Full-Service Provider

Which approach does your company take when awarding                   ▪ As a full IT service provider and one-stop-shop with
contract packages to external consulting and IT service
225                                                                     more than 30 locations in Germany, DATAGROUP
providers as part of an ERP migration?
                                                                        provides the ideal conditions to fulfill the full-service
                                                                        approach

      47 %
175
                                                             48 %

125                                                                   ■ Full-service approach Process re-engineering, migration and
                                                                        subsequent operation by a service partner
                                                                      ■ Multi-provider approach: Process re-engineering, migration and
                                                                        subsequent operation by several service partners
                                                                      ■ Both of which, depending on project requirements
 75
        14/15       15/16   16/17   17/18    18/19   19/20    20/21   Source: Lünendonk S/4HANA Study, November 2019
                                            5%
IT's that simple.                                                                                            Analyst presentation 02/21 (6) | 22
Our Full Service Offer for Companies as USP

                                              ▪ “Service-as-a-Product”
                                                replaces “time-and-
                                                material”
                                              ▪ Modular offering for
                                                care-free IT
                                              ▪ Economies of scale
                                                through industrial
                                                production
                                              ▪ ISO 20000 certified
                                                (TÜV Süd)

IT's that simple.                                Analyst presentation 02/21 (6) | 23
1. On the Basis of Standardization
Factory Manufacturing of IT Operations

                                         ▪ Provision according to
                                           industrial standards on
                                           the basis of defined
                                           roles, processes and
                                           procedures
                                         ▪ Standardization as a
                                           basis for automation and
                                           efficiency gains
                                         ▪ DATAGROUP as cloud
                                           enabler

IT's that simple.                           Analyst presentation 02/21 (6) | 24
2. On the Basis of Data Centers in Germany in Colocation

                               Advantages of colocation strategy:
                               ▪ Maximum security
                               ▪ Perfect connectivity to public cloud
                               ▪ Geo redundancy
                               ▪ Less capex
                               ▪ Highest flexibility and scalability
                               ▪ Highest level of standardization
                                ▪ ISO 20000
                                ▪ ISO 27001

IT's that simple.                                                       Analyst presentation 02/21 (6) | 25
3. On the Basis of DATAGROUP Production Model
                                                              Virtually centralized
                                                              supply units
                                       Market units           ▪ Efficiency gains / cost
                                                                control
                                       Customers

                                       Central supply units
                                                              ▪ Automation
                                                              ▪ Public cloud integration
                                                              ▪ Scalability / capacity for
                                                                growth
                                                              Local presence ensures
                                                              ▪ Eye height
                                                              ▪ Proximity
                                                              ▪ On-site services
                                                              ▪ Sales success

IT's that simple.                                                Analyst presentation 02/21 (6) | 26
4. CORBOX Guarantees Recurring Revenues

Sample Customer Revenue in m €                                                                        ▪ Recurring revenues with
                                                             Contract phase 2
                                                                                                        CORBOX are extended
                                 Contract phase 1                                                       by additional services
1.5
                                                                                                        over time
                                                                                                      ▪ Average contract
                                                                                                        duration ca. 4.5 years
1.0

                                                                                                      ■     Projects
0.5
       Transition
                                                                                                      ■     Increased delivery level
                                                                                                            of services
                                                                                                      ■ ■ CORBOX upselling
0.0
                                                                                                      ■ CORBOX basic contract
       year 0       year 1   year 2     year 3      year 4     year 5      year 6   year 7   year 8         (fix volume)

IT's that simple.                                                                                         Analyst presentation 02/21 (6) | 27
Strong Order Intake with CORBOX

Materials trade              Church                            Financial Service Provider               Cooling systems
Full Outsourcing             Full Outsourcing                  Full Outsourcing                         Full Outsourcing
5 years, ca. 2.7m € / year   2 years, ca. 1.2m € / year        7 years, single digit million € / year   5 years, ca. 0.8m € / year

                                                                                                        and many more…

                                                                                                         ▪ No cluster risk

Food                         Logistics                         Public sector                             ▪ No sector risk
                                                               Service Desk, End User, Public
SAP                          Service Desk, End User Services                                             ▪ Hardly any economic risk
                                                               Cloud, Security
5 years, ca. 0.2m € / year   3 (+1) years, ca. 1.8m € / year   Tbd., ca. 4m € total

IT's that simple.                                                                                          Analyst presentation 02/21 (6) | 28
DATAGROUP Again Top 3 in Customer Satisfaction

                          NTT Data      84%
                                                                                      ▪ Among 850 evaluated
                                TCS     84%
                      DATAGROUP         82%                                             IT out- and cloudsourcing
                             Deloitte   82%                                             contracts
                         Capgemini      77%
                               Wipro    76%                                           ▪ 21 evaluated IT service
                             Bechtle    75%
                          Accenture     74%
                                                                                        providers
                             Infosys    74%
                                Atos    73%                                           ▪ Top 3 with top ranks in:
                                HCL     73%
                                PwC     72%                                             ▪ Cloud capability (rank 1)
                     Computacenter      72%
                      Ernst & Young     71%                                             ▪ Innovation (rank 1)
                                 CGI    69%
                         T-Systems      69%                                         ▪ Business understanding
                                 IBM    68%
                                                                Average in customer
                                                                                      (rank 2)
                          Cognizant     67%
                                                                satisfaction = 72 %
                        Sopra Steria    65%                                           ▪ Best in customer loyalty
                              Fujitsu   58%
                    DXC Technology      57%
                                                                                      Source: IT Outsourcing Study Germany 2020
                                    40% 45% 50% 55% 60% 65% 70% 75% 80% 85%           by Whitelane Research and Navisco AG

IT's that simple.                                                                         Analyst presentation 02/21 (6) | 29
Brand eins and Statista Rank DATAGROUP
Among the Best IT Service Providers in 2021

IT Security                                                         ■■■■
Cloud Services                                                      ■■■□
Training                                                            ■■■■
Network & Storage                                                   ■■■□
Software Implementation & Maintenance                               ■■■□
Communication and Collaboration                                     ■■■□
Managed Services & Outsourcing                                      ■■■■
Hardware Implementation & Maintenance                               ■■■■
IT Consulting                                                       ■■■■
Total                                                               ■■■■

■ More than 5,500 experts and customers rank 230 companies in 10 criteria

IT's that simple.                                                           Analyst presentation 02/21 (6) | 30
Collecting Top Marks as Employer

                                   ▪ “Germany’s best employers 2021”
                                     Stern in cooperation with Statista, 01/2021
                                   ▪ “Best employer 2020“
                                     Focus Business in cooperation with kununu, 02/2020
                                   ▪ “Leading Employer Germany 2020“
                                     Die Zeit, 01/2020
                                   ▪ “Germanys most innovative work places“
                                     Hamburgisches Weltwirtschaftsinstitut, 01/2020
                                   ▪ “Most attractive IT service provider 2020“
                                     FAZ Institute, 01/2020
                                   ▪ “Germany‘s best employers“
                                     Die Welt, 08/2019

IT's that simple.                                                  Analyst presentation 02/21 (6) | 31
Dual Growth Strategy

Anorganic vs. Organic Growth – Ambition
                                                                     ▪ Growth through new customer acquisition
225
                                                                      ▪ Market potential: around 5,000 potential CORBOX
                                                                        customers in the segment of 100 – 5,000m € revenue
  4 – 6%
                                                                        p.a. in Germany

175
                                                                     ▪ Growth from upselling existing customers
                                                                      ▪ Ca. 10m € increase p.a.
                                                           8 – 12%

125
                                                                     ▪ Growth from M&A activities
                                                                      ▪ 2-3 new acquisitions per year on average
■ Anorganic growth
■ Organic growth from upselling existing customers
75
■ Organic
     14/15 growth through
              15/16       new customer
                       16/17   17/18     acquisition
                                         18/19    19/20   20/21

IT's that simple.                                                                                   Analyst presentation 02/21 (6) | 32
Scenarios incl. Acquisitions and Upselling
Growth Always in Line With Projections

Revenues €m                                                                    Ambition by 22/23:
500                                                                            ▪ > 15% EBITDA
                                                                               ▪ > 9% EBIT
400

300

200                                                                            ■ min. CORBOX revenues
                                                                               ■ max. CORBOX revenues
100                                                                            ■ realized revenues
                                                                               ■ other revenues except
                                                                                  CORBOX
  0
          13/14     14/15   15/16   16/17   17/18   18/19   19/20   20/21(e)   Fiscal Year 01.10 – 30.09.

IT's that simple.                                                                  Analyst presentation 02/21 (6) | 33
M&A-History

Messerknecht                 Arxes                        Consinto                      HanseCom                      UBL
(120 employees), Oct. 2006   (380 employees), Apr. 2010   (350 employees), Feb. 2012    (70 employees), May 2017      (70 employees), Apr. 2019

Hamann und Feil              Ptecs                        Excelsis                      ikb Data                      IT-Informatik
(20 employees), Oct. 2007    (50 employees), Oct. 2010    (50 employees), Oct. 2014     (72 employees), Aug. 2017     (300 employees), Aug. 2019

EGT IS und ICP               BGS                          Vega                          ALMATO
(40 employees), Jan. 2007    (120 employees), Jan. 2011   (120 employees), Aug. 2015    (40 employees), Jan. 2018

Corporate Express            DATAGROUP IT Solutions       HP Enterprise                                               Mercoline
(20 employees), Nov. 2007    (20 employees), Sept. 2011   (306 employees), Sept. 2016                                 (60 employees), Aug. 2019

Best Computer Support        DATAGROUP Consulting                                                                     Portavis
(30 employees), Jan. 2008    (10 employees), Sept. 2011                                                               (200 employees), Mar. 2020

Hanseatische Datentechnik    PC-Feuerwehr
                                                                                                                      Cloudeteer
(150 employees), Jan. 2008   (10 employees), Jan. 2012
                                                                                                                      (29 employees), June 2020

bte bürotechnik eggert
(10 employees), July 2008

IT's that simple.                                                                                                   Analyst presentation 02/21 (6) | 34
Realized Purchase Price Multiples

Company                   Price of       Multiples at date     Company                          Price of               Multiples at date
(Years of acquisition:   acquisition      of acquisition       (Years of acquisition:          acquisition              of acquisition
2006 – 2020)                (net)                              2006 – 2020)                       (net)
                            In k€      EBITDA          EBIT                                       In k€            EBITDA            EBIT
Company 1                  1,460        1.8             2.1    Company 15                        19,649               4.1             4.9
Company 2                   869         2.9             3.0    Company 16                         5,758               4.6             5.4
Company 3                   280         1.4             1.9    Company 17                         -6,147
Company 4                   282         3.5             4.7    Company 18                          -54               -0.1            -0.1
Company 5                    0          2.0             2.0    Company 19                         9,906               2.2             5.5
Company 6                   289         1.5             1.5    Company 20                         6,829               6.6             7.3
Company 7                  13,199       4.7             4.9    Company 21                        16,617               5.0             6.3
Company 8                    0          3.0             3.0    Company 22                         1,500               3.8             5.2
Company 9                   477         2.7             2.4    Company 23                         1,575               3.0             6.0
Company 10                  436         1.2             2.0    Company 24                        -19,049
Company 11                 1,031        1.1             1.1    Multiples average                                      3.3             4.0
Company 12                 5,710        8.3             8.4
Company 13                  898         5.2             5.5   Prices are rising
                                                              Maximum paid until now: 8.4 times EBIT
Company 14                  247                               Further acquisitions in pipeline

IT's that simple.                                                                                            Analyst presentation 02/21 (6) | 35
Our Latest Acquisition: Cloudeteer GmbH

                    ▪ DATAGROUP acquires a stake of 24 % in Cloudeteer, a cloud native start-up, and
                      secures option for 76% of the company’s shares.
                    ▪ The start-up has in-depth expertise in public cloud solutions as well as in consulting
                      on the cloudification of companies, IT governance and IT security in the public cloud.
                    ▪ It also develops its own process and software solutions for the cloud, including the
                      so-called OPS.Stack, for instance for the analysis and optimization of hybrid as well
                      as private cloud solutions.
                    ▪ The cooperation has already proved a great success in 4 joint projects, amongst
                      others in the public cloud introduction for ForstBW and Hamburger Hochbahn.
                    ▪ Cloudeteer is a young and agile company. The cloud expert has 29 employees and
                      generated revenue of more than € 1m in 2019.
                    ▪ Contrary to previous acquisitions, Cloudeteer will keep its start-up structure in order
                      to cover strongly growing customer requirements in the public cloud market as a
                      flexible speedboat.

IT's that simple.                                                                  Analyst presentation 02/21 (6) | 36
Acquisition No. 24
Diebold Nixdorf Portavis
                    ▪ DATAGROUP has acquired 100% of the shares in Diebold Nixdorf Portavis.
                      The company acquired the remaining 7% of shares from Sparkasse Bremen on
                      22.12.2020.
                    ▪ Portavis is an experienced service provider for IT services in the financial services
                      sector.
                    ▪ Support of Hamburger Sparkasse AG, Sparkasse Bremen and Hamburg
                      Commercial Bank on the basis of long-term service agreements.
                    ▪ With Portavis, we expand our existing sector know-how and our customer
                      relationships in the financial sector and can establish ourselves in the market even
                      stronger as bank-independent operational service provider for bank IT operations.
                    ▪ Portavis has c. 200 employees and is expected to generate revenue of some
                      € 66m in the current fiscal year (some € 35m will be consolidated in
                      DATAGROUP’s fiscal year).
                    ▪ Portavis is currently well above the expected EBIT margin of 4%, medium-term
                      target >10%.
IT's that simple.                                                                 Analyst presentation 02/21 (6) | 37
IT’s worth it.
Share Information

                    Anhang
DATAGROUP Share vs. Indices and Peer Group

In %                                                                                                        Ratings
                                                                               € 63.60 (Status: 19.02.21)   Berenberg
6,500                                                                                                       75.00€, Buy
         ■   DATAGROUP share
6,000                                                                                                       Stifel Europe
         ■   All for One
                                                                                                            70.00€, Buy
5,500
         ■   Cancom
5,000
         ■   Bechtle
                                                                                                            M.M. Warburg Research
                                                                                                            60.00€, Buy
4,500
         ■   TecDAX
4,000
         ■   DAX                                                                                            Baader Helvea
3,500                                                                                                       35.00€, Sell
3,000                                                                                                       Quirin Private Bank
2,500                                                                                                       65.80€, Buy
2,000                                                                                                       Hauck & Aufhäuser
1,500                                                                                                       87.00€, Buy
1,000                                                                                                       Edison
 500                                                                                                        Qualitative analysis
    0
     2009     2010     2011   2012   2013   2014   2015   2016   2017   2018   2019      2020       2021

IT's that simple.                                                                                              Analyst presentation 02/21 (6) | 39
Our Commitment to the Environment, Social Affairs and
Corporate Governance

                                     ▪ Publication of an ESG report for the first time
                                     ▪ We give insight into our leitmotifs and principles of
                                       sustainable business management, our activities for
                                       the protection of the environment and selected social
                                       projects that support our employees

                                      „As a company, we see ourselves as part of society. We
                                                are responsible for our employees, customers,
                                       investors and fellow human beings. We want to live up
                                           to this responsibility, both internally and externally."

                                                                       Max H.-H. Schaber, CEO

IT's that simple.                                                       Analyst presentation 02/21 (6) | 40
Management Share Purchases Underline Share Price Potential

                    Date       Notifiable person   Function            Type of         Amount in €                Pcs.
                                                                       transaction

                    28.01.21   Andreas Baresel     Board Member        Buy                   45,360                700

                    12.03.20   Hubert Deutsch      Supervisory Board   Buy                    4,255                100

                    23.03.20   Max Schaber         CEO                 Buy                 399,230              10,000

                    14.10.20   Max Schaber         CEO                 Buy                 234,999               5,000

                    17.10.20   Andreas Baresel     Board Member        Buy                   17,500                400

                    18.10.20   Andreas Baresel     Board Member        Buy                   70,300              1,600

                    18.11.20   Dirk Peters         Board Member        Sell               9,046,452            196,662

                    18.11.20   Max Schaber         CEO                 Buy                9,046,452            196,662

                    20.11.20   Dirk Peters         Board Member        Sell                368,000               8,000

                    20.11.20   Andreas Baresel     Board Member        Buy                 368,000               8,000

IT's that simple.                                                                    Analyst presentation 02/21 (6) | 41
Shareholder Structure and Stock
                                                                           Key Investment Data
              4.1
                                                                           ▪ Total number of shares: 8,349,000
                                                                           ▪ Capital stock:             8,349,000.00 €

225                              53.9                                      Trade Data:
42
                                         ■ HHS Beteiligungsges. mbH        ▪ Stock market segment: Open Market under inclusion in the segment Scale of
                                             (Max H.-H. Schaber)                                   the Frankfurt Stock Exchange

                                         ■ Executives / Advisory Board /   ▪ Stock market abbr.:
                                                                           ▪ WKN:
                                                                                                        D6H
                                                                                                        A0JC8S
                                             Management
175                                                                        ▪ ISIN:                      DE000A0JC8S7
                                         ■ Free float                      ▪ Stock market locations: Frankfurt, XETRA, Stuttgart, Munich,
                                                                                                     Düsseldorf, Berlin-Bremen
 Investor                                                    Percent %     ▪ Designated Sponsor:        Hauck & Aufhäuser Privatbankiers AG, HSBC
 Deutsche Bank AG                                              3.49                                     Trinkaus & Burkhardt AG
 Montagu Private Equity                                        2.24
125
 Taaleri Wealth Management                                     1.20
                                                                           IPO
                                                                           ▪ Initial public offering:   14. September 2006
 Massachusetts Mutual                                          0.63
                                                                           ▪ Issue price:               3.20 €
 Allianz SE                                                    0.57
 Mandatum Life Fund                                            0.55        Share
 Falcon Fund Management                                        0.54        ▪ Share value:               63.60 € (19.02.21)
 75
 KCB Group
       14/15    15/16     16/17     17/18    18/19   19/20     0.51
                                                                20/21      ▪ Market Cap:                531.0m € (19.02.21)
* Hauck & Aufhäuser - Report, January 2021
IT's that simple.                                                                                                             Analyst presentation 02/21 (6) | 42
Upcoming Events

                    ▪ 01.03.21       Hauck & Aufhäuser Digital Roadshow
                    ▪ 04.03.21       Annual general shareholder meeting
                    ▪ 17.03.21       Berenberg DACH Nordic Conference
                    ▪ 20.04.21       Pareto Securities German TechITService Conference
                    ▪ 11.05.21       Stifel German SMID Cap One-on-One Forum, Frankfurt
                    ▪ 17.-19.05.21   Equity Forum Spring Conference
                    ▪ 25.05.21       Publication of Q2 figures and HY report
                    ▪ 10.06.21       Warburg Highlights Conference
                    ▪ 10.06.21       Quirin Conference
                    ▪ 24.08.21       Publication of Q3 figures
                    ▪ 20.-22.09.21   Berenberg German Corporate Conference
                    ▪ 23.11.21       Publication of the preliminary figures for the fiscal year 20/21

IT's that simple.                                                                      Analyst presentation 02/21 (6) | 43
Contact Information

                      Claudia Erning
                      Investor Relations

                      T +49 7127 970 015
                      M +49 160 968 98171
                      Claudia.Erning@datagroup.de

                      DATAGROUP SE
                      Wilhelm-Schickard-Straße 7
                      72124 Pliezhausen
                      datagroup.de

                                                    Analyst presentation 02/21 (6) | 44
IT’s that promising.
Appendixes
IT’s that empowering.
Fiscal Year 19/20
Selected Profit and Loss Statement Figures Fiscal Year 19/20
 Figures in € thousand                            18/19          19/20    Changes

 Revenues                                        306,765        358,211    16.8%
 Other own work capitalized                        777           1,743    124.3%    ▪ EBITDA contains 11.6m €
 Change of capitalized contractual costs         14,303
                                                          1)
                                                                 7,274    -49.1%      purchase price bargain
 Total revenues                                  321,845        367,228    14.1%      from Portavis acquisition
    Material expenses / expenses for purchased
    services
                                                 105,447
                                                           1)
                                                                119,143    13.0%    ▪ Risk provisions of
 Gross profit                                    216,398        248,085    14.6%      12.0m € burden earnings
                                                           1)
    Personnel expenses                           153,241        187,991    22.7%    ▪ Net income burdened by
 EBITDA before risk provisions                    46,881        53,807     14.8%
                                                                                      tax effect which
 EBITDA after risk provisions                     46,881        41,807    -10.8%
                                                                                      presumably will reverse
 EBIT before risk provisions                      23,626        20,988    -11.2%
                                                                                      in the coming year
 EBIT after risk provisions                       23,626         8,988    -62.0%
    Financial result                              -1,936        -2,375     22.7%
 Risk provisions financial services sector          0           12,000     0.0%
 EBT                                              21,690         6,613    -69.5%
                                                                                    1)8.1m € from personnel expenses and
 Net income                                       14,514         249      -98.3%    6.2m € from material expenses were
 EPS (in €)                                        1.74          0.03     -98.3%    reclassified to “Changes in capitalized
                                                                                    contract costs“.
 EPS before risk provision                         1.74          1.47     -15.5%

IT's that simple.                                                                        Analyst presentation 02/21 (6) | 47
Selected Key Balance Sheet Figures Fiscal Year 19/20
 Figures in € thousand                                                           18/19        19/20    Changes

 Goodwill                                                                       64,027       62,501     -2.4%
 Long-term financial liabilities                                               157,009       206,019    31.1%
                                                                                                                 ▪ SSD repayment (7.5m €)
    thereof liabilities to financial institutions                               90,358       78,163    -13.5%      reduces financial liabilities
    thereof liabilities from finance leases                                     23,533       42,664     81.3%    ▪ Pension provisions
    thereof pension provisions                                                  37,702       72,790     93.1%      increased due to Portavis
 Short-term liabilities                                                         89,022       113,181    27.1%
    thereof liabilities to financial institutions                                8,729       12,314     41.1%
                                                                                                                 ▪ Leasing agreement BFL
    thereof liabilities from finance lease                                       8,754       15,945     82.1%      (13.5m €) and new rental
 Cash and cash equivalents                                                      47,465       63,937     34.7%      agreements in Mainz, Ulm
 Accounts receivable                                                            45,591       41,255     -9.5%      and Frankfurt (10.5m €)
 Accounts payable                                                                9,126       12,491     36.9%      increased finance lease
 Net financial debt (short and long term)                                       65,745       63,044     -4.1%      liabilities
 Equity ratio1) (in %)                                                           23.4         17.2     -26.5%
                                                                                                                 ▪ Cash in Portavis (35.6m €)
 Return on equity2) (in %)                                                       20.5          0.4     -98.3%
 Balance sheet total                                                           320,077       385,352    20.4%    ▪ Balance sheet total up
1) Modified equity ratio incl. quasi-           2) ROE = surplus (extrapolated for
                                                                                                                   because of Portavis
   equity funds                                    the entire year) / average equity ratio

IT's that simple.                                                                                                   Analyst presentation 02/21 (6) | 48
Cash Flow from Investing Activities Fiscal Year 19/20
 Figures in € thousand                                              18/19            19/20        Changes

 Cash inflow from sale of property, plant and equipment          140,869.45       754,130.18      435.34%    ▪ Capex influenced by the
 Cash outflow for investment in property, plant and equipment   -15,610,402.02   -17,002,404.79    8.92%
                                                                                                               projects OneERP and
                                                                                                               OneHR
 Cash inflow from intangible assets                               17,151.27        22,621.79      31.90%
                                                                                                             ▪ By acquisition of Portavis
 Cash outflow for investments in intangible assets              -3,061,652.10    -5,237,681.03    71.07%       DATAGROUP received
 Cash inflow from sale of financial assets                       343,675.40      -1,349,523.51    -492.67%     35.6m € net (acquired
 Cash outflow for investments in financial assets               -1,039,750.00     -269,450.04      -74.09      cash less price of
                                                                                                               acquisition)
 Cash inflow from repayment of financial assets                     0.00          100,011.49         ./.

 Cash inflow / outflow from investments in fully
                                                                -21,715,884.73   35,554,765.15    -263.73%
 consolidated companies

 Interest received                                               359,213.98        22,281.79      -93.80%

 Net cash used for investing activities                         -40,566,778.75   12,594,751.03    -131.05%

IT's that simple.                                                                                               Analyst presentation 02/21 (6) | 49
Cash Flow from Operating Activities Fiscal Year 19/20
 Figures in € thousand                                                     18/19            19/20        Changes

 Net income for the period                                             14,513,915.52     248,735.90      -98.29%
                                                                                                                     ▪ As in the previous year,
 Interest received                                                      -359,213.98      -22,281.79      -93.80%
                                                                                                                       the operating cash flow
 Interest paid                                                         1,138,664.94     1,963,357.76      72.43%
                                                                                                                       was heavily burdened by
 Depreciation and amortisation of non-current assets                   23,337,058.58    32,818,885.14     40.63%
                                                                                                                       the financial services
 Changes in pension provisions                                          795,976.98      1,451,433.79      82.35%
                                                                                                                       division (17.8m € in the
 Gains (-) / losses (+) on disposals of non-current assets               35,937.18       421,012.07      1,071.52%
                                                                                                                       financial year compared
 Increase (-) / decrease (+) of receivables or liabilities to
 shareholders, related and associated companies
                                                                        -294,414.10      -49,202.48      -83.29%       to 15.8m € in the
                                                                                                                       previous year)
 Increase (-) / decrease (+) of inventories, trade receivables and     -47,191,372.88   -4,537,927.85    -90.38%
 other assets
                                                                                                                     ▪ The sale of receivables
 Increase (+) / decrease (-) of trade payables and other liabilities   12,587,716.75    1,083,863.62     -91.39%       from customers had a
 Income out of business transaction                                        0.00         -11,570,708.49      ./.        cash flow improving
 Other non-cash transactions                                             -41,795.80      -122,744.65     193.68%       effect of 13.4m €
Cash flow from operating activities                                    4,522,473.19     21,684,423.01    379.48%

IT's that simple.                                                                                                      Analyst presentation 02/21 (6) | 50
Development of EPS and Dividend

EPS and dividend 10/11 – 19/20 cents                                                                           Our dividend policy:
                                                                                                               ca. 30 – 40% of net profit
 180                                                                                      174
                                                                                                               EPS burdened by one-off
                                                                               155                   147       losses and risk provisions in
 150                                                                141
                                                                                                               the financial services sector
 120                                                                                                           Proposal to AGM on March
                                                                                                               4th 2021 to retain profits in
  90                                                                                                           full
                                                          75                                    70
          58                                    65                                   60
  60
                                                                          45
                    36
                              25                               30
  30                                                 25
               20        20        20   14 20
                                                                                                               ■ Effects from risk provisions in
    0                                                                                                      3      the financial services sector
          10/11     11/12     12/13     13/14   14/15     15/16     16/17      17/18      18/19      19/20
                                                                                                               Fiscal Year 01.10 – 30.09.

IT's that simple.                                                                                                  Analyst presentation 02/21 (6) | 51
Development in Bank Liabilities

m € Development in bank liabilities (as at 30/09)
225
                             104
 100                 98

                                       88
                                               85

17580                                                    76*
                                                 71*   72
                               64*
                                         59*                     58*
  60
                       47
          4039
12540                                                          36

  20
                                                                        ■ ■ Existing liabilities
                                                                        ■ ■ Cash
 75 0                                                                   * Including cash input from Portavis
        14/15
         17/18      15/16
                     18/19   16/17
                              19/20    17/18 21/22(e)
                                      20/21(e) 18/19 22/23(e)
                                                       19/20 23/24(e)
                                                               20/21    Not taking into account a new borrowing of promissory notes

IT's that simple.                                                                                              Analyst presentation 02/21 (6) | 52
Predicted Development in Amortisation from PPA

Development in amortisation from PPA 19/20 – 23/24e €m
225
 5        4.7
                          4.6

 4
                                       3.5
175
                                                   3.0
 3
                                                               2.6

 2
125

 1

 75
 0                                                                       Figures do not include further acquisitions
        14/15
         19/20      15/1620/2116/17    17/18
                                      21/22    18/19
                                                  22/23 19/20 23/24
                                                                 20/21   Fiscal Year 01.10 – 30.09

IT's that simple.                                                                                                  Analyst presentation 02/21 (6) | 53
Management Board

                    Max H.-H. Schaber                                             Andreas Baresel
                    Chief Executive Officer                                       Chief Production Officer
                    Since Feb. 16, 2006 Mr. Schaber has been a member and         Member of the Management Board (CPO) of DATAGROUP
                    Chairman of the Executive Board (CEO) of DATAGROUP            SE since October 2018. He is responsible for the Production
                    SE and is responsible for the departments Finance, Legal      department. In this role, he oversees the cross-divisional
                    Affairs, Human Resources and Company Development.             management and coordination of the individual service
                                                                                  factories within the group.
                    In 1983 he founded DATAPEC, Company for Data
                    Processing, which later became DATAGROUP GmbH. Max            Following his studies in business administration, Andreas
                    H. H. Schaber studied mechanical engineering at the           Baresel worked in several management positions with a
                    University of Stuttgart as well as at the Universities of     focus on business and portfolio development in IT
                    Applied Sciences in Augsburg and Reutlingen. In 1981 he       consulting and managed IT services.
                    completed his studies as graduate engineer (FH) in
                                                                                  Andreas Baresel joined the company in 2006 in connection
                    Mechanical Engineering and after that he was employed
                                                                                  with the acquisition of DATAGROUP Business Solutions
                    initially as system engineer, and later as assistant to the
                                                                                  GmbH (previously Consinto GmbH) and has been Managing
                    Executive Board of the firm Friedrich und Co. Company for
                                                                                  Director of DATAGROUP Business Solutions GmbH since
                    Software and System Development.
                                                                                  2016.

                    Dirk Peters                                                   Peter Schneck
                    Chief Operation Officer                                       Chief Officer M&A, IR and Legal
                    Since the integration of the company HDT in DATAGROUP         Peter Schneck joined the Executive Board of DATAGROUP
                    in the year 2008, Dirk Peters is Managing Director of         on 01.10.2019. His responsibilities include Investor
                    DATAGROUP Hamburg GmbH (formerly HDT) and active in           Relations, Legal and Mergers & Acquisitions.
                    the management of DATAGROUP SE as COO.
                                                                                  After studying law with a focus on International Business
                    Upon completion of his studies of computer science (FH),      Law and an MBA, Peter Schneck worked as Managing
                    he took over managerial positions at Ashton-Tate and at       Director at Scheidt & Bachmann, a leading global provider of
                    ALSO ABC, until he went into business for himself in the      IT solutions for car park management. Subsequently, he was
                    year 1992 with his firm HDT Hanseatic Data Systems            managing director of the parking garage operator APCOA.
                    Technology. Out of a classical system house he then deve-
                                                                                  Prior to joining DATAGROUP, Peter Schneck was CEO of
                    loped a high-performance group of companies in the field of
                                                                                  the Trapeze Group, a transportation company owned by the
                    IT service management. Following his training as an infor-
                                                                                  Canadian company Constellation. In addition to the
                    mation electronics engineer at Lufthansa, Dirk Peters began
                                                                                  operational management of Trapeze, Peter Schneck has
                    his career in 1981 as system technician at one of the first
                                                                                  managed an international portfolio of companies and was
                    authorized IBM contractual partners, the firm Computer-
                                                                                  responsible for the mergers & acquisitions activities.
                    partner in Hamburg. In 1983 he changed over to the sales
                    department and learned the trade at HOSS.

IT's that simple.                                                                       Analyst presentation 02/21 (6) | 54
Supervisory Board

                    Heinz Hilgert                                                           Dr. Carola Wittig
                    Chairman of the Supervisory Board                                       Member of the Supervisory Board
                    CEO and founder of TransVise GmbH, Senior Management                    Presiding Judge at the District Court in Stuttgart.
                    Consulting in the financial services industry.
                                                                                            Alongside her activities at the District Court in Stuttgart, Dr.
                    Before that Mr. Hilgert was CEO of the WestLB in Düssel-                Wittig works as a lecturer at various research institutes for
                    dorf und Deputy CEO of the DZ Bank in Frankfurt. His areas              specialist lawyers, engineers and appraisers. Prior to joining
                    of responsibility included investment banking, private                  civil service, Dr. Wittig worked as a lawyer at Arthur
                    banking and asset management. He held corporate man-                    Andersen Wirtschaftsprüfer Steuerberater GmbH in
                    dates as chairman of the supervisory board of Union Asset               Stuttgart and Dresden. She was responsible for company
                    Management Holding AG, Frankfurt; DZ Privatbank                         law and tax matters in the context of restructurings,
                    Switzerland AG, Zurich; DZ Bank International S.A, Luxem-               acquisitions and MBOs. During her legal activity, Dr. Wittig
                    burg; and Teambank AG, Nuremberg. Before his positions                  also gained experience in IT contract law.
                    at the DZ Bank, Mr. Hilgert held executive positions at Sal.
                                                                                            Dr. Carola Wittig studied law at the Eberhard Karls
                    Oppenheim KGaA, Cologne and Frankfurt as well as at the
                                                                                            Universität in Tübingen.
                    Chase Manhattan Bank N.A., London und Frankfurt. Mr.
                    Hilgert studied business administration at the University of
                    Duisburg.

                    Hubert Deutsch
                    Deputy Chairman of the Supervisory Board
                    CEO of BLANK Holding GmbH, an international industrial com-
                    pany specialized in investment casting.
                    He previously worked as CFO for various companies of the
                    Liebherr Group, amongst others as managing director of the
                    construction machinery division and most recently in the
                    household appliance industry. Hubert Deutsch graduated in
                    business administration (Diplom-Betriebswirt) with a focus on
                    bank and financial management. Following graduation, he also
                    worked as a lecturer at the SRH Mobile University in Riedlingen
                    and the Baden-Württemberg Cooperative State University.
                    Additionally, he holds advisory positions at various start-ups and is
                    Chairman of the University Council of the SRH Mobile University
                    in Riedlingen. He is involved in voluntary work as initiator and
                    Chairman of the Foundation Board of the ProKeeper Akademie
                    and is a member of the Supervisory Board of the Ravensburg
                    football club.

IT's that simple.                                                                                 Analyst presentation 02/21 (6) | 55
Disclaimer

This presentation has been produced by DATAGROUP SE with the sole purpose of providing decision support for the recipient.
This presentation is no prospectus and in no way is intended to be an offer or solicitation to purchase or subscribe to corporate shares or other securities.
This presentation has been produced to the best of our knowledge. However, DATAGROUP assumes no responsibility for the correctness and completion of the
statements explicitly or implicitly made in this presentation. This also applies to any other written or oral statement, which was made to the interested recipient or her/his
consultants. Any liability is expressly excluded.
This presentation contains statements, estimates and projections related to the expected future development. They are based on different assumptions made by the
management of DATAGROUP SE in relation to the expected results and may prove to be true or false depending on the actual development. We assume no liability for the
correctness of these statements. The statements made in this presentation represent only a selection and are therefore not exhaustive. Extensions, modifications or
adjustments are explicitly subject to change. DATAGROUP SE assumes no liability for the correctness of figures and estimates taken from publicly accessible sources that
have been explicitly marked.
This presentation is confidential and may not be redistributed in whole or in part to third parties.
Under no circumstances should employees, representatives, agents, consultants, customers or suppliers of DATAGROUP SE be contacted without prior agreement.

IT's that simple.                                                                                                                          Analyst presentation 02/21 (6) | 56
You can also read