INVESTOR PRESENTATION - H&R Block
←
→
Page content transcription
If your browser does not render page correctly, please read the page content below
I N V E S TO R P R E S E N TAT I O N
JUNE 2020
Safe Harbor Statement
Forward-Looking Statements
This presentation contains forward-looking statements within the meaning of the securities laws. Forward-looking statements can be identified by the fact that they do not relate strictly to
historical or current facts. They often include words or variation of words such as "expects," "anticipates," "intends," "plans," "believes," "commits," "seeks," "estimates," "projects," "forecasts,"
"targets," "would," "will," "should," "goal," "could," "may," or other similar expressions. Forward-looking statements provide management's current expectations or predictions of future conditions,
events or results. All statements that address operating performance, events or developments that we expect or anticipate will occur in the future are forward-looking statements. They may
include estimates of revenues, client trajectory, income, effective tax rate, earnings per share, cost savings, capital expenditures, dividends, share repurchases, liquidity, capital structure, market
share, industry volumes, or other financial items, descriptions of management’s plans or objectives for future operations, products or services, or descriptions of assumptions underlying any of
the above. They also include the expected impact of the coronavirus (COVID-19) emergency, including, without limitation, the impact on economic and financial markets, the Company’s capital
resources and financial condition, the expected use of proceeds under the Company’s revolving credit facility, future expenditures, potential regulatory actions, such as extensions of tax filing
deadlines or other related relief, changes in consumer behaviors and modifications to the Company’s operations related thereto. All forward-looking statements speak only as of the date they
are made and reflect the Company's good faith beliefs, assumptions and expectations, but they are not guarantees of future performance or events. Furthermore, the company disclaims any
obligation to publicly update or revise any forward-looking statement to reflect changes in underlying assumptions, factors, or expectations, new information, data or methods, future events or
other changes, except as required by law. By their nature, forward-looking statements are subject to risks and uncertainties that could cause actual results to differ materially from those
suggested by the forward-looking statements. Factors that might cause such differences include, but are not limited to a variety of economic, competitive, and regulatory factors, many of which
are beyond the Company's control, that are described in our Annual Report on Form 10-K for the most recently completed fiscal year in the section entitled "Risk Factors" and additional factors
we may describe from time to time in other filings with the Securities and Exchange Commission. You may get such filings for free at our website at http://investors.hrblock.com. You should
understand that it is not possible to predict or identify all such factors and, consequently, you should not consider any such list to be a complete set of all potential risks or uncertainties.
Non-GAAP Measures
We refer to certain Non-GAAP financial measures in this presentation, including earnings from continuing operations before interest, taxes, depreciation, and amortization (“EBITDA”), EBITDA
Margin from continuing operations, calculated as EBITDA from continuing operations divided by revenues from continuing operations (“EBITDA Margin”), adjusted diluted earnings per share
from continuing operations, and free cash flow. Non-GAAP financial measures should not be considered as a substitute for, or superior to, measures of financial performance prepared in
accordance with accounting principles generally accepted in the United States (GAAP). Because these measures are not measures of financial performance under GAAP and are susceptible to
varying calculations, they may not be comparable to similarly titled measures for other companies. For a description of these non-GAAP financial measures, including the reasons management
uses each measure, and reconciliations of these non-GAAP financial measures to the most directly comparable financial measures prepared in accordance with GAAP, please refer to
previously filed press releases posted on our investor relations website at http://investors.hrblock.com.
Market and Industry Data
The data included in this presentation regarding the tax preparation services industry, including trends in the market and the company's position and the position of its competitors within this
industry, are based on the company's estimates, which have been derived from management’s knowledge and experience in the industry, and information obtained from customers, trade and
business organizations, internal research, publicly available information, industry publications and surveys and other contacts in the industry. The company has also cited information compiled
by industry publications, governmental agencies and publicly available sources. Although the company believes these third-party sources to be reliable, it has not independently verified the data
obtained from these sources and it cannot assure you of the accuracy or completeness of the data. Estimates of market size and relative positions in a market are difficult to develop and
inherently uncertain and the company cannot assure you that it is accurate. Accordingly, you should not place undue weight on the industry and market share data presented in this
presentation.

H&R Block profile
• Founded the tax industry in 1955
• Well-established tax operations in the U.S., Canada, and Australia
• Over 20 million returns filed by or through H&R Block in fiscal 2020 which represents a partial tax
season; over 23 million returns in fiscal 2019
• Average revenues of $3 billion and average free cash flow of $440 million over the last five fiscal
years
• Tremendous scale with ~70,000 highly trained tax professionals in ~11,000 offices globally
• ~8,000 Enrolled Agents and CPAs in the U.S.
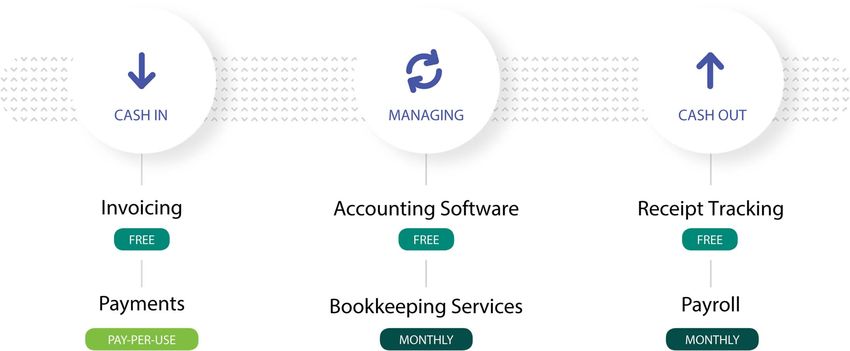
Offerings & Products
Tax Small Business Products
Leader in the tax industry with Accelerating small business Adjacent Tax Plus products
broad spectrum of offerings strategy with acquisition of Wave (prepaid debit card, lending, tax
ranging from in-office Assisted to Financial fraud protection, other) provide
DIY additional value to clients
2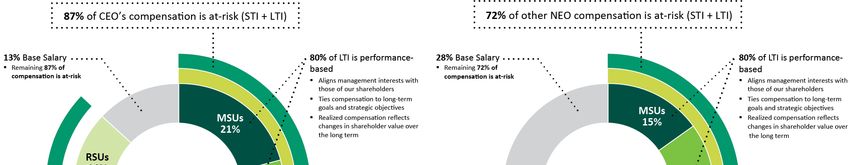
Investment thesis

1. Market-leading position in tax with       • Complete ecosystem and scaled network in the expansive, established tax
   unmatched competencies                      industry

                                             • Proprietary multi-channel approach to take advantage of opportunities in
2. Significant addressable market
                                               $21B tax industry

3. Ongoing retention and growth              • Transforming the Assisted value proposition and driving innovation in DIY to
   initiatives                                 support and grow robust customer base

                                             • Executing at the convergence of personalized service and digital expertise
4. Positioned to win in the long term
                                               to capture the new frontier

5. Expanding capabilities in large and       • Acquisition of Wave, a rapidly growing financial solutions platform, provides
   expanding small business market             new growth opportunities

                                             • Strong cash generation and fortified balance sheet support strategic
6. Robust financial profile and attractive     initiatives as well as capital return through dividends and opportunistic share
   capital allocation                          repurchases

                                                                                                                                 3
Tax season 2020

An unprecedented tax season
• Tax season 2020 has been unlike any other season due to the COVID-19 pandemic

• Significant changes to tax filing behaviors due to stay-at-home orders in various state and local jurisdictions

• Industry-wide tax filings are delayed due to the extension of the filing deadline to July 15th

                                          Financial Impacts to H&R Block
• Tax season 2020 will be split between FY20 and FY21, impacting comparability

• The shift in business will result in some revenues and expenses moving from Q4 FY20 to Q1 FY21

• While difficult to predict given the ever-changing landscape, we expect additional expenses in Q1 FY21 related to tax
  pro compensation and benefits, bad debt, and marketing expense

• We’ve drawn $2.0B on our line of credit to enhance our liquidity and ensure maximum flexibility, which will result in
  additional interest expense

• We are actively evaluating cost savings opportunities across our business to offset expense increases and invest in
  strategic initiatives

• Will provide an updated on the tax season as part of our Q1 earnings call in September; will provide financial outlook
  part of our fiscal Q2 earnings call in December

                                                                                                                           5
H&R Block’s operational response

      Quickly turned to our crisis playbook to effectively and efficiently respond when the
      pandemic started to impact our business

      Significantly modified our operating model to comply with ever-changing city and state
      guidelines, including transitioning to primarily drop-off services in our retail locations

      Further accelerated the digital enablement of our business, resulting in dramatic increases
      in returns leveraging our digital capabilities

      Implemented a tax professional work-from-home model, allowing thousands of our tax pros
      to prepare returns outside of the office

      Invested in a leading benefit program for our seasonal associates who were impacted by
      the pandemic

      We’ve kept more of our offices open with increased operating hours and tax pro staffing
      during Q1 FY21
                                                                                                    6
H&R Block’s community response

Joined American Express      Provided Wave payments        Offered free tax preparation
 Stand For Small to help    customers with free Instant    via Tax Pro Go for frontline
support small businesses   Payouts, giving entrepreneurs    workers in May and June
                            quick access to their cash

                                                                                          7
Efforts to digitally enable every aspect of our business
is driving key improvements

Growth in digitally-   Significant increases in returns leveraging our digital capabilities, including Tax Pro
 enabled returns       GoSM, Tax Pro ReviewSM, and our Approve Online feature

   Strong client       Strong client feedback with service quality scores improving 2 points in Assisted and 5
     feedback          points in DIY, building on significant improvements in FY19

    Third-party        A number of third-party accolades for our DIY product, including #1 in TheStreet.com’s
    accolades          rankings of the best online software and NerdWallet’s best software for simple returns

  Wave revenue         Wave revenue growth of over 40% prior to the pandemic
    growth

                                                                                                                 8
Our path forward
Accelerating our transformation and driving change

• Our work to digitally enable our business is essential to our success in the long term as we
  launch innovative new products, modernize how we deliver expertise and care, and ensure the
  best-trained tax professionals in the industry can help clients in better and easier ways

• Our efforts were accelerated in FY20 as a result of the pandemic and allowed us to meet the
  needs of our clients using methods we didn’t have in the past

• Ongoing work to reprioritize our strategic imperatives while simultaneously examining our
  expense structure to identify savings to fund the future

                                                                                                 10
Our strategic framework continues to guide us
11Tax industry rooted in size and growth
Taxpayers choose level of help based on their
confidence with taxes

 Assisted                                                                                  Do-It-Yourself (DIY)

    LOW                                     Taxpayer’s Confidence with Taxes                                    HIGH

          “I want someone to do it for me”                                           “I can do it”

 • Assisted category remains resilient as a large portion       • DIY filers prefer convenience, cost, and are confident
   of the population isn’t confident in preparing their own       they can do it
   taxes
                                                                • DIY consists of two sub-categories: Digital and Pen &
 • Assisted filers are concerned about getting the                Paper
   maximum refund, are afraid of being audited, or don’t
   feel like they have the time or the knowledge to deal
   with filing taxes

                                                                                                                           13
Assisted tax preparation methods remain the choice of
over half of U.S. taxpayers
• Tax season 2020, which is yet to be completed, currently reflects a greater mix shift to DIY due to changing consumer
behaviors as a result of COVID-19
─ Mix shift average 40-50 bps for the last three years
─ Despite conditions that could have contributed to a significant mix shift in tax season 2020, the shift through early June was
just under 300 bps and will likely moderate toward the conclusion of the tax season
• Taxpayer survey indicates that many of those who switched channels this tax season will revert back to the way they
filed taxes prior to the pandemic
100%
80% Assisted
60%
40% DIY Pen & Paper
20%
DIY Online
DIY Desktop
0%
2011 2012 2013 2014 2015 2016 2017 2018 2019
How Americans file their taxes
Source: IRS data; DIY online category comprised of online, Free File and mobile.
14Addressable market is significant in both Assisted and
DIY
60M
Assisted
$21B 137M
$18.3B $2.6B Filing
Market Size DIY
population
77M
• Data reflects tax season 2019 which is the most recent completed season
• Addressable market is large; Assisted share of industry revenue is dominant at 87%
• Assisted return growth in two of past four years; consistent year-over-year DIY return growth
• Assisted category is highly fragmented; peers have limited resources; DIY category has low fragmentation with well-
resourced peers
Source: IRS data and H&R Block estimates.
15U.S. tax industry is stable and resilient; both Assisted
and DIY tax prep methods remain strong
• On average, total U.S. filings grow ~1% annually and are highly correlated to non-farm employment
• Both the Assisted and DIY categories are growing, though current unemployment levels may result
in a change in this trend in the near term
• Within DIY, growth in tax software (2002-2019 CAGR of 9%) has primarily resulted from the decline
in pen and paper filings
CAGR: 0.9%
150
Total filings
120
90 Assisted CAGR: 0.4%
60 DIY
CAGR: 1.8%
30
0
2002 2003 2004 2005 2006 2007 2008 2009 2010 2011 2012 2013 2014 2015 2016 2017 2018 2019
U.S. tax filings (in millions)
Source: H&R Block estimates of market participant and IRS data. Represents tax season data.
16Unemployment in 2020 may impact tax season 2021
filings
150
• Current unemployment levels may impact industry filing
growth in the near future
145
• The most recent recession impacted the following two tax
filings seasons
140
─ For the two year period following the start of the recession
(TS09-TS10), there was a ~6% decline in employment which
resulted in ~2% decline in returns 135
• There are many reasons why filings may not be impacted at
130
the same rate as unemployment for tax season 2021
1. Married-filing-jointly filers may only have one person with lost
125
income
2. Partial income for 2020 given the pandemic didn’t start
120
impacting most businesses until March 2006 2007 2008 2009 2010 2011 2012 2013 2014
3. Filers may be required to file due to unemployment wages Industry Returns Non-Farm Employment
4. A number of filers with no employment income file a return to
claim certain credits U.S. tax filings and non-farm employment
(both in millions)
Source: H&R Block estimates of market participant and IRS data. Represents tax season data.
17Foundational strengths
Market-leading positions across traditional tax prep
methods

                                        Assisted                                                                  DIY

                                   14.5%                                                                     14.9%
                          TS19 H&R Block Assisted                                                       TS19 H&R Block DIY Market
                               Market Share                                                                      Share

                                          #1                                                                    #2
                                   Industry Rank                                                             Industry Rank

Source: H&R Block estimates of market participant and IRS data.
Note: Data reflects tax season 2019 data and will be updated after the conclusion of tax season 2020.
                                                                                                                                    19
Continuing to improve quality, consistency, and value of
our Assisted experience
Led the industry with upfront, Digitized how our tax pros
transparent pricing work through WorkCenter,
enabling best-in-class service
WorkCenter
Enhanced standard operating Increased certification levels
procedures (SOPs) to ensure throughout our expert tax pro
quality and consistency of network, a key differentiator
client experience for H&R Block
20Focused on growing our DIY business
• Leveraged AI and machine learning to remove questions
and steps in the workflow 8.0
8.0
7.5
• Streamlined new client onboarding process with “Switch in 7.2
7.0
Two Clicks” 7.0 6.8
─ Clients can import or upload 98% of their tax documents
6.0
and drag-and-drop prior year returns, making it simple to
switch to H&R Block
5.0
• Improved and actively promoted Online Assist (formerly Ask
a Tax Pro), which provides unlimited, immediate access to a 4.0
tax pro for help along the way
• Maintained challenger strategy by pricing competitively, 3.0
growing awareness, and ensuring price transparency
2.0
• Efforts to drive higher conversion, upgrades, and product FY16 FY17 FY18 FY19 FY20
attach rates
DIY returns
(in millions)
Notes: Excludes Free File. Fiscal year 2020 reflects partial tax season results. 21Innovating to provide expertise and care in new ways
• We continue to digitally enable our business to deliver expertise and
care in new ways as consumer needs evolve
• Our efforts were accelerated as a result of the COVID-19 pandemic
and resulted in a significant increase in the percentage of returns
leveraging our digital capabilities
• Approve Online: Mobile service that allows filers to review their
completed return, approve it, and pay fees
• Tax Pro GoSM: Mobile-first, fully assisted service that provides the
easiest way for consumers to have an expert prepare their taxes
without stepping foot into an office
• Tax Pro ReviewSM: Expert review of online tax return to check for errors and unclaimed credits and deductions
• myBlock: Digital hub of our clients’ experience where they can upload and store their tax documents, access prior
year returns, set appointments, manage their Emerald Card, and use our tax estimator for help with planning
22Tax Plus products provide added value to clients, both
within and beyond tax season
Tax Plus product revenues of $470M in fiscal 2019
H&R BLOCK H&R BLOCK EMERALD
REFUND ADVANCE
EMERALD ADVANCE® PREPAID MASTERCARD®
• Pre-season line of credit up to $1,000 • Interest-free, no-fee loan, up to $3,500 • 3rd largest general purpose reloadable
debit card in U.S.
• ~$400M funded loans; $58M revenue • 1.2M applications, $1.2B funded loans
• $9B total deposits; $98M revenue
REFUND TRANSFER PEACE OF MIND® TAX IDENTITY SHIELD®
• Pay nothing out of pocket for tax prep • Extended service plan includes IRS audit • Protection against tax identity theft
representation
• High attach rates, with 4.7M total • Additional services include dark web scan
units; $170M revenue • Attach rate growth of 9 points in 6 years • 1.3M units sold
to 29%
Notes: Amounts listed for the various products pertain to FY19 given that FY20 financials do not include results for a full tax season. Mastercard is a registered trademark of Mastercard
International Incorporated. 23Enhancing focus on small business
Enhancing focus on Small Business

                               •    Currently serve over 2 million small
                                    business clients in tax

                               •    Refined targeted marketing efforts to
                                    ensure small business owners know the
                                    expertise we provide in tax

                               •    Redesigned tax prep experience and
                                    improved tools to meet the varied needs
                                    of small businesses

                               •    Continue to simplify the financial lives of
                                    small business owners through Wave

                                                                                  25
Wave: A rapidly growing financial solutions platform for
the small business market
Large and Expanding Market Strong Strategic Fit Disruptive Innovator
Acquisition accelerates H&R Block’s small business strategy, providing new growth opportunities
26Wave’s robust platform serves the needs of small
business owners
Low customer acquisition costs combined with recurring revenue stream yields
favorable customer lifetime value
27Wave continues to innovate
Recent product and feature innovations further simplify the financial lives of
entrepreneurs
Wave Money API / Integrations Instant Payouts
• First-to-market, software powered • Opened API to extend functionality • Alleviates cash flow problems for
small business bank account and reach of tools small business owners with
immediate access to funds earned
• No monthly fees or minimums • Released new integrations
• Allows entrepreneurs to run their
• Seamless integration in Wave’s • Partnered with Shopify to launch
businesses better
accounting platform the first direct accounting
integration in the Shopify app store
• Instant access to funds
28Financial results and capital allocation
Significant recurring cash flow

                                                                                           800                                                       $751
    •    Cash-based, capital-light operating                                               700
         model; capital expenditures represent
                                                                                           600
         3% of revenues on average                                                                                                                                            $511
                                                                                           500
                                                                                                         $445                  $463

    •    Consistent generation of significant                                              400
         cash flow, with average free cash flow
                                                                                           300
         before dividends of ~$440 million over
         last five years                                                                   200

                                                                                           100
                                                                                                                                                                                     $27
    •    Model allows for return of capital
                                                                                              0
         returns through dividends and
                                                                                                         FY16                  FY17                  FY18                     FY19   FY20
         opportunistic share repurchases
                                                                                                    Free Cash Flow1
                                                                                                    (in millions)

1Free cash flow is a non-GAAP financial measure. Please see the Safe Harbor Statement at the beginning of this presentation for information on non-GAAP financial measures.
Note: Fiscal year 2020 reflects partial tax season results.                                                                                                                                 30
Capital allocation focused on driving sustainable growth
and creating shareholder value
Capital Allocation Priorities
Maintain adequate liquidity and strong balance sheet
1
• Short-term funding provided through $2.0B line of credit maturing in September 2023
• Commitment to maintain Investment Grade credit rating metrics
• In late March we drew the full $2.0B to strengthen our liquidity and provide maximum flexibility
Invest for sustainable growth
2
• Disciplined and innovation-focused investments around client experience and operational excellence
• Technological upgrades to drive greater efficiencies and reduce cost structure over time
• Investment in the small business category to provide future growth opportunity
3 Return excess capital to shareholders
• Regular annual review of dividend policy; 30% increase since fiscal 2016; current yield of 6.4%1
• Committed to repurchase shares to offset dilution; given current environment, have not yet determined
fiscal 2021 share repurchase approach
• Repurchased 15% of float since fiscal 2017 at an average price of ~$23
1 As of June 18, 2020. 31Balanced return of capital through dividends and share
repurchases
Dividends Share Repurchases
+30% $247M
Dividend increase since FY16 Share repurchases FY20
6.4% 15%
Current dividend yield1 Shares outstanding repurchased
FY17 – FY20
1 As of June 18, 2020. 32Environmental, Social and Governance
Commitment to our communities through Make Every
Block Better
     In December 2019, H&R Block launched a new community impact platform, Make Every Block Better,
               that focuses on increasing human connections, supporting entrepreneurship,
                               and combating loneliness in our communities

                                                                                           Urban Neighborhood
     KCRise Fund II                   Nextdoor               Habitat for Humanity
                                                                                                Initiative
 $2M investment over the       Partnership to complete      Committed to fund 16 local      Funded a grant to host
  next five years in high-        nomination-based            grants as part of HFH’s     community-building events
    growth, early-stage       neighborhood improvement      neighborhood revitalization     and repair homes in an
  technology companies                 projects                       efforts                 underserved areas

     The Kauffman                                             Community Disaster           Hardship and Disaster
                              Associate Volunteering
      Foundation                                                   Relief                       Relief Fund
Partnership to explore ways    Associates led multiple      Donated time and funds to       Established fund to help
 to impact entrepreneurial      efforts to identify and       disasters such as the       associates overcome short-
ecosystems throughout the     support local nonprofits in    Australian bushfires and      term financial challenges
     H&R Block network            their communities         COVID-19 global pandemic

In FY20, H&R Block and our associates donated more than $2 million in support of community building efforts,
                               supporting entrepreneurs, and in direct relief

                                                                                                                       34
Proactive and sound governance practices
Robust shareholder
engagement policy
Committed to pay-for- Commitment to diversity of
performance culture and skills, perspectives, and
shareholder alignment experiences of Board
members
All directors, other than CEO,
Annual director election are independent, including an
independent Chairman
Board actively involved in
succession planning and has Annual Board self-evaluation
balanced oversight on administered by third party
strategic planning
Commitment to improving and
expanding ESG disclosures
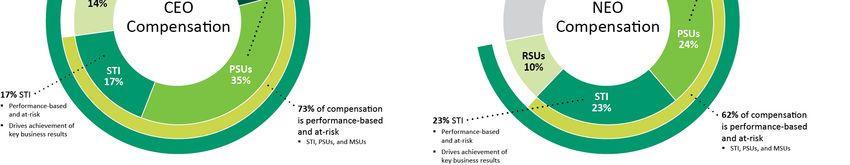
35Executive pay aligns with shareholder value
• Our executive compensation decisions are influenced by a variety of factors, with the primary goals being to align
management’s and shareholders’ interests and to link pay with performance
• A significant portion of our executives’ compensation is “at-risk” and dependent upon the Company’s short and long-
term financial, operational, and strategic performance, as well as increases in the Company’s stock price
Note: Represent FY19 data. 36Investment thesis
Investment thesis

1. Market-leading position in tax with       • Complete ecosystem and scaled network in the expansive, established tax
   unmatched competencies                      industry

                                             • Proprietary multi-channel approach to take advantage of opportunities in
2. Significant addressable market
                                               $21B tax industry

3. Ongoing retention and growth              • Transforming the Assisted value proposition and driving innovation in DIY to
   initiatives                                 support and grow robust customer base

                                             • Executing at the convergence of personalized service and digital expertise
4. Positioned to win in the long term
                                               to capture the new frontier

5. Expanding capabilities in large and       • Acquisition of Wave, a rapidly growing financial solutions platform, provides
   expanding small business market             new growth opportunities

                                             • Strong cash generation and fortified balance sheet support strategic
6. Robust financial profile and attractive     initiatives as well as capital return through dividends and opportunistic share
   capital allocation                          repurchases

                                                                                                                                 38
Appendix
Tax operating statistics
Fiscal year 2020 reflects partial tax season data, impacting comparability
OPERATING STATISTICS
Year ended April 30, 2020 2019 % Change
(Partial tax filing
season, extension to (Full tax filing season)
July 15th)
TAX RETURNS PREPARED: (in 000s) (1)
United States:
Company‐owned operations 6,745 8,033 (16.0 )%
Franchise operations 2,798 3,583 (21.9 )%
Total assisted 9,543 11,616 (17.8 )%
Desktop 1,500 1,969 (23.8 )%
Online 5,700 6,012 (5.2 )%
Total DIY 7,200 7,981 (9.8 )%
IRS Free File 845 665 27.1 %
Total U.S. returns 17,588 20,262 (13.2 )%
International operations
Canada 1,908 2,465 (22.6 )%
Australia 745 747 (0.3 )%
Other 73 142 (48.6 )%
Total international returns 2,726 3,354 (18.7 )%
Tax returns prepared worldwide 20,314 23,616 (14.0 )%
NET AVERAGE CHARGE (U.S. ONLY): (2)
Company‐owned operations $ 227.83 $ 231.6 (1.6 )%
Franchise operations (3) 217.07 216.61 0.2 %
DIY 29.01 32.59 (11.0 )%
TAX OFFICES (as of January 31):
U.S. offices:
Company‐owned offices 6,552 6,356 3.1 %
Franchise offices 2,909 3,148 (7.6 )%
Total U.S. offices 9,461 9,504 (0.5 )%
International offices:
Canada 1,086 1,116 (2.7 )%
Australia 464 466 (0.4 )%
Total international offices 1,550 1,582 (2.0 )%
Tax offices worldwide 11,011 11,086 (0.7 )%
(1) An assisted tax return is defined as a current or prior year individual tax return that has been accepted and paid for by the client. Also included are Tax Pro GoSM, Tax Pro ReviewSM, and business returns. A DIY return is defined as a return that has been electronically filed and accepted by the
IRS. Also included are online returns paid and printed.
(2) Net average charge is calculated as tax preparation fees divided by tax returns prepared. For DIY, net average charge excludes IRS Free File.
(3) Net average charge related to H&R Block Franchise Operations represents tax preparation fees collected by H&R Block franchisees divided by returns prepared in franchise offices. H&R Block will recognize a portion of franchise revenues as franchise royalties based on the terms of
franchise agreements.
40Consolidated financial results
Fiscal year 2020 reflects partial tax season data, impacting comparability
CONSOLIDATED ‐ FINANCIAL RESULTS (unaudited, in 000s ‐ except per share amounts) CONSOLIDATED ‐ FINANCIAL RESULTS (unaudited, in 000s ‐ except per share amounts)
Year ended April 30, 2020 2019 % Change Year ended April 30, 2020 2019 % Change
Revenues: Basic earnings (loss) per share:
U.S. assisted tax preparation $ 1,533,303 $ 1,858,998 (17.5 )% Continuing operations $ 0.03 $ 2.16 (98.6 )%
U.S. royalties 193,411 243,541 (20.6 )% Discontinued operations (0.07 ) (0.11 ) 36.4 %
U.S. DIY tax preparation 208,901 261,413 (20.1 )% Consolidated $ (0.04 ) $ 2.05 **
International 180,065 220,562 (18.4 )% Weighted average basic shares 196,701 205,372 (4.2 )%
Refund Transfers 154,687 169,985 (9.0 )%
Emerald Card® 92,737 98,256 (5.6 )% Diluted earnings (loss) per share:
Peace of Mind® Extended Service Plan 105,185 108,114 (2.7 )% Continuing operations $ 0.03 $ 2.15 (98.6 )%
Tax Identity Shield® 31,797 35,661 (10.8 )% Discontinued operations (0.07 ) (0.11 ) 36.4 %
Interest and fee income on Emerald AdvanceTM 60,867 58,182 4.6 % Consolidated $ (0.04 ) $ 2.04 **
Wave 36,711 — ** Weighted average diluted shares 198,108 206,724 (4.2 )%
Other 42,056 40,169 4.7 %
Total revenues 2,639,720 3,094,881 (14.7 )%
Other expenses:
Compensation and benefits: Consulting and outsourced services $ 118,267 $ 107,907 9.6 %
Field wages 678,813 751,392 (9.7 )% Bank partner fees 55,633 47,746 16.5 %
Other wages 218,548 217,061 0.7 % Client claims and refunds 35,498 40,538 (12.4 )%
Benefits and other compensation 175,535 180,276 (2.6 )% Employee travel and related expenses 40,892 40,369 1.3 %
1,072,896 1,148,729 (6.6 )% Software and IT maintenance expenses 68,907 64,483 6.9 %
Occupancy 410,402 401,341 2.3 % Credit card/bank charges 48,826 30,681 59.1 %
Marketing and advertising 255,094 269,807 (5.5 )% Insurance 15,015 14,219 5.6 %
Depreciation and amortization 169,536 166,695 1.7 % Legal fees and settlements 27,436 10,469 162.1 %
Bad debt 77,470 70,695 9.6 % Supplies 31,290 32,790 (4.6 )%
Impairment of goodwill 106,000 — ** Other 29,475 32,620 (9.6 )%
Other 471,239 421,822 11.7 % $ 471,239 $ 421,822 11.7 %
Total operating expenses 2,562,637 2,479,089 3.4 %
Other income (expense), net 15,637 16,419 (4.8 )%
Interest expense on borrowings (96,094 ) (87,051 ) (10.4 )%
Income (loss) from continuing operations before income taxes (benefit) (3,374 ) 545,160 **
Income taxes (benefit) (9,530 ) 99,904 **
Net income from continuing operations 6,156 445,256 (98.6 )%
Net loss from discontinued operations (13,682 ) (22,747 ) 39.9 %
Net income (loss) $ (7,526 ) $ 422,509 **
41Consolidated balance sheets
Fiscal year 2020 reflects partial tax season data, impacting comparability
CONSOLIDATED BALANCE SHEETS (unaudited, in 000s ‐ except per share data)
As of April 30, 2020 2019
ASSETS
Cash and cash equivalents $ 2,661,914 $ 1,572,150
Cash and cash equivalents ‐ restricted 211,106 135,577
Receivables, net 133,197 138,965
Prepaid expenses and other current assets 80,519 146,667
Total current assets 3,086,736 1,993,359
Property and equipment, net 184,367 212,092
Operating lease right of use asset 494,788 —
Intangible assets, net 414,976 342,493
Goodwill 712,138 519,937
Deferred tax assets and income taxes receivable 151,195 141,979
Other noncurrent assets 67,847 90,085
Total assets $ 5,112,047 $ 3,299,945
LIABILITIES AND STOCKHOLDERS’ EQUITY
LIABILITIES:
Accounts payable and accrued expenses $ 203,103 $ 249,525
Accrued salaries, wages and payroll taxes 116,375 196,527
Accrued income taxes and reserves for uncertain tax positions 209,816 271,973
Current portion of long‐term debt 649,384 —
Operating lease liabilities 195,537 —
Deferred revenue and other current liabilities 201,401 204,976
Total current liabilities 1,575,616 923,001
Long‐term debt and line of credit borrowings 2,845,873 1,492,629
Deferred tax liabilities and reserves for uncertain tax positions 182,441 197,906
Operating lease liabilities 312,566 —
Deferred revenue and other noncurrent liabilities 124,510 144,882
Total liabilities 5,041,006 2,758,418
COMMITMENTS AND CONTINGENCIES
STOCKHOLDERS’ EQUITY:
Common stock, no par, stated value $.01 per share 2,282 2,383
Additional paid‐in capital 775,387 767,636
Accumulated other comprehensive loss (51,576 ) (20,416 )
Retained earnings 42,965 499,386
Less treasury shares, at cost (698,017 ) (707,462 )
Total stockholders' equity 71,041 541,527
Total liabilities and stockholders' equity $ 5,112,047 $ 3,299,945
42Non-GAAP financial measures
Fiscal year 2020 reflects partial tax season data, impacting comparability
NON‐GAAP FINANCIAL MEASURE ‐ ADJUSTED EBITDA NON‐GAAP FINANCIAL MEASURE ‐ ADJUSTED EPS
Year ended April 30, 2020 2019 Year ended April 30, 2020 2019
Net income (loss) ‐ as reported $ ( 7,526 ) $ 422,509 Net income from continuing operations ‐ as reported $ 6,156 $ 445,256
Discontinued operations, net 13,682 22,747 Adjustments:
Net income from continuing operations ‐ as reported 6,156 445,256 Amortization of intangibles releated to acquisitions (pretax) 74,561 62,751
Add back: Impairment of goodwill (pretax) 106,000 —
Income taxes (benefit) of continuing operations ( 9,530 ) 99,904 Tax effect of adjustments (3) ( 19,126 ) ( 14,891 )
Interest expense of continuing operations 96,094 87,051 Adjusted net income from continuing operations $ 167,591 $ 493,116
Depreciation and amortization of continuing operations 169,536 166,695
256,100 353,650 Diluted income per share ‐ as reported $ 0.03 $ 2.15
EBITDA from continuing operations 262,256 798,906 Adjustements, net of tax 0.81 0.24
Adjustments: Adjusted income per share $ 0.84 $ 2.39
Impairment of goodwill 106,000 —
Adjusted EBITDA from continuing operations $ 368,256 $ 798,906
EBITDA margin from continuing operations (1) 9.9 % 25.8 %
Adjusted EBITDA margin from continuing operations (2) 14.0 % 25.8 %
Note: Please refer to the “Safe Harbor Statement” at the beginning of this presentation for information relating to non-GAAP financial measures
(1) EBITDA margin from continuing operations is computed as EBITDA from continuing operations divided by revenues from continuing operations.
(2) Adjusted EBITDA margin from continuing operations is computed as adjusted EBITDA from continuing operations divided by revenues from continuing operations.
(3) The tax effect of adjustments is the difference between the tax provision calculation on a GAAP basis and on an adjusted non-GAAP basis.
43I N V E S TO R P R E S E N TAT I O N JUNE 2020
You can also read