What Will the OECD BEPS Indicators Indicate? - DISCUSSION ...
←
→
Page content transcription
If your browser does not render page correctly, please read the page content below
// NO.21-005 | 01/2021

DISCUSSION
     PAPER
   / / J O S T H . H E C K E M E Y E R , K AT H A R I N A N I C O L A Y,
                                 AND CHRISTOPH SPENGEL

What Will the OECD BEPS
Indicators Indicate?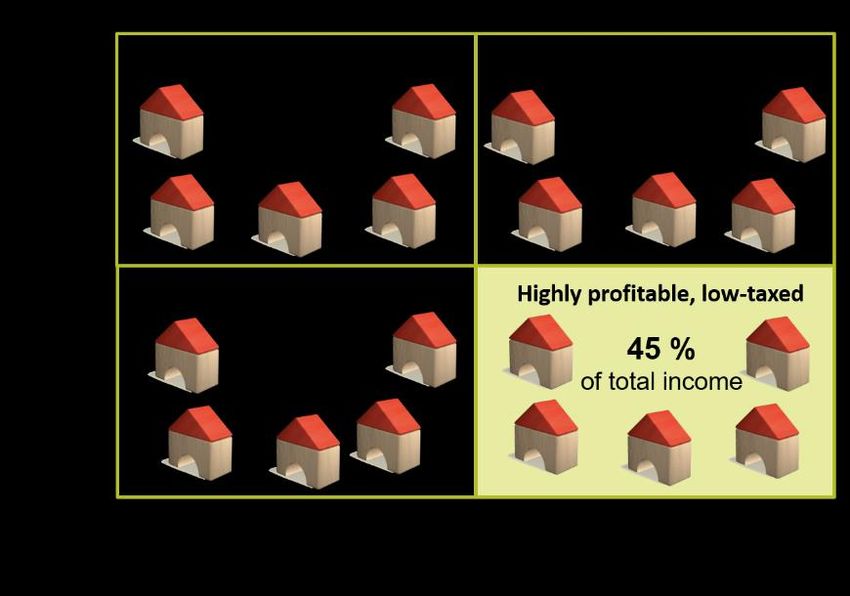
What Will the OECD BEPS Indicators Indicate?
Jost H. Heckemeyer
Kiel University & ZEW Mannheim
Katharina Nicolay
University of Mannheim & ZEW Mannheim
Christoph Spengel
University of Mannheim & ZEW Mannheim
Summary
As part of its action plan against base erosion and profit shifting (BEPS), the OECD
(2015) has proposed six indicators to measure profit shifting activity. These indicators
add to past and ongoing efforts in academic tax research to empirically identify the scale
and tax sensitivity of international profit shifting. In this paper, we discuss whether the
proposed OECD indicators indeed represent methodological advances and critically as-
sess their informative value.
While a certain need for “easy-access” indicators to measure the relevance of the base
erosion problem seems justified, our discussion reveals that the indicators come up with
certain shortcomings, many of them acknowledged by the OECD (2015) itself, that pre-
vent them from reliably tracing profit shifting activity in available international data.
With one notable exception, the OECD's indicators lack consistent counterfactuals and
comparison groups which are essential benchmarks for the observed data.
Even the most promising approaches require representative and timely data that covers
firms' global activity, including tax haven operations. With better access to such high-
quality micro-level data, it will be more promising to empirically isolate the effects of
profit shifting from relocations of real economic activity and value creation.
JEL: H20, H25, H26
Keywords: Tax policy, International Taxation, BEPS, OECD, Base Erosion and Profit Shifting
__________________________________________________________________________________________
This version: January 2021
Paper prepared for the European Tax Policy Forum (ETPF) 2017
Jost H. Heckemeyer: heckemeyer@bwl.uni-kiel.de
Katharina Nicolay: nicolay@zew.de
Christoph Spengel: spengel@uni-mannheim.de
1.     Introduction

The public debate on legal tax avoidance by multinational companies (MNCs) has been fueled
by extremely low effective tax rates (ETRs) of highly profitable companies that seem to pay
almost no corporate income tax in foreign source countries. For example, the most valuable US
company, Apple Inc., reported a foreign (i.e. non-US) ETR of only 4.7% for the fiscal year
2011 (Sullivan 2012). The problem, of course, is not new and many countries have already
implemented reforms to reduce the incentives for profit shifting or to strengthen anti-avoidance
regulations. The European Commission also addresses the issue. On 12 July 2016 the European
Council adopted the first Anti-Tax Avoidance Directive (ATAD 1) and complemented this new
legislation with a second directive (ATAD 2) on 29 May 2017.1 Yet, with the increasing im-
portance of knowledge capital and new distribution channels, there is a persistent call for mon-
itoring, and ultimately combating, tax base erosion.

All of this suggests that the problem of tax base erosion is substantial. But how can we really
know about the scale of profits shifted and taxes avoided? How can we measure tax base erosion
and profit shifting, trace developments over time and judge about the effectiveness of counter-
measures? As part of its action plan against base erosion and profit shifting (BEPS), the OECD
(2015) has proposed six indicators to measure BEPS activity. These indicators add to past and
ongoing efforts in academic tax research to empirically identify the scale and tax sensitivity of
international profit shifting. Given that our current knowledge of income shifting behavior is
still far from complete, every new indicator seems at least worth considering. In this paper, we
discuss whether the proposed OECD indicators indeed represent methodological advances and
critically assess their informative value.

In sum, our discussion reveals several shortcomings, many of them also acknowledged by the
OECD (2015) itself, that prevent the proposed indicators from reliably tracing profit shifting
activity in available international data. With one notable exception, the OECD indicators lack
consistent counterfactuals and comparison groups which are, however, essential benchmarks
for the observed data patterns. Only one of the proposed approaches to measure BEPS explicitly
acknowledges the need for such a counterfactual benchmark and thus could form the basis of a
reliable indicator, supposing sound and state-of-the-art statistical techniques are applied. We
highlight existing previous applications of this promising approach in empirical tax research.

1
    Council Directive (EU) 2016/1164 of 12 July 2016 and Council Directive (EU) 2017/952 of 29 May 2017.
                                                       1
This paper is organized as follows. Section 2 provides a very brief summary of what is known
about the tax sensitivity of profit shifting to international tax incentives. Section 3 discusses the
six OECD indicators one by one. Section 4 concludes.

2.   Evidence on International Tax Avoidance: The Tax Sensitivity of Reported Profits

An important strand of empirical research provides compelling and robust evidence for tax mo-
tivated international profit shifting. Thus, we know that profit shifting by MNEs takes place.
Recently, the ample literature has been reviewed by Dharmapala (2014), Riedel (2014), and
Heckemeyer and Overesch (2017).

Previous empirical research mostly builds on a conceptual framework developed by Hines and
Rice (1994) and enhanced by Huizinga and Laeven (2008). The basic rationale of this frame-
work is that the observed pre-tax income of an affiliate is the sum of unobserved true pre-tax
profits and a (positive or negative) shifted income component. Unobserved true pre-tax profits
are equal to the affiliate's production output minus the wage bill, i.e. they reflect true value
creation by the affiliate. Accordingly, the tax effect on profit allocation within MNCs is identi-
fied conditional on the inputs that enter the affiliate's production function in order to isolate the
shifted income component from the genuine pre-tax profit. Specifically, the profit shifting com-
ponent is identified by exploiting the (weighted) international tax rate difference between the
affiliate and its parent or other entities of the MNE. The estimated coefficient of the tax term
reflects the sensitivity of reported profits to international tax incentives. Quantitatively, it indi-
cates the change in percentage of reported profit in response to a one percentage point change
in the tax differential vis-à-vis other international locations (the semi-elasticity of reported pre-
tax profits). Heckemeyer and Overesch (2017) present a meta-analysis of 27 empirical studies
to synthesize the existing evidence on this semi-elasticity. They predict a semi-elasticity of
about -0.8. Taking this result at face value, a one percentage point cut in host country taxes is
associated with an increase in the pre-tax profits of an affiliate by approximately 0.8%.

Interestingly, considering the 238 primary estimates they draw from the empirical literature,
Heckemeyer and Overesch (2017) find that more recent studies tend to report lower semi-elas-
ticities than previous papers (see Figure 1). Thus, the question arises what may explain this
downward trend in the estimated tax sensitivity of pre-tax profits? On the one hand, decreasing
tax-rate elasticities could be due to advances in the empirical approaches used to identify in-
come shifting behavior of multinational firms. Specifically, more recent studies often exploit
richer data sources, firm-level panel data in particular. Using better data, these studies are able

                                                  2
to employ rigorous micro-econometric techniques that may produce more precise and more
accurate estimates of the genuine tax semi-elasticity. On the other hand, the observed negative
trend could reflect increasing costs of income shifting due to tighter anti-avoidance legislation
that many countries, including the European Union, have implemented to limit the incentives
and opportunities for profit shifting.

Using meta-regression techniques, Heckemeyer and Overesch (2017) find that even conditional
on the econometric specification, method and data, semi-elasticities exhibit a decreasing trend.
However, the picture remains somewhat ambiguous. For example, Klassen and Laplante (2012)
state that, even with tax rate differences held constant, U.S. MNEs have become more tax ag-
gressive over the past two decades. Clausing (2016) is skeptical of the existent literature in view
of the fact that it mostly relies on financial accounting data whereas tax returns would be the
optimal source of information. Moreover, she argues that available financial data sets only have
weak coverage of some important tax havens - a problem which she fears could lead to an
underestimation of BEPS. In a recent study, Barrios and d'Andria (2016) propose that elastici-
ties of profit shifting do not follow any long-term trend but display a pro-cyclical behavior with
a decrease during crisis years and an increase in years of economic recovery.

After all, in the past two decades, our understanding of international profit shifting, its mecha-
nisms and incentives have increased considerably. Still, our current knowledge of the diverse
facets of profit shifting is far from complete. This justifies the search for additional indicators
to monitor BEPS - as long as these present methodological advances. Whether the proposed
OECD indicators provide reliable, additional or even better information on BEPS will be dis-
cusses in the next section.

3.   The Six OECD BEPS Indicators: What is their Rationale and Informative Value?

In 2015, the OECD presented its final reports on 15 distinct actions as part of its plan to tackle
base erosion and profit shifting (BEPS). Action 11 of the BEPS agenda presents six indicators
that are supposed to measure and inform about the scale and the channels of BEPS. In the fol-
lowing, we will present the six BEPS indicators proposed by the OECD (2015) in its final report
on action 11.2 Given that the OECD's final report provides, on as much as 300 pages, a com-
prehensive detailed technical description which also comes with a frank discussion of the indi-

2
 OECD (2015), Measuring and Monitoring BEPS, Action 11 - 2015 Final Report, OECD/G20 Base Erosion and
Profit Shifting Project, OECD Publishing, Paris. http://dx.doi.org/10.1787/9789264241343-en.

                                                 3
cators benefits and weaknesses, our aim is to be as concise as possible and present these indi-
cators in a non-technical, visual way stressing the idea rather than computational details. More-
over, we address those benefits and weaknesses that we consider the most relevant.
Figure 1 provides an overview of the six indicators. The indicators deal with different facets of
BEPS and measure BEPS at different levels of aggregation. Whereas indicators 1 and 5 exploit
macroeconomic data, the remaining indicators require firm-level data. Considering the compu-
tational aspects, most indicators are based on some form of benchmarking, regrouping and av-
eraging of the data whereas, notably, indicator 4 uses econometric techniques. Thus, an appar-
ent advantage of indicator 4 is that a counterfactual "pre-BEPS" situation can, by statistical
means, be constructed and serve as a benchmark for estimates on the scale and prevalence of
profit shifting. We will get back to this point.
Figure 1: Overview of the six BEPS indicators
Indicator 1:
Concentration of high
levels of FDI relative to
GDP
Indicator 6:
Indicator 2:
Interest expense to High profit rates of
income ratios of MNE low-taxed affiliates of
affiliates in high-tax global MNEs
locations
BEPS Action 11
Indicators
Indicator 3:
Indicator 5:
Differential profit rates
Concentration of high
between low-tax
levels of royalty
locations and
receipts relative to
worldwide MNE
R&D spending
operations
Indicator 4:
Effective tax rates of
large MNE affiliates
relative to non-MNE
entities with similar
characteristics
Indicator 1: Disconnect between financial and real economic activities
The so-called gravity approach explains inter-country trade patterns through a combination of
mass variables (e.g. GDP, population) and distance variables. The gravity approach can also be
used to explain the determinants of bilateral foreign direct investment (FDI) between countries
(Head and Ries, 2008). Accordingly, FDI patterns are expected to be proportional to the eco-
nomic size of the involved investor and/or target countries. Interestingly however, some coun-
tries, offshore financial centers in particular, feature volumes of foreign investment which are
4disproportionate to their economic mass (Lane and Milesi-Ferretti, 2008, 2011; Hines, 2010).
These volumes may reflect the intermediary role that offshore centers generally play in inter-
national finance (Lane and Milesi-Ferretti, 2011). At the same time, these patterns of FDI are
also consistent with international tax avoidance involving the use of offshore tax havens: Under
many forms of international tax planning, multinational companies (MNCs) channel funds
through corporate entities resident in low-tax countries. Funds attributed to these entities lead
to inbound flows of direct investment.
The first OECD indicator takes up this notion and attempts to measure BEPS by sorting coun-
tries into two groups according to whether they feature highly disproportionate volumes of in-
bound FDI - or not. The grouping of countries is based on FDI-to-GDP ratios, where a ratio
above 200% is considered to reflect disproportionate volumes of FDI. After sorting countries
into the two groups and computing the average FDI-to-GDP ratio for each group, a ratio of the
averages is constructed in order to give the indicator. Figure 2 illustrates the idea with countries
showing disproportionate FDI-to-GDP ratios marked in blue and all other countries marked in
green.
Figure 2: Illustration of indicator 1
Admittedly, very high levels of inward FDI relative to GDP might signal BEPS-motivated FDI
components routed through countries with little association to local value creation. Carefully
considering the indicator, however, its weaknesses become apparent: The FDI-to-GDP ratio is
influenced by numerous economic factors which relate, for example, to the structure of a coun-
try's economy as well as domestic savings. Moreover, the ratio may reflect growth or the busi-
ness cycle with (foreign) investment being particularly strong in thriving economies. At the
same time the denominator, i.e. GDP is subject to business cycle effects as well. After all, the
proposed FDI-to-GDP threshold of (at least) 200% used to classify countries appears arbitrary
5and there is no exogenously given benchmark which separates data patterns reflecting BEPS
components from those which do not include investment motivated by BEPS. These problems
already hold for gross FDI. Net FDI and an indicator built thereon are even more difficult to
interpret because tax attractive countries can plausibly feature both high and low levels of net
FDI depending, for example, on whether a country serves as an important conduit of FDI or
entities tend to invest in portfolio assets.
For illustrative purposes, we calculate (gross) FDI-to-GDP ratios in Table 1 for a small selection
of countries and categorize them according to the 200% threshold. It turns out that indicator 1
will certainly be driven by a few countries such as Luxembourg and the Marshall Islands that
feature extreme FDI-to-GDP ratio even within the group of tax havens. Moreover, the some-
what arbitrary threshold of a 200% ratio becomes apparent given that Singapore, an important
offshore location, is in the non-haven group with its FDI-to-GDP ratio of about 171%. FDI
stocks invested in Ireland and the Netherlands are very high but the size of these economies
puts the numbers into perspective. Whether FDI related to real activity in these countries or is
tax motivated remains an open question.
Table 1: FDI-to-GDP ratios for a selection of countries
GDP FDI-to-GDP
(in mio US$)
High ratio countries (FDI-to-GDP >200%)
Bahamas 11,839 473.20%
Ireland 304,819 372.10%
Luxembourg 58,631 4084.99%
Marshall Islands 194 2011.05%
Netherlands 777,228 344.14%
…
Low ratio countries (FDI-to-GDP < 200%)
Germany 3,477,796 21.60%
United Kingdom 2,650,850 109.39%
United States 18,624,475 22.11%
Singapore 309,764 171.37%
Virgin Islands 3,765 10.65%
Notes: FDI data is obtained from OECD, GDP data is obtained from the World Bank.
The OECD documents that indicator 1 has risen during recent years from a value of 13 in 2005
to 26.7 in 2012 (OECD, 2015: p. 51). One can only speculate whether this highly aggregate
macroeconomic indicator does tell us anything about the development of BEPS activity during
this time period or whether other macroeconomic developments are responsible for the ob-
served data patterns.
6Indicator 2: High profit rates of low-taxed affiliates of top global MNCs
The second BEPS indicator proposed by the OECD is based on firm-level data and requires
data on multinational group structures. Once the structure of a multinational group has been
identified, the affiliates of the MNC are grouped along two dimensions. First, the affiliates are
classified according to whether their effective tax rate lies below or above the MNC's consoli-
dated global effective tax rate. Second, affiliates are grouped according to their profit rate (pre-
tax income over assets) relative to the MNC's worldwide profit rate. Eventually, affiliates are
divided into four quadrants along these dimensions: A first quadrant that includes affiliates
featuring a (relatively) low profit rate and a (relatively) high tax burden, a second quadrant with
both (relatively) low profit and tax rates, a third quadrant with both (relatively) high profit and
tax rates, and a fourth quadrant that includes those affiliates which are highly profitable but
feature low effective tax rates.
Figure 3: Illustration of indicator 2
Source: This figure is, in parts, based on OECD (2015): p. 51, Figure 2.3
The indicator which is ultimately calculated on the basis of this affiliate sorting reflects the
proportion of the MNC's total income reported by the affiliates in the fourth quadrant – with
calculations repeated and averaged across an entire sample of MNCs. The underlying intuition
is clear: From a pure tax perspective, income is optimally allocated to affiliates that are low
taxed, driving up profit margins in these jurisdictions. The larger the scale of BEPS, the more
income should be allocated accordingly.
7Based on data for the 250 top global MNCs in 2015, the OECD calculates that 45% of total
income is, on average, reported in the high profits – low tax group of affiliates (see Figure 3).
BEPS activity might, among other factors, be driving this result. Still, the information content
of this second indicator remains, similar to the first indicator, only vague. Specifically, the in-
dicator provides no indication about whether income attributed to profitable low-tax affiliates
originates from their real productive activity or from profit shifting. Companies have strong
incentives to allocate profitable investment projects to low-tax countries as has been shown for
the case of R&D projects by Ernst et al. (2014). R&D investment can boost profit rates calcu-
lated on the basis of total assets reported in balance sheets. On the basis of the proposed indi-
cator, shifting profitable economic activity towards tax attractive countries thus cannot be reli-
ably separated from profit shifting in its strict sense. Moreover, similar to the first indicator,
there is no benchmark or counterfactual scenario that informs about how the data would look
like if there was no profit shifting.
Indicator 3: High profit rates of MNC affiliates in lower-tax locations
The third BEPS indicator proposed by the OECD is also based on firm-level data and requires
information on multinational group structures. The OECD proposes, for each individual MNC,
to compute effective tax rates at the level of each country in which the multinational firm oper-
ates. Countries shall then be ranked by effective tax rates for each MNC. Starting with the
lowest country ETRs, those countries which account for up to 20% of the group's worldwide
assets are classified as low-tax countries.
Figure 4: Illustration of indicator 3
8For each MNC, its average profit rate in this group of low-tax countries is divided by the overall
worldwide profit rate of the group (see the formula in Figure 4). The notion underlying this
indicator thus is similar to the second one as are its fundamental weaknesses. In particular, the
definition of low-tax countries seems arbitrary. The indicator is calculated as the asset-weighted
average over the 250 top global MNCs and takes on values of 1.9 in 2007 and 2.0 in 2011
(OECD, 2015).
Indicator 4: MNCs vs. "comparable" non-MNC effective tax rate differentials
The first indicator discussed above relies on highly aggregate data while many factors poten-
tially driving the data remain uncontrolled. The second and third indicators employ microdata
at the level of the multinational group. Still, these two alternative approaches, as discussed, do
not allow for a clear-cut separation of the international income allocation that stems from the
geographical distribution of MNCs' value chains from the consequences of cross-border profit-
shifting towards low-tax countries. In other words, these approaches lack a meaningful coun-
terfactual income allocation that mimics a situation without profit shifting opportunities.
The fourth indicator proposed by the OECD takes up this critical point and aims to assess the
observed income allocation within MNCs with reference to a comparison group that reflects a
counterfactual benchmark. For this purpose, a sample including both multinational group affil-
iates and domestic non MNC-entities is assembled from firm-level databases. Domestic firms
do not have access to international profit shifting opportunities and, controlling for other rele-
vant determinants, a comparison of suitable outcome variables between domestic and multina-
tional companies might reveal the influence and scale of BEPS. Thus, exploiting this combined
data sample, the OECD proposes to regress the companies' effective tax rates on a binary
dummy variable that marks the multinational affiliates in the sample, conditional on a set of
further ETR determinants that might correlate with MNC-status (size, industry etc.). If the co-
efficient of the binary dummy variable loads negative and significant, this is considered as an
indication for profit shifting opportunities driving down effective tax rates of multinational af-
filiates relative to domestic companies.
9Figure 5: Illustration of indicator 4
The strength of this approach lies in the fact that it acknowledges the need for a counterfactual
benchmark in order to gauge the implications of profit shifting opportunities arising within
multinational groups. However, the quality of the comparison depends on how similar and com-
parable the groups, i.e. multinational affiliates and domestic stand-alone firms, actually are. The
approach, thus, has to be enhanced by statistical matching procedures. In particular, self-selec-
tion has to be addressed: Since very profitable firms are more likely to expand across borders
than less profitable or even loss-making businesses, a naive comparison of tax outcomes be-
tween multinational firms and domestic firms is misleading. So-called propensity score match-
ing provides, under several assumptions, a solution for this econometric problem. The propen-
sity score matching approach features analogies to experimental settings (Rubin, 1974; Rosen-
baum and Rubin, 1983; Lechner, 2002). The key idea is to determine a control group (in the
given context: domestic firms) which is similar to the treatment group (here: the multinationals)
with respect to as many criteria as possible, and which allows for a meaningful comparison of
the outcome variable for these two groups. The relevant propensity score can be estimated as
the predicted probability of belonging to the treatment group or the control group conditional
on a set of observable characteristics.
10Moreover, any study should use a suitable outcome variable. Considering the OECD approach,
it seems questionable whether the effective tax rate is the optimal variable to measure discrep-
ancies between multinationals and domestic firms that have been caused by BEPS activity. The
effective tax rate is defined as tax expense divided by reported pre-tax income of an affiliate. It
reflects consequences of so called non-conforming tax avoidance leading to mismatches be-
tween income for financial accounting purposes and taxable income. While it may thus reflect,
for example, certain forms of hybrid mismatches or preferential tax treatments, the ETR will
neither signal profit shifting via tax efficient transfer pricing nor tax planning involving tax
optimal allocation of interest or royalty expenses. Other types of variables might thus be more
informative to assess the BEPS opportunities and activities of multinational firms.
Considering the empirical literature, Egger et al. (2010) and Finke (2015) analyze profit shifting
activity relying on approaches that represent best practice. Egger et al. (2010) directly compare
tax payments of multinational firms to those of domestic firms which they select using propen-
sity score matching. They are able to document that foreign owned subsidiaries located in coun-
tries with above average tax rates pay on average 1.266 million Euro less taxes than domesti-
cally owned firms in the control group. This is about 30% of the tax payments of the control
group. Enhancing the approach by Egger et al. (2010), Finke (2015) uses observable firm char-
acteristics instead of only regional characteristics to match multinational and domestic firms.
Consistently, she finds that German MNCs pay about 27% less tax than the control group of
domestic firms. However, after the 2008 major German tax reform, which cut tax rates and
implemented stricter anti-avoidance legislation, the difference in tax payments between multi-
nationals and domestic firms shrinks to about half of the pre-reform effect.
In sum, relying on the definition of a comparison group, indicator 4 presents the most promising
approach to identify BEPS activity in a conceptually sound way. Using state-of-the-art statisti-
cal methods and plausible outcome variables for comparison, BEPS activity can be consistently
traced.
Indicator 5: Profit shifting through intangibles
The OECD's proposed fifth indicator gets back to aggregate macroeconomic data rather than
firm-level data. The approach concentrates on one specific form of profit shifting involving the
use of intangible assets and associated royalty payments toward low tax countries. The idea is
to identify countries which, relative to the actual R&D activity taking place, feature a dispro-
portional volume of inbound royalty payments. In that sense, the indicator resembles the first
11indicator that also tried to identify BEPS using aggregate proportions – and again no clear
benchmark for the assessed proportionality is provided. Above a ratio of 50%, countries are
classified as featuring a disproportionate volume of inbound royalty flows to aggregate business
R&D expenditure. The average royalty-to-R&D ratio of this group of countries3 divided by the
average ratio calculated for the remaining countries defines the indicator.
Figure 6: Illustration of indicator 5
While the focus on one specific form of profit shifting, i.e. tax planning involving R&D and the
resulting intangible property, may be considered as an advantage of the indicator, it presents
weaknesses similar to indicator 1. Importantly, MNCs can locate highly profitable R&D activ-
ity in low-tax jurisdictions (Ernst et al., 2014). Such investment behavior clearly involves tax
considerations; however, it reflects real consequences of the international tax differential rather
than BEPS activity. Moreover, R&D expenditures are highly cyclical. In addition, there is a
considerable time lag between R&D expenditures and royalty income. Thus, the considered
ratio might vary depending on the business cycle and the dynamics of R&D expenditures. Con-
sidering royalty flows, an important share of this aggregate position might not be linked to R&D
output but to the use of trademarks, copyrights or franchises. Whether R&D expenditure alone
is the right denominator thus seems questionable as long as the considered royalty data is not
consistently defined.
Indicator 6: Profit shifting through interest
3
Country grouping is based on data as of 2011 and held constant.
12Indicator 6 returns to using micro data and is somewhat similar to indicator 2 as it groups the
affiliates of MNCs along two dimensions. First, the affiliates are classified according to whether
their statutory profit tax rate lies below or above the MNC's weighted (by EBITDA) average
statutory tax rate. Second, affiliates are grouped according to whether their interest-to-income
ratio, defined as interest paid divided by EBITDA, exceeds or falls below the MNC's consoli-
dated worldwide interest-to-income ratio. Eventually, the affiliates are thus divided into four
quadrants. This type of division is done for the 250 top global MNCs. For each quadrant, the
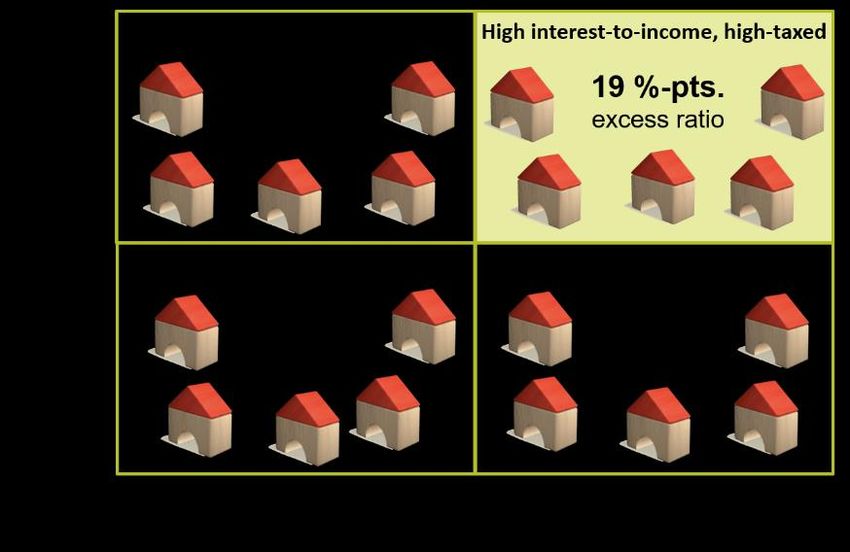
difference between the weighted average interest-to-income ratio of affiliates in that specific
quadrant and the weighted average interest-to-income ratio of all affiliates is calculated and
called the "excess ratio". The excess ratio of the northeast quadrant, i.e. for the high-tax and
high interest-to-income affiliates, is indicator six.
While this indicator tries to measure excessive interest deductions as one of the most important
debt channels (OECD, 2015: p. 63), it ignores that increased debt levels in high-tax locations
might reflect domestic tax incentives (Modigliani and Miller, 1963) just as well as international
profit shifting incentives.
Figure 7: Illustration of indicator 6
Source: This figure is, in parts, based on OECD (2015): p. 64, Figure 2.6
4. Conclusions
Given that our current knowledge of income shifting behavior is still far from complete, every
new indicator seems worth considering. Especially a certain need for “easy-access” indicators
13to measure the relevance of the base erosion problem seems to be justified. In this paper, we
discuss whether the proposed OECD indicators indeed represent methodological advances
and critically assess their informative value. Overall, we are skeptical.
- Indicator 1 might be the weakest indicator for the scale of BEPS as there are too many
other influences on FDI; yet it might point to abnormal high FDI locations to be inves-
tigated more closely.
- Similarly, indicators 2 and 3 are not able to precisely signal the separation of eco-
nomic value creation and taxable income.
- Indicator 4 could be a good proxy for scale of BEPS, depending on the quality of the
applied matching process.
- Indicators 5 & 6 focus on single BEPS channels; therefore, they might be somewhat
more focused and less affected by confounding factors but indicator 5 uses macro-level
data and potential time-lags between R&D expenses and resulting royalty payments
could create noise.
In sum, our discussion shows that the indicators present shortcomings, many of them acknowl-
edged by the OECD (2015) itself, that prevent them from very reliably tracing profit shifting
activity in available international data. With one notable exception, the OECD's indicators lack
consistent counterfactuals and comparison groups which are essential benchmarks for the ob-
served data. Only one of the proposed approaches to measure BEPS, i.e. indicator 3, explicitly
acknowledges the need for such a counterfactual benchmark and thus could form the basis of a
reliable measure for BEPS, supposing that sound and state-of-the-art statistical techniques are
applied. We highlight that this type of studies does exist.
Still, even the most promising approaches require representative and timely data that covers
firms' global activity, including tax haven operations. With better access to such high-quality
micro-level data, it will be easier to empirically isolate the effects of profit shifting from relo-
cations of real economic activity and value creation.
References
Barrios, Salvador, and Diego d'Andria (2016). Estimating Corporate Profit Shifting with Firm-
Level Panel Data: Time Trends and Industrial Heterogeneity. JRC Working Papers on
14Taxation and Structural Reform No 7/2016, European Commission, Joint Research Cen-
tre, Seville.
Clausing, Kimberly A. (2016). The Effect OF Profit Shifting on the Corporate Tax Base in the
United States and Beyond. National Tax Journal 69: 905–934.
Dharmapala, Dhammika (2014). What Do We Know about Base Erosion and Profit Shifting?
A Review of the Empirical Literature. Fiscal Studies 35: 421-448.
Egger, Peter, Wolfgang Eggert, and Hannes Winner (2010). Saving Taxes Through Foreign
Plant Ownership. Journal of International Economics 81: 99–108.
Ernst, Christof, Katharina Richter, and Nadine Riedel (2014). Corporate Taxation and the Qual-
ity of Research and Development. International Tax and Public Finance 21 (4): 694-
719.
Finke, Katharina (2015). What is the scale of profit shifting: Evidence from a propensity score
matching approach and propensity score reweighting. Working Paper.
Head, Keith, and John Ries (2008). FDI as an Outcome of the Market for Corporate Control:
Theory and Evidence. Journal of International Economics 74: 2-20.
Heckemeyer, Jost H., and Michael Overesch (2017). Multinationals’ Profit Response to Tax
Differentials: Effect Size and Shifting Channels. Canadian Journal of Economics 50
(4): 965–994.
Hines, James R., and Eric M. Rice (1994). Fiscal Paradise: Foreign Tax Havens and American
Business. Quarterly Journal of Economics 109(1): 149–182.
Hines, James R. (2010). Treasure Islands. Journal of Economic Perspectives 24 (4): 103–126.
Huizinga, Harry, and Luc Laeven (2008). International Profit Shifting within Multinationals: A
Multi-Country Perspective. Journal of Public Economics 92(5–6): 1164–1182.
Klassen, Kenneth J., and Stacie K. LaPlante (2012). Are U.S. Multinational Corporations Be-
coming More Aggressive Income Shifters?. Journal of Accounting Research 50(5):
1245–1285.
Lane, Philip R., and Gian Maria Milesi-Ferretti (2008). International Investment Patterns. The
Review of Economics and Statistics 90: 538–549.
15Lane, Philip R., and Gian Maria Milesi-Ferretti (2011). Cross-Border Investment in Small In-
ternational Financial Centres. International Finance 14: 301–330.
OECD (2015). Measuring and Monitoring BEPS, Action 11 - 2015 Final Report, OECD/G20
Base Erosion and Profit Shifting Project. Paris: OECD Publishing. DOI:
http://dx.doi.org/10.1787/9789264241343-en
Riedel, Nadine (2014). Quantifying International Tax Avoidance: A Review of the Academic
Literature. Paper prepared for the European Tax Policy Forum.
Rosenbaum, Paul R., and Donald B. Rubin (1985). Constructing a Control Group Using Mul-
tivariate Matched Sampling Methods that Incorporate the Propensity Score. American
Statistician 3: 33–38.
Rubin, Donald B. (1974). Estimating Causal Effects of Treatments in Randomized and Non-
randomized Studies. Journal of Educational Psychology 66: 688–701.
Sullivan, Martin A. (2012). Apple Reports High Rate but Saves Billions on Taxes. Tax Notes
134: 777–778.
16Download ZEW Discussion Papers from our ftp server: http://ftp.zew.de/pub/zew-docs/dp/ or see: https://www.ssrn.com/link/ZEW-Ctr-Euro-Econ-Research.html https://ideas.repec.org/s/zbw/zewdip.html // IMPRINT ZEW – Leibniz-Zentrum für Europäische Wirtschaftsforschung GmbH Mannheim ZEW – Leibniz Centre for European Economic Research L 7,1 · 68161 Mannheim · Germany Phone +49 621 1235-01 info@zew.de · zew.de Discussion Papers are intended to make results of ZEW research promptly available to other economists in order to encourage discussion and suggestions for revisions. The authors are solely responsible for the contents which do not necessarily represent the opinion of the ZEW.
You can also read


