Restoring and Redeveloping - the Largest, Highest Grade and Lowest Cost Independent Gold Project in the U.S. Lower 48 - Mining Data Online
←
→
Page content transcription
If your browser does not render page correctly, please read the page content below
1

              Restoring and Redeveloping
              the Largest, Highest Grade and
              Lowest Cost Independent
              Gold Project in the
              U.S. Lower 48

                                          December 2020
MAX.TSX
MDRPF.OTCQX   Stibnite Gold Project Feasibility Study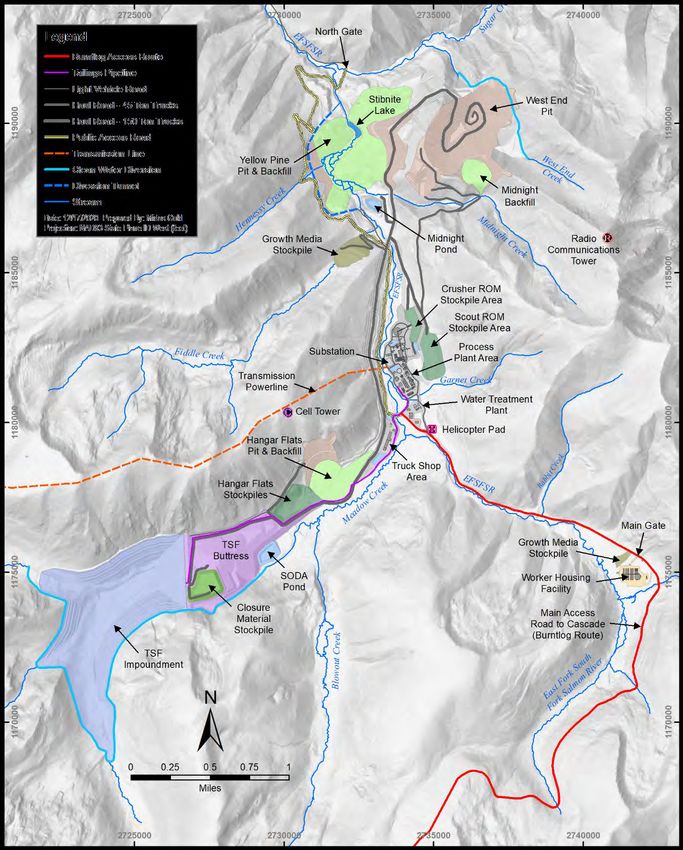
FORWARD LOOKING STATEMENTS
                                                                                                                                                                                                                                       2

Forward-Looking Information Statements contained in this presentation that are not historical facts are “forward-looking information” or “forward-looking statements” (collectively, “Forward-Looking Information”) within the
meaning of applicable Canadian securities legislation and the United States Private Securities Litigation Reform Act of 1995. Forward Looking Information includes, but is not limited to, disclosure regarding possible events,
conditions or financial performance that is based on assumptions about future economic conditions and courses of action; the timing and impact of future activities on the Project, including but not limited to the ability to
address legacy features left by previous operators; the anticipated economic, environmental and other benefits of the Project; the viability of the Project; development and operating costs in the event that a production decision
is made; success of exploration, development and environmental protection, closure and remediation activities; permitting time lines and requirements; requirements for additional capital; requirements for additional water
rights and the potential effect of proposed notices of environmental conditions relating to mineral claims; risks and opportunities associated with the Project; planned exploration and development of properties and the results
thereof; planned expenditures, production schedules and budgets and the execution thereof. In certain cases, Forward-Looking Information can be identified by the use of words and phrases such as "reduce", "feasible",
"vision", "goals", "improved", "plans", "future", "prospects", dependent", "estimates", "long-term", "sequence", "minimizing", "needs", "likely", "readily", "assumed", "imminent", "proposed", "drives", "opportunities",
"improve", "contemplates", "pursuing", "strived", "adoption", "planning", "estimation", "potentially", "potential", "anticipated", "schedule", "additional", "discovery", “plans”, “expects” or “does not expect”, “is expected”,
“budget”, “scheduled”, “estimates”, “forecasts”, “intends”, “anticipates”, “potential” or “does not anticipate”, “believes”, “contemplates”, “recommends” or variations of such words and phrases or statements that certain
actions, events or results “may”, “could”, “would”, “might” or “will be taken”, “occur” or “be achieved”. Statements concerning mineral resource and mineral reserve estimates may also be deemed to constitute Forward-
Looking Information to the extent that they involve estimates of the mineralization that may be encountered if the Stibnite Gold Project is developed. In preparing the Forward-Looking Information in this news release, the
Company has applied several material assumptions, including, but not limited to, that any additional financing needed will be available on reasonable terms; the exchange rates for the U.S. and Canadian currencies will be
consistent with the Company‘s expectations; that the current exploration, development, environmental and other objectives concerning the Stibnite Gold Project can be achieved and that its other corporate activities will
proceed as expected; that the current price and demand for gold and antimony will be sustained or will improve; that general business and economic conditions will not change in a materially adverse manner and that all
necessary governmental approvals for the planned exploration, development and environmental protection activities on the Stibnite Gold Project will be obtained in a timely manner and on acceptable terms; the continuity of
the price of gold and other metals, economic and political conditions and operations; that the circumstances surrounding the COVID-19 pandemic, although evolving, will stabilize or at least no worsen; and the assumptions set
out in the FS. Forward-Looking Information involves known and unknown risks, uncertainties and other factors which may cause the actual results, performance or achievements of the Company to be materially different from
any future results, performance or achievements expressed or implied by the Forward-Looking Information. Such risks and other factors include, among others, the industry-wide risks and project-specific risks identified in the FS
and summarized above; risks related to the availability of financing on commercially reasonable terms and the expected use of proceeds; operations and contractual obligations; changes in exploration programs based upon
results of exploration; changes in estimated mineral reserves or mineral resources; future prices of metals; availability of third party contractors; availability of equipment; failure of equipment to operate as anticipated;
accidents, effects of weather and other natural phenomena and other risks associated with the mineral exploration industry; environmental risks, including environmental matters under US federal and Idaho rules and
regulations; impact of environmental remediation requirements and the terms of existing and potential consent decrees on the Company‘s planned exploration and development activities on the Stibnite Gold Project; certainty
of mineral title; community relations; delays in obtaining governmental approvals or financing; fluctuations in mineral prices; the Company‘s dependence on one mineral project; the nature of mineral exploration and mining
and the uncertain commercial viability of certain mineral deposits; the Company‘s lack of operating revenues; governmental regulations and the ability to obtain necessary licenses and permits; risks related to mineral
properties being subject to prior unregistered agreements, transfers or claims and other defects in title; currency fluctuations; changes in environmental laws and regulations and changes in the application of standards
pursuant to existing laws and regulations which may increase costs of doing business and restrict operations; risks related to dependence on key personnel; COVID-19 risks to employee health and safety and a slowdown or
temporary suspension of operations in geographic locations impacted by an outbreak; and estimates used in financial statements proving to be incorrect; as well as those factors discussed in the Company's public disclosure
record. Although the Company has attempted to identify important factors that could affect the Company and may cause actual actions, events or results to differ materially from those described in Forward-Looking
Information, there may be other factors that cause actions, events or results not to be as anticipated, estimated or intended. There can be no assurance that Forward-Looking Information will prove to be accurate, as actual
results and future events could differ materially from those anticipated in such statements. Accordingly, readers should not place undue reliance on Forward-Looking Information. Except as required by law, the Company does
not assume any obligation to release publicly any revisions to Forward-Looking Information contained in this news release to reflect events or circumstances after the date hereof or to reflect the occurrence of unanticipated
events.
Cautionary Note
The presentation has been prepared by Midas Gold management and does not represent a recommendation to buy or sell these securities. Investors should always consult their investment advisors prior to making any investment
decisions.
All references to “dollars” or “$” shall mean United States dollars unless otherwise specified.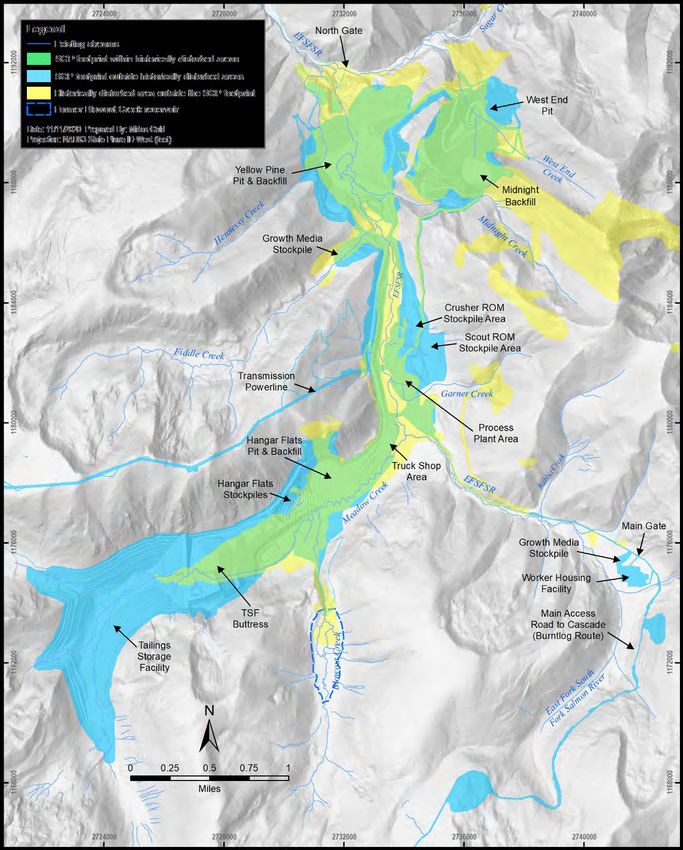
3

TODAY’S PRESENTATION

CORPORATE UPDATE
Laurel Sayer, CEO Midas Gold Corp.

FEASIBILITY STUDY UPDATE
John Meyer, VP Development Midas Gold Idaho

INVESTOR UPDATE
Marcelo Kim, Chairman of Board Midas Gold Corp.
4

CORPORATE UPDATE
IDAHO LEADERSHIP STRENGTHENED
                                                                                                                                                                     5

MIDAS GOLD CORP

  Laurel Sayer      Marcelo Kim          Bob Dean            David Deisley           Jeff Malmen     Chris Papagianis   Chris Robison         Alex Sternhell
 Director & CEO      Chairman             Director             Director                Director          Director         Director               Director
                     Paulson & Co         Fmr. Allen          Fmr. NovaGold,      Idaho Power, Fmr      Paulson & Co     Fmr Newmont,           Sternhell Group,
                                          Company            Goldcorp & Barrick     Chief of Staff                      Rio Tinto Minerals    Democrat Dpty. Staff
                                                                                   Governor Otter                          & Kennecott         Director US Senate
                                                                                                                           Utah Copper            Cm. Banking
         MIDAS GOLD IDAHO, INC

            Laurel Sayer       Don Bailey        Shauna Arnold          Bob Barnes      Scotty Davenport       Anne Labelle        April Whitney
           Director & CEO    Chairman, Idaho     Director, Idaho         Director        Director, Idaho         Director          Director, Idaho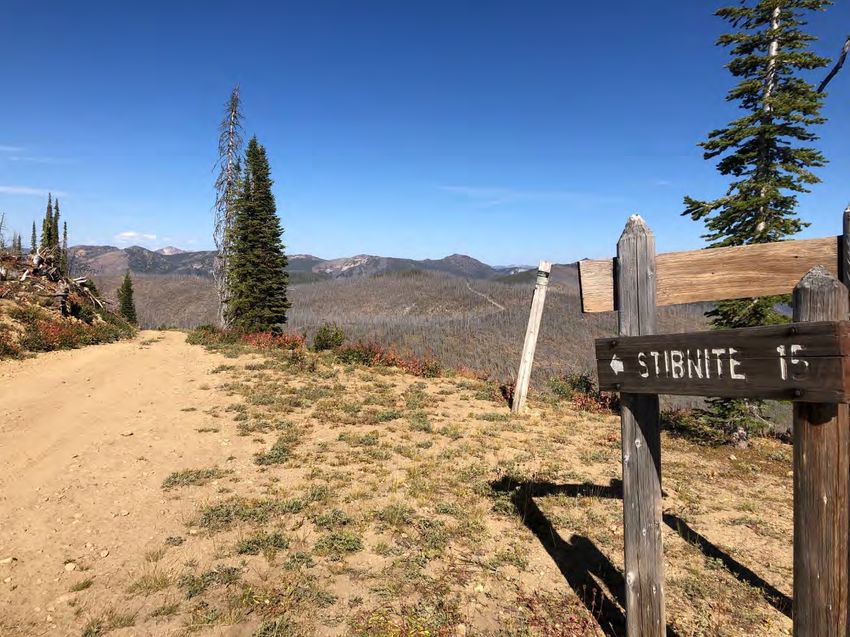
OUR TEAM 6
7

We can take an area abandoned after 100 years of
mining activity and use a sustainable approach to
 restore the environment and develop a modern
 mining project with critical mineral production

                                                    7
8

IDAHO OPPORTUNITY
                ECONOMIC INVESTMENT

   Commitment to Hire Local   Provide 500+ Direct Jobs
9

PRIVATE FUNDING FOR ENVIRONMENTAL
RESTORATION OF BROWNFIELDS SITE

                 SOLUTIONS FOR THE ENVIRONMENT

SEDIMENTATION           METAL LEACHING                 BLOCKED FISH MIGRATION
 Early repair of the   Pick up, reprocess, reuse and   Restore fish migration and provide
  largest source of      safely store 10.5M tons of       permanent river restoration
   sedimentation           tailings and spent ore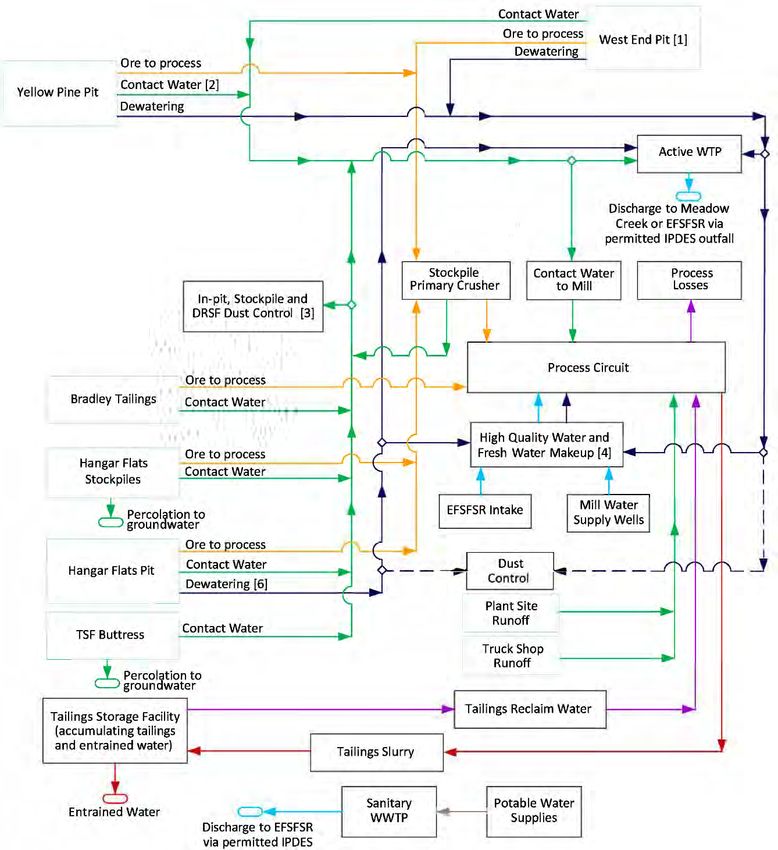
CRITICAL MINERAL ANTIMONY(1)                                                                                                                                                                             10

    GAINS PROJECT SUPPORT
                                                                                                                                                         World Antimony Production
         SUPPLY RISK                                                                                                                                            2019 (USGS)

     •    China and Russia dominate the world antimony supply (>80%)                                                                                              Turkey
                                                                                                                                                                                   Australia
                                                                                                                                                                                     1%
                                                                                                                                                                    2%
     •    No domestic antimony production in the United States                                                                                       Tajikistan
                                                                                                                                                                                                Bolivia
                                                                                                                                                                                                 2%
                                                                                                                                                       10%
     •    Midas Gold would become first domestic source of antimony                                                                                                                                  Burma
                                                                                                                                                                                                      2%
     •    Estimated production1 would equal ~30% of US annual
          demand

                                                                                                                                                      Russia

         CRITICAL USES                                                                                                                                 19%

                                                                                                                                                                                               China
                                                                                                                                   Other countries                                             63%
                                                                                                                                   that produce less
                                                                                                                                   than 1% of global            39%
                                                                                                                                   supply: Ecuador,
                                                                                                                                   Guatemala, Honduras,
                                                                                                                                   Iran, Kazakhstan, Kyrgyzstan,
                                                                                                                                   Laos, Mexico, Pakistan, Vietnam

1. Antimony is a chemical element included on the U.S. Interior Department’s list of Critical Minerals
Based on the 2020 FS, which is intended to be read as a whole and sections should not be read or relied upon out of context. The information in this presentation is subject to the assumptions, exclusions and
qualifications contained in the FS. See “Regulatory Information” at the end of this presentation.
11 2020 ACCOMPLISHMENTS Draft Environmental Impact Statement published (August 2020) Public Comment Period concluded (October 2020) Board refreshment (December 2020) Release of Feasibility Study (December 2020)
PROJECT MILESTONES
                                                                                                                  12

2020 (Q3)    2020 (Q4)    2021 (Q3)     2022         2022/23              2026             ~2040          ~2050
Draft EIS   FS Released   Final EIS   Ancillary   Construction,      Begin Commercial   Begin Post-Op    Most Final
                            ROD       Permits + Begin Mitigation +     Operations +      Restoration    Reclamation
                                      Financing      Legacy             Restoration                      Completed
                                                   Restoration
13
FEASIBILITY STUDY
The Feasibility Study was prepared under the direction of Independent Qualified Persons (QPs) and in
compliance with National Instrument 43-101 (NI 43-101) the Canadian Securities Administrators (CSA)
standards for reporting mineral properties.FEASIBILITY STUDY HIGHLIGHTS 14
Early Production Life-of-Mine Notes:
Component 1. In this release, “M” = million, “k”
Years 1-4 Years 1-15 = thousand, all amounts in US$,
gold and silver reported in troy
Total Recovered Gold 1,862 koz 4,284 koz ounces (“oz”)
Total Recovered Antimony 76 Mlbs 118 Mlbs 2. See non-International Financial
Reporting Standards (“IFRS”)
Average Annual Recovered Gold 466 koz/yr 301 koz/yr measures listed at the end of this
presentation.
Cash Costs Net of By-Product Credits $317/koz $528/koz 3. The FS assumes 100% equity
All-in Sustaining Costs Net of By-Product Credits $427/koz $625/koz financing of the Project.
Initial Capital including Contingency $1,292 million
$1,600/oz gold - $20/oz silver - $3.50/lb antimony
After-Tax Net Present Value at 5% Discount Rate $1,347 million
Annual Average EBITDA $576 million $298 million
Annual Average After Tax Free Cash Flow $509 million $248 million
After Tax Internal Rate of Return 22.3%
After Tax Payback Period 2.9 years
Based on the 2020 FS, which is
$1,850/oz gold - $24/oz silver - $3.50/lb antimony intended to be read as a whole
and sections should not be
After-Tax Net Present Value at 5% Discount Rate $1,900 million read or relied upon out of
context. The information in this
Annual Average EBITDA $689 million $368 million presentation is subject to the
assumptions, exclusions and
Annual Average After Tax Free Cash Flow $594 million $302 million qualifications contained in the
FS. See “Regulatory
After Tax Internal Rate of Return 27.7% Information” at the end of this
After Tax Payback Period 2.5 years presentation.15
FS TEAM Midas Gold team led by John Meyer, VP Development
Independent Qualified Persons include:
Qualified Person Company Responsibilities
Richard K. Zimmerman, SME-RM M3 Engineering & Technology Infrastructure & financial modeling
Art Ibrado, P.E. M3 Engineering & Technology Mineral processing
Grenvil Dunn, C.Eng. Hydromet WA Hydrometallurgy
Garth D. Kirkham, P.Geo. Kirkham Geosystems Mineral resources
Christopher J. Martin, C.Eng. Blue Coast Metallurgy Metallurgy
Chris J. Roos, P.E. Value Consulting Mineral reserves
Scott Rosenthal, P.E. Value Consulting Mine planning
Peter E. Kowalewski, P.E. Tierra Group International Tailings management & closureFEASIBILITY STUDY
16
KEY TECHNICAL FOCUS AREAS
• Geology - updated geological models and
mineral resource estimates based on
additional drilling
• Mining – pit optimization, mine sequencing,
and low-grade ore stockpiling
• Process - flowsheet optimizations resulting
from three pilot plant studies
• Financial - addition of an onsite limestone
and metallurgical lime plant
• Environment - exhaustive water
management, water treatment and closure
planning
Based on the 2020 FS, which is intended to be read as a whole and sections should not be read or
relied upon out of context. The information in this presentation is subject to the assumptions, exclusions
and qualifications contained in the FS. See “Regulatory Information” at the end of this presentation.ACCESS & OFFSITE INFRASTRUCTURE
17
Stibnite Gold Project
CURRENT INFRASTRUCTURE:
• 84 road miles from Cascade
• 63 road miles from McCall
• Solar & diesel power generation
OPERATIONS INFRASTRUCTURE:
• Upgrade and extend existing
power infrastructure
• Stibnite Gold Logistics Facility
• Upgrade and connect existing Based on the 2020 FS, which is intended to be read as a whole and sections should not be read or relied upon out of context. The
road & Road Maintenance Facility information in this presentation is subject to the assumptions, exclusions and qualifications contained in the FS. See “Regulatory
Information” at the end of this presentation.18
HISTORICAL MINING
DISTRICT
BROWNFIELD
Based on the 2020 FS, which is intended to be read as a whole and sections should not be read or relied
upon out of context. The information in this presentation is subject to the assumptions, exclusions and
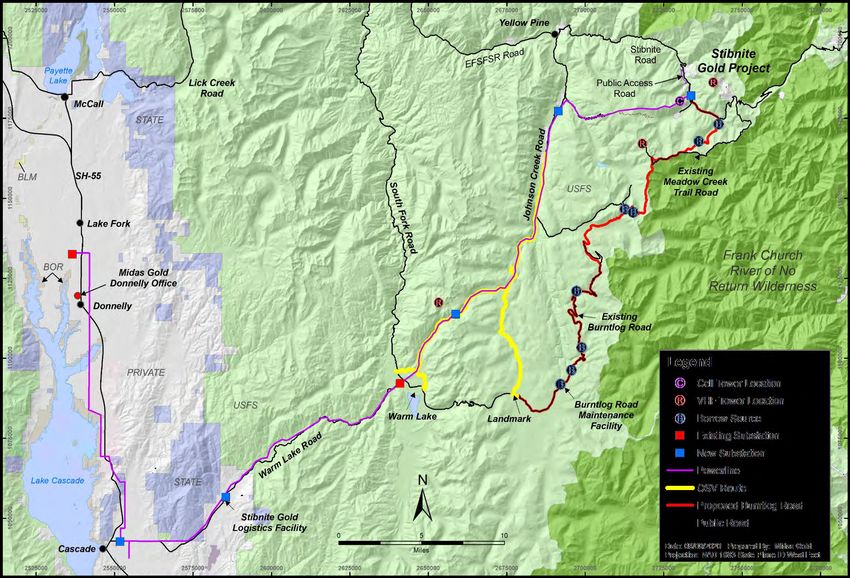
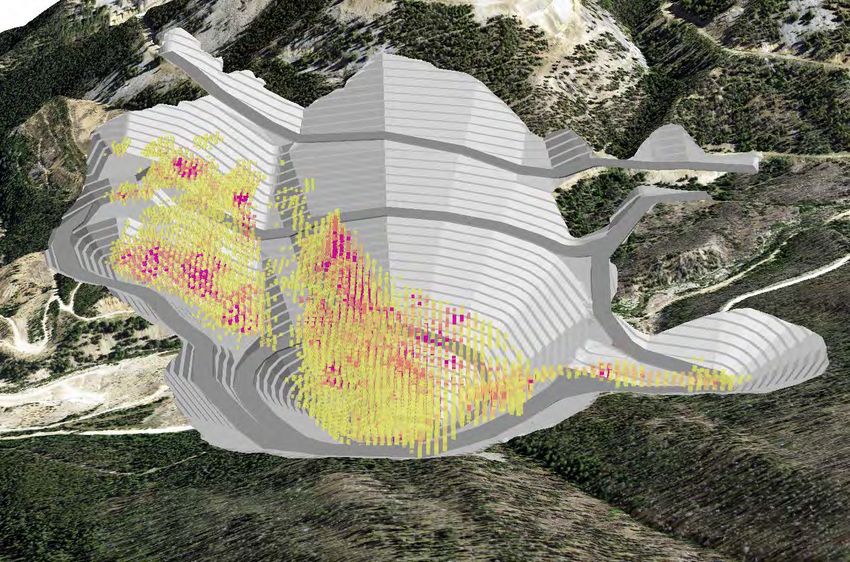
qualifications contained in the FS. See “Regulatory Information” at the end of this presentation.STIBNITE GOLD PROJECT 19
SITE LAYOUT
• Three open pits (Yellow Pine, Hangar Flats, West End)
and reprocessing of historical tailings (overall 2.5:1 strip
ratio)
• Tunnel to manage fish and water around Yellow Pine pit
• Ore stockpiling to bring high-grade ore forward while
increasing mineral reserves and mine life (14.3 years)
• Centrally located ore processing plant (20 kt/d)
• Geosynthetic-lined tailings storage facility with rockfill
embankment and 81 Mt buttress for commingled
flotation and concentrate tailings
• Backfilling of Yellow Pine pit to restore river (EFSFSR)
and provide permanent fish passage on closure
• Worker housing facility for construction and operations
Based on the 2020 FS, which is intended to be read as a whole and sections should not be read or relied upon
out of context. The information in this presentation is subject to the assumptions, exclusions and qualifications
contained in the FS. See “Regulatory Information” at the end of this presentation.MINERAL RESOURCES & RESERVES
20
Measured & Indicated Mineral Resources
include 6.0 Moz gold at 1.42 g/t with 206 Mlbs Proven & Probable Mineral Reserves
antimony at 0.07% contained in 132 Mt
3,500 include 4.8 Moz gold at 1.43 g/t
with 148 Mlbs antimony at 0.06%
3,000 contained in 104 Mt
Gold (thousands Ounces)
2,500
Gold M&I Mineral Resource
2,000
Gold P&P Mineral Reserve
1,500
1,000 Based on the 2020 FS, which is
intended to be read as a whole
and sections should not be read
or relied upon out of context.
500 The information in this
presentation is subject to the
assumptions, exclusions and
qualifications contained in the
0 FS. See “Regulatory Information”
Yellow Pine Hangar Flats West End Historical Tailings at the end of this presentation.MINING & STOCKPILING 21
Top Bench =
Mining Statistics N 6,880 ft
Open Pit Ore Mined 102 Mt
Historical Tailings Mined 2.7 Mt
Upstream Valley
Project Strip Ratio 2.5 waste : 1 ore Bottom = 6,150 ft
Mining Cost $2.47/t Downstream Valley
Bottom = 6,100 ft
Ore to Mill 20.0 kt/day
Mine Life 12.0 years Pit Bottom =
5,360 ft
Mill Life 14.3 years
Based on the 2020 FS, which is intended to be read as a whole and sections should not be read or relied upon out of
context. The information in this presentation is subject to the assumptions, exclusions and qualifications contained in the
FS. See “Regulatory Information” at the end of this presentation.MILL FEED & GOLD GRADE BY DEPOSIT
22
Mill Ore Feed Tonnes (x 1,000) 9,000 3.0
Mill Ore Feed Gold Grade g/t
8,000
2.50 2.5
7,000
2.20
2.10
6,000 2.0
1.85 1.86
5,000
1.53 1.43 1.5
4,000 1.18 1.28
1.12
3,000 1.07 1.0
0.96
2,000 0.54
0.5
0.61
1,000 0.50
- 0.0
1 2 3 4 5 6 7 8 9 10 11 12 13 14 15
Year of Operation
Yellow Pine Direct Ore Feed Hangar Flats Direct Ore Feed West End Direct Ore Feed
Historical Tailings Ore Feed Long-Term Stockpile Feed Average Au Grade (g/t)
Based on the 2020 FS, which is intended to be read as a whole and sections should not be read or relied upon out of context. The information in this
presentation is subject to the assumptions, exclusions and qualifications contained in the FS. See “Regulatory Information” at the end of this presentation.ORE PROCESSING Crushing,
SAG & Ball
Milling
23
FLOW SHEET Antimony
High Sb Stibnite Flotation
• Optimized pyrite flotation circuit with deferral of whole Concentrate
Sulfide
ore leach circuit until needed for West End oxide
Low Sb
• Optimized pH control of POX feed using onsite sourced Sulfide Pyrite Flotation
ground limestone to improve metallurgical recoveries
and increased arsenic stability
• Elimination of solid-liquid separation circuit after POX
Oxide
• Tw0-step neutralization circuit with ground limestone Transitional
POX
Residuals
in first stage to reduce lime consumption
• Dore metallurgical recoveries1:
• Gold at 68% - 91% (88.9% average)
• Silver at 23.2% Average
Gold Leach
• Antimony concentrate metallurgical recoveries1,2:
• Antimony at 84% - 91% (89.5% average)
• Gold at 1% - 2%
Electrowinning Dore
• Silver at 59% -65%
Based on the 2020 FS, which is intended to be read as a whole and sections should not be read or relied upon
1 reporting LOM averages by ore type out of context. The information in this presentation is subject to the assumptions, exclusions and qualifications
2 excluding historical tailings
contained in the FS. See “Regulatory Information” at the end of this presentation.RECOVERED GOLD PRODUCTION 24
700
600
Recovered Gold (koz)
500
400
300
200
100
-
1 2 3 4 5 6 7 8 9 10 11 12 13 14 15
Year of Operation
Based on the 2020 FS, which is intended to be read as a whole and sections should not be read or relied upon out of context. The information in this presentation is subject to the assumptions, exclusions and qualifications
contained in the FS. See “Regulatory Information” at the end of this presentation.RECOVERED ANTIMONY PRODUCTION 25
35,000
30,000
Recovered Antimony (klb)
25,000
20,000
15,000
10,000
5,000
-
1 2 3 4 5 6 7 8 9 10 11 12 13 14 15
Year of Operation
Based on the 2020 FS, which is intended to be read as a whole and sections should not be read or relied upon out of context. The information in this presentation is subject to the assumptions, exclusions and qualifications
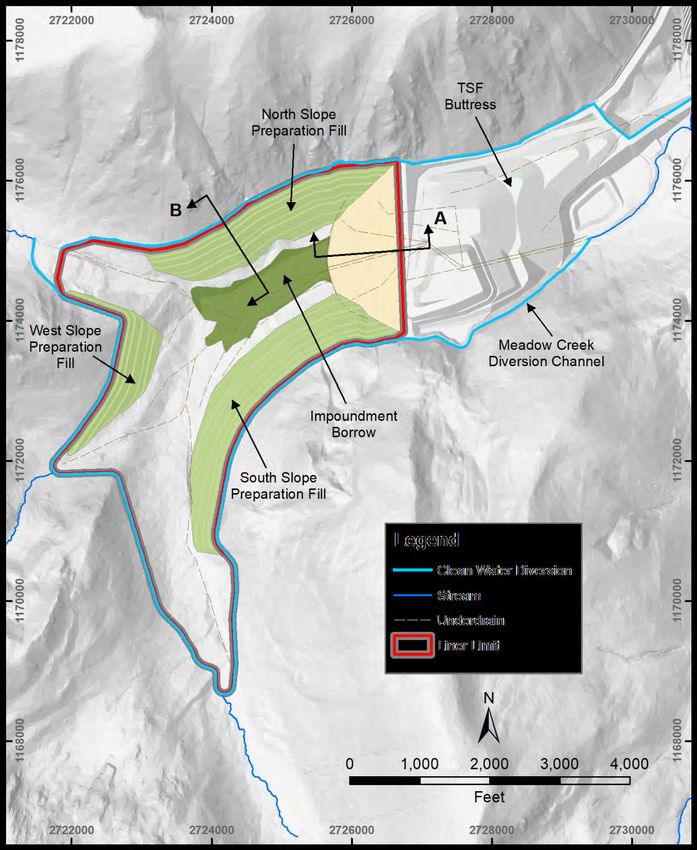
contained in the FS. See “Regulatory Information” at the end of this presentation.TAILINGS & WATER 26
MANAGEMENT
• Storage for ~109 million tonnes of tailings solids
• Composite liner system with rockfill embankment & buttress
• Water management to protect and improve water quality and
to provide water for operations
• Water management considerations dominated by spring melt
• Staged water treatment plant capacity beginning at 300 gpm
and peaking mid mine life at 2,000 gpm
Based on the 2020 FS, which is intended to be read as a whole and sections should not be read or relied
upon out of context. The information in this presentation is subject to the assumptions, exclusions and
qualifications contained in the FS. See “Regulatory Information” at the end of this presentation.FS CAPITAL COST (CAPEX) SUMMARY 27
Notes:
Initial Sustaining Closure Total 1. Initial mining CAPEX includes
Area Detail CAPEX CAPEX CAPEX CAPEX environmental remediation
costs.
(M $) (M $) (M $) (2) (M $) 2. Closure and mitigation assume
self-performed costs, which will
Mine Costs (1) 84 119 - 203 differ for those assumed for
financial assurance calculations
required by regulators. Costs
Processing Plant 460 49 - 510 include stream and wetland
Direct Costs restoration and reclamation
On-Site Infrastructure 186 82 6 273 costs.
3. Numbers have been rounded
Off-Site Infrastructure 124 - - 124 and may not sum correctly
Indirect Costs 244 - - 244
Owner's Costs 21 - - 21
Offsite Environmental Mitigation Costs 14 - - 14
Onsite Mitigation, Monitoring and
3 23 99 126 Based on the 2020 FS, which is
Closure Costs(2) intended to be read as a whole
and sections should not be read
or relied upon out of context.
Total CAPEX without Contingency 1,137 273 105 1,515 The information in this
presentation is subject to the
Contingency 155 22 1 178 assumptions, exclusions and
qualifications contained in the
FS. See “Regulatory Information”
Total CAPEX with Contingency 1,292 295 106 1,693 at the end of this presentation.FS OPERATING COST (OPEX) SUMMARY
28
Years 1-4 Life of Mine Notes:
Total Production Cost Item 1. Defined as non-sustaining
($/t milled) ($/oz Au) ($/t milled) ($/oz Au) reclamation and closure costs
in the post-operations period.
Mining 9.71 155 8.22 202 2. Initial Capital includes
capitalized preproduction.
Processing 13.18 210 12.81 315
G&A (including Water Treatment) 3.57 57 3.46 85
Cash Costs Before By-Product Credits 26.47 422 24.49 603
By-Product Credits (6.60) (105) (3.05) (75)
Cash Costs After of By-Product Credits 19.87 317 21.45 528
Royalties 1.70 27 1.10 27
Refining and Transportation 0.49 8 0.26 6
Total Cash Costs 22.06 352 22.81 561
Sustaining CAPEX 4.69 75 2.60 64 Based on the 2020 FS, which is
intended to be read as a whole
All-In Sustaining Costs 26.75 427 25.41 625 and sections should not be read
or relied upon out of context.
Reclamation and Closure(1) - - 1.02 24 The information in this
presentation is subject to the
Initial (non-sustaining) CAPEX(2) - - 12.35 304 assumptions, exclusions and
qualifications contained in the
FS. See “Regulatory Information”
All-In Costs - - 38.78 954 at the end of this presentation.AFTER TAX CASH FLOW (BASE CASE $1,600) 29 Based on the 2020 FS, which is intended to be read as a whole and sections should not be read or relied upon out of context. The information in this presentation is subject to the assumptions, exclusions and qualifications contained in the FS. See “Regulatory Information” at the end of this presentation.
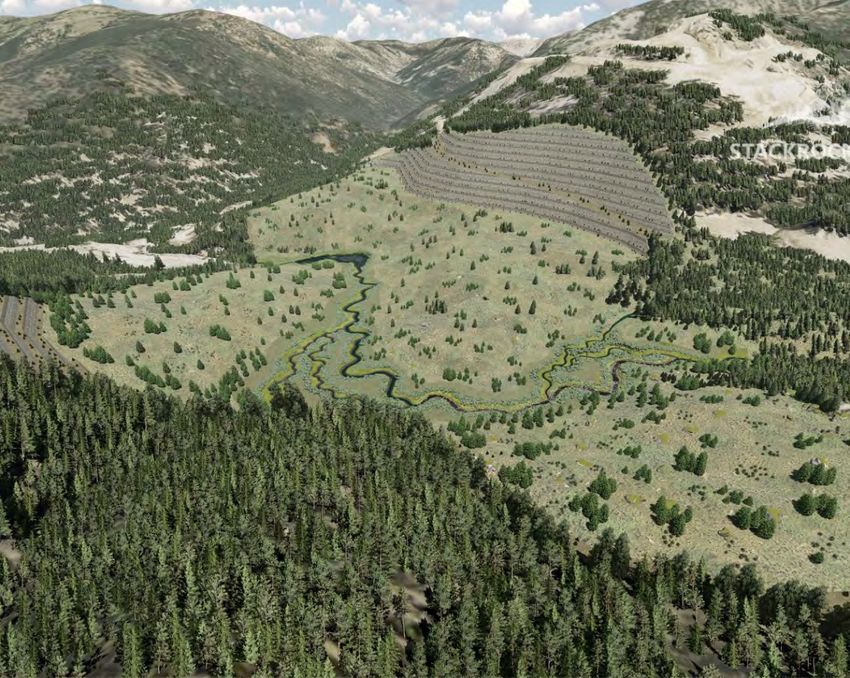
RESTORE THE SITE CLOSURE PLAN
                                                                                                                                                                                                          30

        Post mining land uses include wildlife
           fisheries & dispersed recreation

 • Create a self-sustaining natural environment

 • Support healthy fish and wildlife population

 • Significant concurrent reclamation and restoration

 • Revegetation, reforestation & wetland mitigation

 • Address historical impacts from legacy mining
 • Estimated 10+ year post-operations closure period
      (Most significant cost early in closure period)

 • 25 years of water treatment estimated

Based on the 2020 FS, which is intended to be read as a whole and sections should not be read or relied upon out of context. The information in this presentation is subject to the assumptions, exclusions
and qualifications contained in the FS. See “Regulatory Information” at the end of this presentation.
PROJECT DEVELOPMENT NEXT STEPS
31
• File NI 43-101 Technical Report
• Complete SK-1300 Technical Report
• EPCM Contractor Selection
• Primary Equipment Vendor Selection
• Engineering to Support Ancillary Permitting
• Basic Engineering32 CONCLUSION
LARGEST INDEPENDENT
                                                                                           1,2                                                                                                       33

                                          GOLD RESERVE IN THE LOWER 48
                                                                                                    3

                               Stibnite (Midas Gold)3
                                        Midas (LOM)                                                                                                           4.8

                                                  Marigold                                                                             3.6

                                      Castle Mountain                                                                                 3.6

                                     Round Mountain                                                                  2.4

                                                        Haile                                                        2.4

                                         Bald Mountain                                            1.3

                                                                 0.0                    1.0                    2.0         3.0              4.0              5.0
                                                                                 2019 Year-End Proven & Probable Gold (Moz)
                                                                    Source: S&P Global – Market Intelligence
1. Independent defined as not owned by Barrick or Newmont
2. Excludes Hycroft due to technical uncertainty regarding recoverability of reserves
3. Based on the 2020 FS which is intended to be read as a whole and sections should not be read or relied upon out of context. The information in this presentation is subject to the assumptions,
   exclusions and qualifications contained in the FS. See “Regulatory Information” at the end of this presentation.
ONE OF HIGHEST-GRADE OPEN PIT 34
GOLD DEPOSITS IN LOWER 48
Stibnite Years Midas
1-4 (Midas
(YrsGold)
1-4)*2 2.2
Haile 1.7
Stibnite LOMMidas
(Midas(LoM)*
Gold)2 1.4
Goldfield 1.0
Gold Bar 1.0
Mount Hamilton 0.8
Relief Canyon 0.8
Wharf 0.7
Round Mountain 0.7
Soledad Mountain 0.7
Bald Mountain 0.6
Castle Mountain 0.6
Marigold 0.5
0.00 0.50 1.00 1.50 2.00 2.50
2019 Year-End Proven & Probable Gold Grade (g/t)
Source: S&P Global – Market Intelligence
1. Independent defined as not owned by Barrick or Newmont
2. Based on the 2020 FS which is intended to be read as a whole and sections should not be read or relied upon out of context. The information in this presentation is subject to the assumptions,
exclusions and qualifications contained in the FS. See “Regulatory Information” at the end of this presentation.POISED TO BE LARGEST INDEPENDENT1
35
PRODUCING MINE IN LOWER 48
Stibnite Years 1-4 (Midas
Midas (YrsGold)2
1-4)* 466
Round Mountain 362
Stibnite LOM Midas
(Midas(LoM)*
Gold)2 301
Marigold 220
Bald Mountain 188
Pogo 155
Haile 146
0 100 200 300 400 500
2019 Annual Gold Production (k oz)
Source: S&P Global – Market Intelligence
1. Independent defined as not owned by Barrick or Newmont
2. Based on the 2020 FS which is intended to be read as a whole and sections should not be read or relied upon out of context. The information in this presentation is subject to the assumptions,
exclusions and qualifications contained in the FS. See “Regulatory Information” at the end of this presentation. Source: S&P Global – Market IntelligenceALL-IN-SUSTAINING COSTS EXPECTED 36
TO BE IN LOWEST QUARTILE
2500
All-in-Sustaining Cost ($/oz)
2000
1500
Stibnite Gold Project
(Midas Gold)1
1000 Yr1-4 LOM
500
0
Average Annual Paid Gold (represented as bar width)
Source: S&P Global – Market Intelligence
1. Based on the 2020 FS, which is intended to be read as a whole and sections should not be read or relied upon out of context. The information in this presentation is subject to the assumptions, exclusions
and qualifications contained in the FS. See “Regulatory Information” at the end of this presentation.SIGNIFICANT UPSIDE WITH HIGHER GOLD PRICES 37
MIDAS GOLD TRADES AT DEEP DISCOUNT TO PROJECT NET ASSET VALUE1
$2,350 $4,689
$2,995
Gold Price (US$/oz)
$2,100 $3,888
$2,448
$1,850 $3,087
$1,900
$1,600 $2,281
$1,347
NPV at 0%
$1,350 $1,470 NPV at 5%
$791
MAX FD Mkt Cap $545 Current MAX Mkt Cap2 Only 29% of NPV2 (5%) at $1,850/oz Gold Price
$0 $1,000 $2,000 $3,000 $4,000 $5,000
After Tax Net Present Value1 (M $)
1. Based on the 2020 FS, which is intended to be read as a whole and sections should not be read or relied upon out of context. The information in this presentation is subject to the assumptions, exclusions
and qualifications contained in the FS. See “Regulatory Information” at the end of this presentation.
2. Midas Gold Fully Diluted Market Cap based on $1.01 share price38
VALUATION SET TO RE-RATE ONCE PERMITTED
350%
Pre-Permitting Permitted
Market Cap As % of Spot NAV4
300%
262%
250%
200%
150%
127%
100%
70% 72% 76%
48% 53%
50% 29% 32%
0%
Midas
Midas Integra Gold Skeena Ascot Marathon Sabina NovaGold Orla
Gold1,2,3 Standard
1. Midas Gold based on market capitalization assuming full conversion of Paulson Convertible Notes.
2. The 2020 FS is intended to be read as a whole and sections should not be read or relied upon out of context. The information in this presentation is subject to the assumptions, exclusions and qualifications
contained in the FS. See “Regulatory Information” at the end of this presentation.
3. Market capitalizations based on fully diluted share count ($1.01 share price) as of latest filing date (including convertible bonds) and NAV based on after-tax NPV at 5% discount rate based on last available
NAV within $1,850/oz gold price.
4. Based on December 18, 2020 stock prices.STRONG & SUPPORTIVE SHAREHOLDER BASE
39
Paulson
44.1%
Barrick
11.3%
Public
Float
42.5% Franklin
2.1%
Based on current shareholding excluding convertible notes40
A UNIQUE AMERICAN OPPORTUNITY
• One of largest undeveloped independent gold reserves in the United States
• Slated to become largest independently owned gold mine in the United States
• Second highest grade undeveloped open pit deposit in Lower 48 of United States
• Lowest quartile projected costs
• Current market cap only 29% of project NPV(5%) at $1,850/oz gold price*
• Receipt of permits expected to unlock material value
• Environmental restoration funded through mine redevelopment
• Critical minerals production
• Capital investment and jobs
* Based on market capitalization assuming conversion of Paulson convertible notes. The 2020 FS is intended to be read as a whole and sections should not be read or relied upon out of context. The information in this
presentation is subject to the assumptions, exclusions and qualifications contained in the FS. See “Regulatory Information” at the end of this presentation.REGULATORY INFORMATION
41
The FS was compiled by M3 under the direction of Independent QPs and in compliance with NI 43-101 standards for reporting mineral properties, Companion Policy 43-101CP, and Form 43-
101F1. Independent QPs for the study include: Richard Zimmerman, SME-RM (onsite and offsite infrastructure, cost estimating and financial modeling) and Art Ibrado, P.E. (mineral processing)
with M3; Garth Kirkham, P.Geo. (mineral resources) with Kirkham Geosystems Ltd.; Christopher Martin, C.Eng. (metallurgy) with Blue Coast Metallurgy Ltd.; Grenvil Dunn, C.Eng.
(hydrometallurgy) with Hydromet WA (Pty) Ltd.; Chris Roos, P.E. (mineral reserves) and Scott Rosenthal P.E. (mine planning) with Value Consulting, Inc.; and Peter Kowalewski, P.E. (tailings
storage facility and closure) with Tierra Group International, Ltd.
The technical information in this presentation has been prepared in accordance with Canadian regulatory requirements set out in National Instrument 43-101 and reviewed and approved by
Austin Zinsser, SME-RM, Sr. Resource Geologist for Midas Gold Idaho, Inc., and a Qualified Person. Mr. Zinsser is not responsible for statements attributed to officers and directors of Midas
Gold Corp, or other non-technical information in this news release.
For readers to fully understand the information in this News Release, they should read the Report (to be available on www.SEDAR.com, www.sec.gov or at www.midasgoldcorp.com within 45
days of December 22, 2020) in its entirety, including all qualifications, assumptions and exclusions that relate to the information set out in this presentation that qualifies the technical
information contained in the Report. The Report is intended to be read as a whole, and sections should not be read or relied upon out of context. The technical information in this news
release is subject to the assumptions and qualifications contained in the Report. The FS supersedes and replaces the technical report entitled “Amended Preliminary Feasibility Study Technical
Report for the Stibnite Gold Project, Idaho” prepared by M3 and dated March 28, 2019 and that report should no longer be relied upon. Mineral Resource Statements in the FS supersede and
replace the Mineral Resources disclosed publicly on February 15, 2018, which should no longer be relied upon.
All Mineral Resources have been estimated in accordance with CIM definitions, as required under NI43-101. Mineral Resources are reported in relation to a conceptual pit shell to
demonstrate potential for economic viability, as required under NI43-101; mineralization lying outside of these pit shells is not reported as a Mineral Resource. Mineral resources are not
mineral reserves and do not have demonstrated economic viability. Mineral resource estimates include inferred mineral resources that are considered too speculative geologically to have
economic considerations applied to them that would enable them to be categorized as mineral reserves. It is reasonably expected that the majority of inferred mineral resources could be
upgraded to Indicated.
The mineral resources and mineral reserves at the Stibnite Gold Project are contained within areas that have seen historic disturbance resulting from prior mining activities. In order for Midas
Gold to advance its interests at Stibnite, the Project will be subject to a number of federal, State and local laws and regulations and will require permits to conduct its activities. However,
Midas Gold is not aware of any environmental, permitting, legal or other reasons that would prevent it from advancing the project.
NON-IFRS REPORTING MEASURES
04
"Cash Costs", “All-in Sustaining Costs” and “Total costs” are not Performance Measures reported in accordance with International Financial Reporting Standards (“IFRS”). These performance measures are included because the
statistics are key performance measures that management uses to monitor performance. Management uses these statistics to assess how the Project ranks against its peer projects and to assess the overall effectiveness and
efficiency of the contemplated mining operations. These performance measures do not have a meaning within IFRS and, therefore, amounts presented may not be comparable to similar data presented by other mining comp
anies. These performance measures should not be considered in isolation as a substitute for measures of performance in accordance with IFRS.42
YOU MAY ASK WHY I
BELIEVE MIDAS GOLD HAS
THE RIGHT SOLUTION. IT IS
GROUNDED IN THE FACT
THAT LOCAL PEOPLE LEAD
THANK YOU THE PROJECT AND
RESTORATION HAS
ALREADY BEGUN.
WILLIE SULLIVAN, YELLOW PINE
WWW.MIDASGOLDIDAHO.COM
EMAIL: community@midasgoldinc.com PHONE: (208) 901-3060
SUPPORT STIBNITE
WWW.MIDASGOLDCORP.COM
EMAIL: info@midasgoldcorp.com PHONE: (778) 724-4700 42You can also read