Lisbon, May 2020 - edp.com
←
→
Page content transcription
If your browser does not render page correctly, please read the page content below
Lisbon, May 2020

This document has been prepared by EDP - Energias de Portugal, S.A. (the "Company") solely for use at the presentation to be made on this date and its purpose is merely of informative nature and, as such, it
 may be amended and supplemented. By attending the meeting where this presentation is made, or by reading the presentation slides, you acknowledge and agree to be bound by the following limitations and
 restrictions. Therefore, this presentation may not be distributed to the press or to any other person in any jurisdiction, and may not be reproduced in any form, in whole or in part for any other purpose without
 the express and prior consent in writing of the Company.

 This presentation and all materials, documents and information used therein or distributed to investors in the context of this presentation do not constitute or form part of and should not be construed as, an
 offer (public or private) to sell or issue or the solicitation of an offer (public or private) to buy or acquire securities of the Company or any of its affiliates or subsidiaries in any jurisdiction or an inducement to enter
 into investment activity in any jurisdiction.

 Neither this presentation nor any materials, documents and information used therein or distributed to investors in the context of this presentation or any part thereof, nor the fact of its distribution, shall form
 the basis of, or be relied on in connection with, any contract or commitment or investment decision whatsoever and may not be used in the future in connection with any offer (public or private) in relation to
 securities issued by the Company.

 Matters discussed in this presentation may constitute forward-looking statements. Forward-looking statements are statements other than in respect of historical facts. The words “believe,” “expect,” “anticipate,”
 “intends,” “estimate,” “will,” “may”, "continue," “should” and similar expressions usually identify forward-looking statements. Forward-looking statements include statements regarding: objectives, goals,
 strategies, outlook and growth prospects; future plans, events or performance and potential for future growth; liquidity, capital resources and capital expenditures; economic outlook and industry trends; energy
 demand and supply; developments of the Company’s markets; the impact of legal and regulatory initiatives; and the strength of the Company’s competitors. The forward-looking statements in this presentation
 are based upon various assumptions, many of which are based, in turn, upon further assumptions, including without limitation, management’s examination of historical operating trends, data contained in the
 Company’s records and other data available from third parties. Although the Company believes that these assumptions were reasonable when made, these assumptions are inherently subject to significant known
 and unknown risks, uncertainties, contingencies and other important factors which are difficult or impossible to predict and are beyond its control. Important factors that may lead to significant differences
 between the actual results and the statements of expectations about future events or results include the company’s business strategy, financial strategy, national and international economic conditions,
 technology, legal and regulatory conditions, public service industry developments, hydrological conditions, cost of raw materials, financial market conditions, uncertainty of the results of future operations, plans,
 objectives, expectations and intentions, among others. Such risks, uncertainties, contingencies and other important factors could cause the actual results, performance or achievements of the Company or
 industry results to differ materially from those results expressed or implied in this presentation by such forward-looking statements.

 The information, opinions and forward-looking statements contained in this presentation speak only as at the date of this presentation, and are subject to change without notice unless required by applicable law.
 The Company and its respective directors, representatives, employees and/or advisors do not intend to, and expressly disclaim any duty, undertaking or obligation to, make or disseminate any supplement,
 amendment, update or revision to any of the information, opinions or forward-looking statements contained in this presentation to reflect any change in events, conditions or circumstances.

RESULTS PRESENTATION                                                                                                                                                                                                            2
EBITDA: +6% YoY
         Renewables production +16%: Hydro recovery vs. very weak 1Q19, wind resources below avg.
         Sound results energy management                                                                                     EBITDA
         Brazil: Negative forex impact (BRL vs. EUR: -13%)

  Net Profit: +45% YoY
         Recurring Net Profit +51% to €252 Mn
                                                                                                                             Net Profit
         1Q20 includes €45 Mn non-recurring cost on bond buyback
         Avg cost of debt -60bps to 3.4% supported by competitive refinancing

  Net debt: -8% YTD
         €12.7 Bn Net Debt to the lowest level since 2007                                                                    Net Debt /
                                                                                                                             EBITDA2
         Tariff deficit sale (€0.8 Bn), Asset Rotation in Brazil (€0.3 Bn)
         Financial liquidity Mar-20: €6.9 Bn, covers financing needs beyond 2022

         2019 dividend: €0.19/share (81% payout ratio1); payment date: May 14th                                              Dividend
                                                                                                                             per share
1) Based on recurring net profit | 2. Adjusted to Regulatory Receivables and the temporary impact from tariff deficit sale
RESULTS PRESENTATION                                                                                                                      3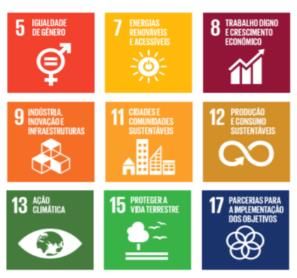
4
EDP Hydro production in Iberia                                 EDP Wind production
       TWh                                                             TWh
                                                                                                  +2% YoY, if excluding 0.8TWh
                                                                                                  production in 1Q19 from wind
                                                                                                  farms subject to asset rotation

                                                               4.9                        8.4
                                                                                                 7.7

                                  2.7

                                1Q19                           1Q20                       1Q19   1Q20

Hydro resources                                                       Wind resources
vs. LT Avg.1                                                          vs. LT Avg. (P50)
Hydro reservoir
YE1 (TWh)

1) Source: REN. Hydro resources reference from Portugal only
RESULTS PRESENTATION                                                                                                                5
Electricity generation in 1Q20 Wind Capacity evolution YoY
TWh GW, Mar-20
0.7
Coal Other
6% 2% 0.8 GW net
CCGT capacity
12% under construction
Solar 0% as of Mar-20
42% Wind 1.3
37%
-0.6
Hydro
Built-out Asset rotation ∆ YoY
renewables
1) EBITDA + Equity capacity
RESULTS PRESENTATION 6EBITDA1 1Q20
€ Mn; YoY growth,%
∆ YoY
980
927
-€47 Mn Wind & Solar
549 +€65 Mn Hydro Iberia
Renewables 559 -€28 Mn Hydro Brazil
-€5 Mn Iberia
237 -€1 Mn Brazil
Networks
242
Client solutions & EM
203 +€82 Mn Iberia
Other/adjust 117 +€4 Mn Brazil
9 -9
1Q19 1Q20
1) FX Impact on EBITDA: -€21 Mn (BRL), +€3 Mn (USD)
RESULTS PRESENTATION 7EBITDA – Wind & Solar
€ Mn; YoY growth,%
387
1Q19 1Q20 YoY
340
Avg. Installed Capacity1, GW
Europe 233
179 Production vs. LT Avg. (P50), %
Electricity Production, TWh
Avg. selling price, €/MWh
North America 147 159
Brazil & Other
7 2
1Q19 1Q20
1) Considers capacity at EBITDA level
RESULTS PRESENTATION 8EBITDA – Hydro
€ Mn; YoY growth, %
209 1Q19 1Q20 YoY
172 Hydro Production1, TWh
Avg selling price2, €/MWh
Iberia 112 177
1Q19 1Q20 YoY
PLD, R$/MWh
Brazil 60
32 GSF
1Q19 1Q20
1) Excludes small hydro plants | 2) Does not consider results from hedging
RESULTS PRESENTATION 9EBITDA – Networks
€ Mn; YoY growth,%
1Q19 1Q20 YoY
Return on RAB Portugal 1, %
242 237 RAB Iberia2, € Mn
Opex Iberia, € Mn
Portugal 131 126
1Q19 1Q20 YoY
Transmission EBITDA, R$ Bn
Spain 34 34
Distribution EBITDA, R$ Bn
Brazil 77 76
Electricity distributed, TWh
1Q19 1Q20
1) RoRAB of HV/MV | 2) Accounting RAB as of March
RESULTS PRESENTATION 10EBITDA – Client Solutions & Energy Management
€ Mn; YoY growth,%
∆ YoY
203
Good results on energy management in Iberia supported
by forward contracting of energy prices and thermal spreads
and benefiting from increase of volatility in energy markets
117 145
Coal production -77% YoY (avg. load factor 12%)
Increasing penetration of supply services (+5% YoY)
EM & Thermal Iberia 77
Supply Iberia 22
Thermal Brazil 9
28 33
Supply & EM Brazil Improvement of thermal variable cost vs PPA benchmark
3 3
1Q19 1Q20
RESULTS PRESENTATION 11Weight on Opex
Operations Indicator YoY Change Main drivers
Iberia
Opex1 Strong performance in 1Q19 (-3% YoY)
EDP Brasil Avg. inflation: +3.8%2
Opex1 excl. growth and forex
EDPR Strong activity expansion with 1.3 GW
Adj. Core Opex/MW 4 under construction
Avg inflation in our geographies3: +1.8%
1 Opex ex-forex
Opex like-for-like (excl. growth)
1 Operating Costs Cash Recurring: 19: Caps (+€33M); ’20: Caps (€34M) and One-offs: Pecém maintenance seazonality (-€1M) and EDPD maintenance for ’19 storms (-€2M) | 2. Avg. IPCA 1Q20 vs. 1Q19 | 3. Inflation in 1Q20 vs 1Q20 in EDPR geographies, weighted
at installed capacity in each country | 4. Core Opex adjusted by asset rotation, offshore costs (mainly cross-charged to projects’ SPVs) and FX
RESULTS PRESENTATION 12Change in Net Debt: Mar-20 vs. Dec-19, € Bn
+68% YoY
Change in regulatory receivables: +€0.1 Bn
13.8 Anticipated sale of 2020 tariff deficit: -€0.6 Bn
-0.7
0.1
-0.5 12.7
-0.1
+€0.4 Bn expansion investment
(82% renewables, 18% networks)
-€0.3 Bn Asset Rotation & TEIs -€0.2 Bn forex impact
Net Debt Recurring Organic Net expansion Change in reg. Other & One-off Net Debt
Dec-19 Cash Flow investment receivables & Mar-20
Securitization
1) Based on net debt excluding regulatory receivables and impact of sale of tariff deficit, and recurring EBITDA of the last 12 months. Excludes €0.72 Bn related with Leasings’ debt accounted as Other Liabilities (IFRS 16 impact)
RESULTS PRESENTATION 13Net Financial Costs: 1Q20 vs. 1Q19 Bonds issued
€ Mn Amount Coupon Maturity
-20%
Sep-19 €600 Mn 0.70% 2026
206 Jan-20 (hybrid) €750 Mn 1.70% 2080
186 180
6 Apr-20 €750 Mn 1.63% 2027
61
35 144
Bonds matured / repurchased
Amount Coupon
Oct-19 USD 637 Mn 4.90%
Jan-20 USD 583 Mn 4.13%
1Q20 (hybrid) €750 Mn 5.38%
1Q19 Non- 1Q19 adj. Interest 1Q20 adj. Non- 1Q20 Jun-20 €233 Mn 4.13%
interest1 related interest2
Sep-20 €462 Mn 4.88%
Successful proactive debt management over the past quarters under a low
interest rates context and declining interest rates in Brazil over the past year
1) Other items in 1Q19 includes: -€6 Mn of Net foreign exchange differences | 2) Other items in 1Q20 are related with -€57 Mn liability management cost to repurchase €750 Mn hybrid bond with 5.4% coupon and -€5 Mn Net foreign exchange differences and
derivatives
RESULTS PRESENTATION 14Financial liquidity as of Mar-20 EDP consolidated debt maturity profile as of Mar-20
€ Bn € Bn EDP Brasil
EDP SA & EDP Finance BV and Other
2.8
Cash & Equivalents:
2.1 2.2
Of which: 1.7
1.5 1.4
1.3 1.4
Available Credit Lines: • >90% due in 2024/25
• >25 counterparties
0.6
Total Liquidity
2020 2021 2022 2023 2024 2025 2026 2027 > 2027
2020 1Q20: €0.75 Bn hybrid replacement Mar 9th: €0.8 Bn tariff Apr 7th: €0.75 Bn green 2H20 E: €2.2 Bn hydro
main events (new issue + buy back) deficit sale bond issuance disposal financial closing
RESULTS PRESENTATION 15Reported Net Profit 1Q20 Recurring Net Profit1
€ Mn ∆ YoY € Mn
EBITDA 980 53
252
D&A and -5
383
Provisions
EBIT 597 47
167
Financial Results 206 -20
Income Taxes 92 6
Extraordinary 4
63
Energy Tax
Non-controlling
90 8
interest
1Q19 1Q20
Net Profit 146 +45
1) One-offs 1Q19: extraordinary energy tax (-€67 Mn); One-offs 1Q20: extraordinary energy tax (-€61 Mn); one-off cost with hybrid bond buyback (-€45 Mn)
RESULTS PRESENTATION 1617
Focus on LT contracted competitive renewables (wind & solar), regulated networks
                       New investments with limited exposure to energy prices and demand volatility
                       Strict risk criteria: avg. contract maturity 15 years, contracted NPV >60%

                       €6 Bn target of proceeds in 2019-22 from asset rotations (€4 Bn) and disposals (€2 Bn)
                       Contribution to financial deleverage and reduction of merchant exposure

                       Upfront financial deleverage: Net Debt/EBITDA target of 3.2x for 2020
                       Conservative financial liquidity policy: ~24 months coverage of financing needs

                       €0.8 Bn digital capex to increase assets intelligence, operations and processes efficiency
                       Upfront targets: >85% of systems in the cloud, ~100% of our people digitally connected

                       Sustainable dividend policy: target payout range 75%-85%, €0.19/share as a floor
                       Distinctive ESG/green positioning, clear decarbonisation path: renewables >90%, CO2 specific
                       emissions -90% vs. 2005, coal free by 2030

RESULTS PRESENTATION                                                                                                  18
We take on the commitment We take on the commitment
by providing safety and through the supply of energy
business continuity and special attention to
those on the front line
We take on the commitment We take on the commitment
by contributing to maintain through the investment in
the value chain, promoting cultural projects and more
economic activity and the than 60 social initiatives
employment
We take on the commitment
through the proposal of a
stable and sustainable
dividend
RESULTS PRESENTATION 19Electricity Supply Portfolio Measures implemented
TWh, 2019
Suspension of supply cuts during lockdown period
B2B 62% clients with direct
57% B2C debit Flexibility of payment schedules and methods
Reinforcement of digital capabilities – renewed Customer
Area in Portugal
B2C Promotion of digital means of payment (website, MBWay,
21% etc.)
98% clients with direct
debit Support to those who are in the frontline of the covid’19
combat:
B2B Discount offer on electricity for NHS professionals and
care units
5% low income Free energy supply to hotels requisitioned in the fight
consumers, representing against this pandemic
44% B2C 1% of billing volume
B2B
1) Relates to regulated clients of our distribution companies
RESULTS PRESENTATION 20Weekly changes in distributed energy in Portugal Electricity demand Jan-20/Apr-20: YoY change4
% YoY % YoY
Residentials1 SMEs2 Corporates3
Higher weight of residential
20% -3% demand in consumption mix
10%
0%
Earlier start and more severe
-10% -7% restrictions of lockdown
-20%
-30%
EDP SP and ES regions:
-40% -4% impacted by temperature
W1 W3 W5 W7 W9 W11 W13 W15 W17
and reduction from a single
large client in free market
1) Normal Low Voltage | 2) Special Low Voltage | 3) Medium and High Voltage | 4) From January to April 2020. Data from REN to Portugal, REE to Spain; Brazil corresponds only to EDP Distribution concession areas in São Paulo and Espirito Santo (Preliminary data)
RESULTS PRESENTATION 21Hedging position: Apr-20 to Dec-20 Hedging position: 2021
TWh TWh
~100%
~19
B2C ~12 TWh/year,
~15
Baseload low churn rate
-3.6 TWh
due to hydro
disposal
Thermal spreads
~60%
Expected electricity Contracted Expected electricity Contracted
production electricity sales production electricity sales
Avg contracted electricity price close to €55/MWh (baseload, Avg contracted electricity price close to €50/MWh
excluding ancillary services and retail margin)
Gas LT contracts (~50% oil / ~50% TTF linked) represent ~60%
Avg contracted thermal spread: middle single digit of expected gas needs
Good energy management mitigates impact of adverse
market context
RESULTS PRESENTATION 22Ring-fenced financial policy: funding in local currency
Conservative leverage: net debt/EBITDA ~2.0x
R$3 Bn liquidity reinforcement: debt refinancing, TOTEX, etc.
Growth focused on transmission and LT contracted renewables: No exposure
to energy markets, stable revenues inflation updated
Integrated risk management in energy markets (distribution, supply,
generation)
RESULTS PRESENTATION 23Net Debt1 / EBITDA Disposals plan
6 hydro plants in Portugal (€2.2 Bn): EC approval granted on March 9th;
national regulatory requests already submitted; carve out and transition
4.0x agreements in final stage; financial closing expected in 2H20
3.4x Other complementary options may be considered: Other Iberian assets;Capacity additions 2020E Recent developments
EBITDA + Equity GW
Construction and supply chain disruptions that can
lead to potential COD delays in 2020, however
0.2 without impact in projects’ fundamentals
0.2
Medium-term execution on track with additional 0.5 GW secured YTD:
0.1
1.0 Mexico: 200 MW of a solar plant, to be
comissioned in 2021
Spain: 59 MW of wind and solar plants, to be
(announced in April and delivered in 2022/23
May 2020)
US: 100 MW of solar to be comissioned in 2022
RESULTS PRESENTATION 2583% of 7 GW target additions in renewables for 2019-22 already with LT contracts
63% of R$3.9 Bn transmission investments in Brazil already executed
~55% of the €6 Bn combined disposals + asset rotation target proceeds for 2019-2022
already executed or agreed/pending financial closing
Net debt/EBITDA at 3.4x in 1Q20 converging to 2020 target
€6.9 Bn financial liquidity by Mar-20 covering refinancing needs beyond 2022
Opex flat YoY in 1Q20 (like-for-like)
Accelerated digitalization (new ways of working, fast track on processes digitalisation)
2019 dividend €0.19/share (81% payout): payment date May 14th, ex-dividend May 12th
Green positioning: Renewables 79% in mix, CO2 emissions -81%, coal Iberia -77% YoY
RESULTS PRESENTATION 2627
~100% of office staff (ex-dispatch centers)    Supply of personal protection equipment

  5x increase in interactions through MS Teams   Reinforcement of cleaning and desinfection
                                                 Non-overlapping teams

RESULTS PRESENTATION                                                                          28
Non-Exhaustive
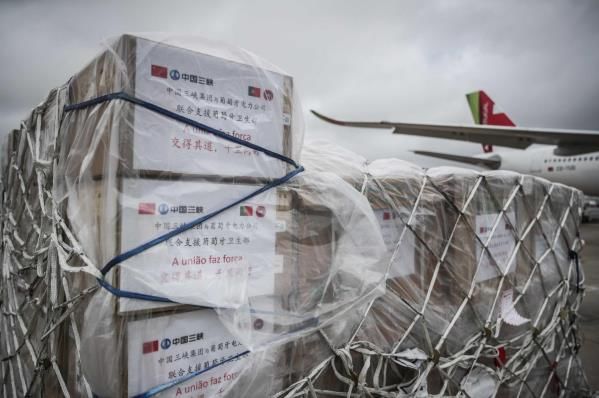
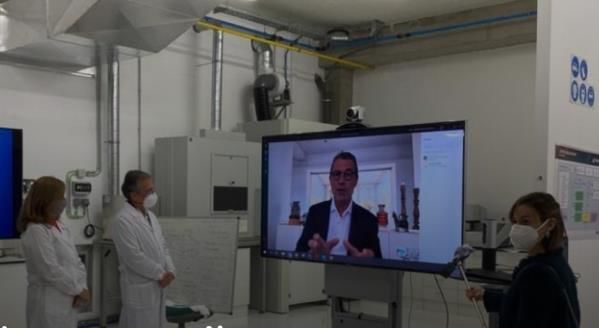
~€11 Mn1 support in most of our geographies, such as:
Medical equipment donated to Public Health System in PT & BR
EU program for development of vaccine and treatments
Funds to vulnerable communities in Brazil and the US
Electronic equipment to schools in Spain
Innovation
€100 Mn related to prompt payment of a set of invoices, each of up
to €500K, to SMEs in PT and ES until the end of May
€31 Mn, related to 1-month payment anticipation, to >1,200
suppliers in PT and ES
1) Includes CTG support of €2 Mn
RESULTS PRESENTATION 29Energy Transition
Support to (among others): Favorable context:
Clean, reliable and affordable energy Competitiveness of renewables and other low
carbon technologies
Just Transition
Broad EU support (political, businesses, civil
Circular economy society)
Biodiversity Leading to:
Job creation
EU Green Deal GREEN GDP growth
1 Trillion Euros Investment
Legislative reviews
RECOVERY Improved health and overall well being
Action Plans & Strategies
Sustainable Finance Prosperity
RESULTS PRESENTATION 30Aboño 1 will be
2005 20% 2005 628 gCO2 / kWh converted to gas
Aboño 1&2 (0.9 GW) (COD 2022); Aboño
Soto 3 (0.3 GW) 2 as a backup
1Q20 79% 1Q20 -81% No production since
Jun-19
2025 2025 Shutdown up to 2023,
Sines (1.2 GW) conditional on positive
margins
2030 2030
Coal production in Iberia 1Q20: -77% YoY
RESULTS PRESENTATION 31Global Global Global 1
Integrated Utilities Utilities (Score 4.7) Integrated Utilities Global Utilities
(Score 90) (Score 68)
1) Bloomberg; | 2) In 2018 Sustainalytcs has launched the ESG Risk Rating methodology and replaced the ESG Rating methodology. EDP overall Risk Rating in February 2020 was 24.95.
RESULTS PRESENTATION 32Selective screening process of investment projects... … achieving risk/return discipline
Threshold Achieved1
Expansion Capex opportunities analyzed
in 2019 at top decision-making level IRR/WACC
Attractive
returns
approved and successful …
NPV/CAPEX
… in projects located in geographies
Contracted
… totalling of renewables to be period
Sound contracted
deployed in 2020-24 profile and time
to cash
Contracted
NPV
1) Average of successful projects analyzed in Investment Committee in 2019
RESULTS PRESENTATION 33Transmission portfolio
EBITDA from transmission in Brazil
R$ Mn
96%
203 km
Partial COD 11
Jan-20 58%
7
123 km
COD Apr-21E
231
100%
58% 24 113 km
30
375 km COD Dec-18
COD Mar-21E 18 2018 2019 2022
64% 12%
485 km 142 km
21
COD Dec-20E Q COD Dec-21E
Under licensing
% of completion
RESULTS PRESENTATION 34... while other complementary options
Disposal of 25% of hydro portfolio in Iberia: €2.2 Bn for 1.7 GW in Portugal... may still be considered
Hydro disposal rationale
Transaction multiple:
(positive read across of remaining hydro assets)
Derisking: market price exposure and
concentration of hydro volatility
Expected financial closing in 2H20
All necessary regulatory requests were already
submitted
The carve out of the assets and the transitional
agreements are under preparation
RESULTS PRESENTATION 35Proceeds from asset rotation
€ Bn
Positive outlook supported by low interest rate context and strong appetite from
investors for infrastructure/renewables assets:
2020: Target deals in the US and Europe (~0.7 GW net)
2 deals agreed, with better than expected results:
>25%
Europe: 997 MW wind portfolio (491 MW net), EV €1.6 Mn/MW, €0.8 Bn proceeds
2019-22 Brazil: 137 MW (Babilónia), EV €2.2 Mn/MW (closed in Feb-20), €0.3 Bn proceeds
RESULTS PRESENTATION 36Projects already secured Projects already secured Projects already secured
MW MW MW
Project Name MW Region CoD Project Name MW Country CoD
Country MW Status CoD
Prairie Queen 199 Kansas 2019
Aventura II-V 111 Brazil 2022E
Timber Road IV 125 Ohio 2019
53 Installed 2019 Boqueirão I-II 80 Brazil 2022E
Bright Stalk 205 Illinois 2019 130 U/ const. & dev. 2020/22E Monte Verde VI 46 Brazil 2022E
Hidalgo II 50 Texas 2019
47 Installed 2019 Santa Rosa &
Nation Rise (CA) 100 Ontario 2020E Mundo Novo
279 U/ const. & dev. 2020/22E 158 Brazil 2022E
Broadlands I 200 Illinois 2020E
Alpha 212 Colombia 2022E
Headwaters II 198 Indiana 2020E 33 Installed 2019 Beta 280 Colombia 2022E
Rosewater1 102 Indiana 2020E 94 U/ const. & dev. 2020/21E
Crossing Trails 104 Colorado 2020E
50 Installed 2019 Pereira Barreto 199 Brazil 2021E
Reloj del Sol 209 Texas 2020E
124 U/development 2020/21E Lagoa 66 Brazil 2022E
WildCat 180 Texas 2020E
Mexico project 96 Mexico 2021E 58 U/construction 2020E
Indiana Crossroad1 300 Indiana 2021E 311 U/ development 2020/22E
Riverstart 200 Indiana 2021E
Sonrisa 200 California 2022E 119 U/ development 2020/22E
California Project 300 California 2022E
Golden Eye 139 East NA 2019
Los Cuervos 200 Mexico 2020E
1) Build and Transfer project
RESULTS PRESENTATION 37Wind & Solar installed capacity Remuneration framework for renewables in the US
2019 Start of ... End of
Minnesota Iowa Construction... Construction
Washington
Wisconsin
2016 2017 2018 2019 2020 2021 2022 2023 >2023
New York
Oregon
Ohio
California
Indiana
Illionois
Kansas
South Carolina
PPA/Hedge
Texas
Merchant Oklahoma
2016 2017 2018 2019 2020 2021 2022 2023 >2023
200 MW Existing 25-year PPA
30 MW 20-year FiT
Total North America
PTC2 (Wind onshore): % of full PTC ($24/MWh in 2018)
Installed Capacity1 Average age
ITC3 (Wind offshore): % of Capex
1 EBITDA + Equity capacity (Only EBITDA capacity represented in the map) | 2 PTC (Production Tax Credit) | 3 ITC (Investment Tax Credit)
ITC3 (Solar): % of Capex
RESULTS PRESENTATION 38EDP/Engie JV for offshore wind: Projects with PPA/FiT secured
Project CoD MW JV Stake (%) Status
Floating offshore 2020 25 79.4 Construction: 2 out of 3 turbines under operation
Seamade 2020E 487 17.5 Construction: Installation of 58 foundations completed
Moray East 2022E 950 56.6 Construction: Final stage of piling
Floating offshore 2021E 30 80.0 Development: Grid connection secured
Tréport & Nourmoutier 2024E 992 60.5 Development: Permit granted for both projects
Mayflower 2025E 804 50.0 Development: FEED2 design ongoing
Under Construction/Secured1
Under development (UK, US, Poland)
Total Projects
1 Considering 100% of projects capacity | 2 FEED: Front End Engineering & Design
RESULTS PRESENTATION 39Networks portfolio in Iberia Electricity distribution in Portugal
2019
Quality service1 High/Medium Voltage
Iberia 2017
Country-level concession
up to 2044
Electricity Distributed
TWh RAB €1.8 Bn
RoRAB2 5.1% (2019)
Supply points
Thousand
Low Voltage
Network 278 concessions, 92% of
Thousand km them expiring in 2021-22
RAB €1.2 Bn
Regulated Asset Base, RoRAB2 5.4% (2019)
€ Bn
1 Provisory data; TIEPI MV, % of the reference value defined in the Quality Service Regulation | 2 Nominal pre-tax, before CESE
RESULTS PRESENTATION 40EDP Shareholder Structure (May-2020) Corporate Governance Highlights
China Three Gorges (PRC)
Executive Board of Directors (EBD) and General and
21.5%
Supervisory Board (GSB)
All major corporate and strategic decisions scrutinized
by the GSB after proposal of the EBD
Free float 47.3% 7.2% Oppidum (Spain)
4.5%
BlackRock, Inc. (US)
2.9% 21 non-executive members, of which the majority are
2.5% 2.6% Alliance Bernstein (US)
0.6% 2.3% independent
State Street Corporation (US)
2.1% 2.4%
2.2% Paul Elliott Singer (US)
2.0%
Treasury Stock Sonatrach (Algeria)
The Capital Group (US) Qatar Investment Authority
BCP Group (Portugal) Norges Bank (Norway) 9 executive members
RESULTS PRESENTATION 41Amount
Bonds Currency Maturity Coupon Market Price (Bid) Market Yield ISIN Code
(million)
1
EDP BV Euro MTN EUR 233 29-06-2020 4.125% 100.5 0.350% XS0223447227
1
EDP BV Euro MTN EUR 462 14-09-2020 4.875% 101.5 0.402% XS0970695572
1
EDP BV Euro MTN EUR 553 20-01-2021 4.125% 102.5 0.542% XS0995380580
EDP BV Euro MTN EUR 1,000 18-01-2022 2.625% 103.4 0.59% XS1111324700
EDP BV Euro MTN EUR 600 23-03-2023 2.375% 105.1 0.58% XS1385395121
EDP BV Euro MTN EUR 600 29-09-2023 1.875% 104.0 0.69% XS1558083652
EDP BV Euro MTN EUR 1,000 12-02-2024 1.125% 101.5 0.72% XS1471646965
EDP BV Euro MTN EUR 750 22-04-2025 2.000% 105.5 0.87% XS1222590488
EDP BV Euro MTN EUR 600 13-10-2025 1.875% 105.2 0.90% XS1893621026
EDP BV Euro MTN EUR 750 26-01-2026 1.625% 103.7 0.96% XS1846632104
EDP BV Euro MTN EUR 600 16-09-2026 0.375% 96.2 1.00% XS2053052895
EDP BV Euro MTN EUR 750 15-04-2027 1.625% 103.1 1.16% PTEDPNOM0015
EDP BV Euro MTN EUR 500 22-11-2027 1.500% 102.6 1.13% XS1721051495
EDP Hybrid Notes EUR 1,000 30-04-2079 4.496% 102.4 4.0% PTEDPKOM0034
EDP Hybrid Notes EUR 750 20-07-2080 1.700% 89.1 1.9% PTEDPUOM0017
EDP BV Euro MTN GBP 325 04-01-2024 8.625% 121.9 2.3% XS0397015537
EDP BV Dollar USD 750 14-01-2021 5.250% 102.1 2.08% XS1014868779
EDP BV Dollar USD 1000 15-07-2024 3.625% 105.1 2.33% XS1638075488
Avg. Daily Volume
Equity Stock Exchange (€) P/E 2019E P/E 2020E P/BV 2019E DY 2019E Market Cap
52 Weeks (# tm)
EDP SA Euronext Lisbon €4.12 19.4 18.6 1.6 4.6 €15,080m 9.5
EDP Renováveis Euronext Lisbon €11.10 42.7 22.0 1.5 0.7 €9,683m 0.3
EDP Brasil BM&FBOVESPA R$16.08 9.8 9.8 1.2 4.2 R$9,758m 3.0
Source: Bloomberg as of May 8th, 2020.
1 Amounts shown are net of notes repurchased in Dec-18
RESULTS PRESENTATION 42IR Contacts
E-mail: ir@edp.com
Phone +351 210 012 834
Site: www.edp.com
Next Events
May 11th-18th: Virtual Roadshow Jun 2nd-3rd: RBC Virtual Conference Jul 30th: 1H20 Results
May 18th-19th: Goldman Sachs Virtual Conference Jun 3rd-4th: Credit Suisse Virtual Conference
Jun 4th: Kepler Virtual ESG Conference
RESULTS PRESENTATION 43You can also read