INVESTOR PRESENTATION - JULY 2020 - Chicken ...
←
→
Page content transcription
If your browser does not render page correctly, please read the page content below
INVESTOR PRESENTATION
                JULY 2020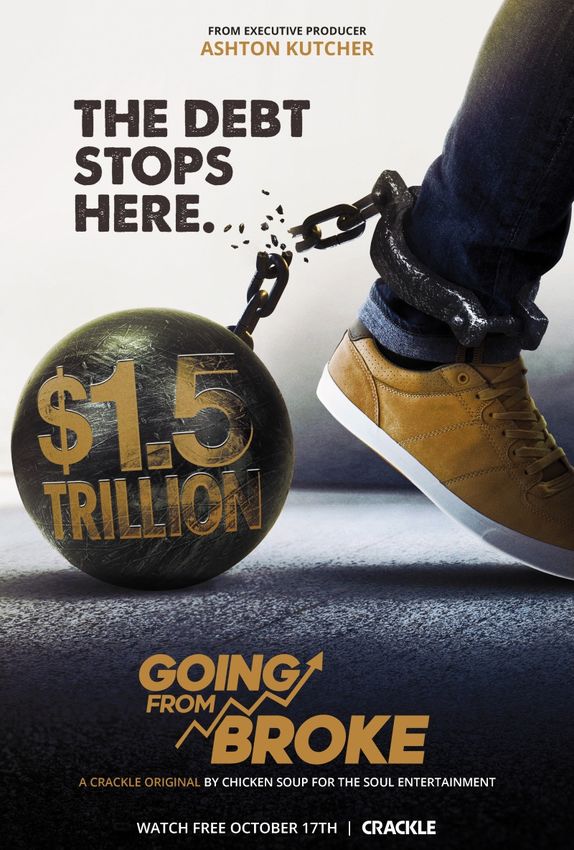
2

Free Writing Prospectus and Forward-looking Statements
Free Writing Prospectus                                                                   Quarterly Report on Form 10-Q as filed with the SEC on May 14, 2020, each of
                                                                                          which are incorporated by reference into the Form S-1.
Chicken Soup for the Soul Entertainment, Inc. (the “Company”, “CSSE,” “CSS
Entertainment,” “we” or “our Company”) filed a registration statement (including          This Presentation includes “forward-looking statements”. CSS Entertainment’s
a preliminary prospectus) with the Securities and Exchange Commission (the                actual results may differ from its expectations and estimates and, consequently,
“SEC”) for the offering to which this communication relates. The registration             you should not rely on these forward looking statements as predictions of future
statement has not yet become effective. Before you invest, you should read the            events. Words such as “expect,” “estimate,” “budget,” “forecast,” “anticipate,”
preliminary prospectus dated June 16, 2020 filed as part of that registration             “intend,” “plan,” “may,” “will,” “could,” “should,” “believe,” “predict,” “potential,”
statement and other documents we have filed with the SEC for more complete                “continue,” and similar expressions are intended to identify such forward-looking
information about us and this offering. You may obtain these documents for free           statements. These forward-looking statements include, without limitation, estimates
by visiting EDGAR on the SEC website at www.sec.gov. Alternatively, we or any             of future performance, which are based on numerous assumptions about sales,
underwriter participating in the offering will arrange to send you the prospectus if      margins, competitive factors, industry performance and other factors which
you request it by contacting Ladenburg Thalmann & Co. Inc., Attn: Prospectus              cannot be predicted. Such assumptions involve a number of known and unknown
Department, 277 Park Avenue, 26th Floor, New York, NY 10172, by calling (212) 409-        risks, uncertainties, and other factors, many of which are outside of the
2000 or by email at prospectus@Ladenburg.com.                                             Company’s control, including those factors set forth on Slide 3, among other
                                                                                          things. For a more complete description of these and other risks and uncertainties,
The following investor presentation (the “Presentation”) shall not constitute an          please refer to the Form S-1. Should one or more of these material risks occur or
offer to sell or the solicitation of an offer to buy, nor shall there be any sale of,     should the underlying assumptions change or prove incorrect, the actual results of
these securities in any state or jurisdiction in which such offer, solicitation or sale   operations are likely to vary from our expectations and the variations may be
would be unlawful prior to the registration or qualification under the securities laws    material and adverse. The forward-looking statements herein should not be
of such state or jurisdiction.                                                            regarded as a representation or prediction that CSS Entertainment will achieve or
                                                                                          is likely to achieve any particular results. CSS Entertainment cautions readers not to
Forward Looking Statements                                                                place undue reliance upon any forward-looking statements, which speak only as
                                                                                          of the date made. CSS Entertainment does not undertake or accept any
This Presentation contains various information regarding the Company’s business,          obligation or undertaking to release publicly any updates or revisions to any
including its operations through Crackle Plus, a company formed by CSSE and               forward-looking statements to reflect any change in its expectations or any
CPE Holdings, Inc. (an affiliate of Sony Pictures Television Inc.), and Landmark          change in events, conditions or circumstances on which any such statement is
Studio Group a majority owned subsidiary of CSSE. There are risks involved in the         based.
joint ventures and the Company’s business generally, including those discussed in
the Company’s Registration Statement on Form S-1, as amended (file No. 333-
239198), first filed with the SEC on June 16, 2020 (“Form S-1”), and the documents        All registered or unregistered service marks, trademarks and trade names referred
incorporated by reference therein.                                                        to in this Presentation are the property of their respective owners, and CSS
                                                                                          Entertainment’s use herein does not imply an affiliation with, or endorsement by,
Financial information for the year ended December 31, 2019 is derived from our            the owners of these service marks, trademarks or trade names.
Annual Report on Form 10-K as filed with the SEC on March 30, 2020, and financial
information for the three months ended March 31, 2020 is derived from our
3

Risk Factors
The following factors, among others, could cause actual results to differ materially       service to our customers could damage our reputation, which could have a
from those set forth in this presentation:                                                 material adverse effect on us.

•   The Notes will be unsecured and therefore are effectively subordinated to any        A more complete description of these risks and uncertainties can be found in the
    secured indebtedness we have incurred or may incur in the future.                    Form S-1 and the documents incorporated by reference therein. We undertake no
•   The Notes will be structurally subordinated to the indebtedness and other            obligation to update any of these forward-looking statements to reflect actual
    liabilities of our subsidiaries.                                                     results, new information or future events, changes in assumptions or changes in
•   The indenture under which the Notes are issued contains limited protection for       other factors affecting forward-looking statements, except to the extent required
    holders of the Notes.                                                                by applicable law. If we update one or more forward-looking statements, no
•   An increase in market interest rates could result in a decrease in the value of      inference should be drawn that we will make additional updates with respect to
    the Notes.                                                                           those or other forwarding-looking statements.
•   There is no existing trading market for the Notes, and, even if Nasdaq approves
    the listing of the Notes, an active trading market for the Notes may not
    develop, which could limit your ability to sell the Notes and/or the market price
    of the Notes.
•   We may choose to redeem the Notes when prevailing interest rates are
    relatively low.
•   If we default on our obligations to pay our other indebtedness, we may not be
    able to make payments on the Notes.
•   We will use a substantial portion of the proceeds of this offering to repay the
    outstanding indebtedness, and will have broad discretion with respect to the
    use of the remaining proceeds of this offering, which may include using of
    some or all of such remaining proceeds to pay certain obligations to Sony
    Pictures Television Inc. or its affiliates that may otherwise be payable in shares
    of our Series A Preferred Stock.
•   We are not obligated to contribute to a sinking fund to retire the Notes and the
    Notes are not guaranteed by a third-party.
•   We have and may continue to incur losses in the operation of our business.
•   Difficult conditions in the economy generally and our industry specifically
    resulting from the COVID-19 pandemic may cause interruptions in our
    operations, a slow down in the production or acquisition of new content, and
    changes in demand for our products and services.
•   Competition could have a material adverse effect on our business, financial
    condition and results of operations.
•   Interruptions in our ability to provide our video on demand products and our
COMPANY OVERVIEW
5

What is TV Today?
A Fragmented, Expensive, and Confusing Experience for the Consumer

            1                                                  2                               3                                 4
                                                      THE FALSE PROMISE              THE PROLIFERATION                   SUBSCRIPTION
     CORD “Converters”
                                                          OF vMVPDS                      OF SVODS                          FATIGUE

      TOTAL UNIVERSE                                    Once promising                                                SVOD subscribers’
 120M TV HOUSEHOLDS (U.S.)                        consumers skinny bundles                                           greatest frustrations:
                                                   at an affordable price,
                                                  this is no longer the case

                             ~45M
                              45M
                             cord “converters”
                               cord   cutters
                                                                                                                  87%
                                                                                                                              it’s all becoming
                                                                                                                              too expensive4

                                  in 20201

                                ~55M
                                 55M                                                                              67%         toggling between
                                                                                                                              services4
                                 in 20221

                                                 52% of cord cutters don’t miss                                               “not being able
                                                        anything about
                                                                                  Americans are willing to
                                                                                  subscribe
                                                                                   subscribe to
                                                                                              to 3.6  services3
                                                                                                 3.6 services
                                                                                                                  45%         to find content” 4
                                                        Cable/Satellite
                                                        Cable/Satellite2

                                                                                                                                  (1) eMarketer, July 2018
                                                                                                                                 (2) eMarketer, April 2019
                                                                                                                  (3) Wall Street Journal, November 2019
                                                                                                                                (4) Forbes, October 2019
6

The Free TV Solution
The Rise of Free TV
                                         81%
                               of A14-35 are willing to accept
                               more advertising in exchange
                                      for free content1

Cord-cutters are ready for
an alternative to SVODs.
                                         73%
                                of A18+ Streamers watch ad-
Streamers are realizing         supported OTT video to round
that “free" does not limit     out their entertainment bundle2
choice or sacrifice quality.

                                         45%
                               of streamers watch AVOD the
                                  most out of all streaming
                                           video3

                                                      (1) The Drum; (2) Vorhaus; (3) Roku
7

Chicken Soup for the Soul Entertainment Investment Highlights

                  Significant market opportunity in streaming VOD

                     CSSE operates leading AVOD networks

 AN EARLY              Self-sustaining, high growth business model
AVOD LEADER

                     Cost-effective content distribution and production engine

                  Solid balance sheet
8

Huge AVOD Market Opportunity

High cost of multiple subscriptions, combined with disruption of ad-supported network
model, will drive more consumers and advertisers to AVOD platforms

      Global AVOD Total Available Market
                                                      1

$60
                                                          Attractive Market Characteristics:
                                               $56

$50                                                       • Content will remain in high demand
$40
                                  GR                      • Consumers have abundant choices
                                CA
                            %
$30                       21

            $22                                           • Consumers will always value quality
$20                                                         content that is freely accessible
$10
                                                          • Online networks offer flexibility in
$0                                                          programming schedules and ad formats
            2018                               2024
                   Global AVOD Revenue ($BN)

                                                                           (1)   Multichannel News: Global AVOD Revenue to Reach $56 Billion by 2024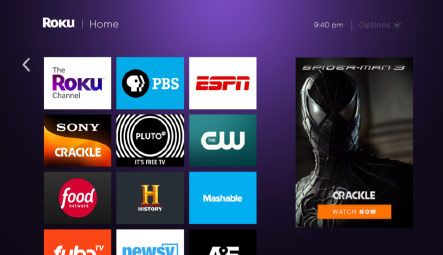
9

Advertisers Are Following the Eyeballs

        US Total Media and               US Total Media and Marketing                      US Total Media and Marketing
       Marketing Spend ($B)2              Spend on Digital Video ($B)2                        Spend on Linear TV ($B)2

                                                           GR
                                                       % CA                                             (0.5%) C
                                                                                                                AGR
                                                    +26
                 111.9        129.3
    92.9

                                                                      2.6
                                                         2.2                                70.2             69.9
    220.9        221.0        221.3                                                                                           69.2

                                           1.3

    2017         2018         2019         2017         2018         2019                   2017             2018             2019
    Traditional Media    Digital Media           Digital Video (OTT/Streaming)                             Linear TV

  US growth in ad spend on Digital Video (OTT/Streaming) is outpacing Linear TV1

                                                                            (1) CNBC: Global growth in ad spend on video-on-demand is outpacing traditional media
                                                                            (2) Winterberry Group, “Outlook for Dara Driven Marketing: First Look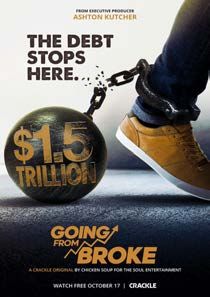
10

                              DISTRIBUTION
                                                        *

Chicken Soup for the Soul                       OTT
Entertainment’s best-in-                     NETWORKS
class content, distribution
and production
capabilities help set
Crackle Plus apart in the
AVOD ecosystem
— ultimately benefiting
the consumer.
                              PRODUCTION

                                                            (*) Third party international distributor
11
Self-Sustaining AVOD Network Model
ADD AVOD
NETWORKS
BUILD
EXPLOIT
VALUABLE
CONTENT
LIBRARY
ACQUIRE AND
RETAIN
VIEWERS
ENGAGE UNIFIED AD
PARTNERSHIPS PLATFORM12
Crackle Plus: Our Mission
Empower the streamer to cut-the-cord with premium programming, improved
user interface, and better advertising experience —
all at no cost to the consumer.
Entertaining,
Available Inspirational, Always
Everywhere FREE
& Inclusive13
Crackle Plus: Leading Family of AVOD Networks
Top Ad-Supported Channels2,3
1.
7 ad-supported video-on-demand
networks including Crackle &
Popcornflix
2.
Top-5 Network on the industry
leading Roku Platform 3.
4.
Available on all major streaming
platforms and smart TVs including
500,000 Marriott hotel room
screens through LG1 5.
(1) Internal company data
(2) Needham (Laura Martin) 12/3/19 : Raising Roku PT to $200. Buy on Dips
(3) Rankings based on Roku TV app platform14
Crackle Plus: Our Brands & Partners
We’re creating the most effective solution for advertisers
to reach audiences in the evolving OTT landscape —
at scale
Free Premium Free Indie/Classic AVOD & SVOD Linear Premium
Movies & TV Movies & TV Fandom/Anime Content15
Strong Competitive Position
Use of Ad-Based OTT Video Services (2018-2019)1
7%
6% 6%
6%
5%
4% 4%
4%
3% 3%
3%
2%
2%
2%
1%
1% 1%
1% 1% 1% 1% 1% 1% 1%
0%
o
TV
V
w
a
s
us
l
ll
le
st
TV
v
h
el
TV
ki
ne
Kid
ro
Nt
m
itc
m
Vi
VR
ca
nn
No
ck
Pl
bi
o
hy
an
ry
Xu
O
ra
Tw
ra
Tu
V
ha
Lo
ut
S
to
C
n
nc
cu
PB
T
Ch
C
Pl
io
ac
C
ng
ru
Do
at
c
ku
tF
C
su
m
pi
Ro
ou
m
Ni
lym
Sa
FU
Sh
e
O
Th
% of Survey Respondents Indicating Use of Specified OTT Service Over the Past 30 Days
(1) Parks Report: 360 Deep Dive - Ad-Supported OTT : Viewers and Use16
Crackle Plus AVOD Network Profiles
Crackle is a leading, free to Popcornflix was created for Frightpix has free feature- Popcornflix Comedy was
use video entertainment people who want to watch length horror films that will created for people who
network featuring full "Great Movies. Free." scare you out of your seat love to laugh. It's the
length movies, TV shows Popcornflix has full-length and leave you network for fans who want
and original programming. movies that will make you screaming! We have to watch “Great Comedy
laugh, make you cry, scare monster hits, cult classics Movies. Free.”
the heck out of you, or and critical darlings to
inspire you to hug the flame your wildest fears
person you love. and quench your thirst for
horror.17
1
We Reach TV’s Lost Generation
A Higher Concentration of Younger Viewers
MEDIAN AGE Crackle & Funimation
Broadcast
Ad-Supported Cable
48%
33 38%
vs. 14%
54
9% 9%
58 7%
A18-34 Comp A25-34 Comp
Broadcast Ad-Supported Cable
(1) Nielson Digital Ad Ratings18 Cost-Effective Distribution & Production Engine With Critical Mass of Content • Original production budgets are a major challenge across VOD industry • Our cost-effective, scalable distribution and production gives us a competitive edge • Innovative production partnerships provide access to proven creative talent • Crackle Plus benefits from valuable library with 79K hours of owned and licensed programming including popular Sony TV and film content
19

Distribution & Production

                             Cost-effective original and exclusive content engine

    Chicken Soup for the Soul              Screen Media is an           Landmark Studio Group is a          A Plus is a positive journalism
  Entertainment develops and           international distributor of    fully integrated entertainment       site founded and chaired by
    produces award-winning              television series and films,       company that develops,          Ashton Kutcher that covers the
    original programming and           licensing content through            finances, produces and        latest news with a hopeful twist.
 high-quality video content that     theatrical, home video, pay-      distributes scripted live action        It invites audiences to be
    brings out the best of the      per-view, free, cable and pay       and animated series, feature          informed about news and
  human spirit through positive    television, and subscription and      films, comedy specials and           entertainment — and feel
             storytelling.          advertising video-on-demand                      more.                            good about it.
                                                 platforms.

                                                                                                                      3.4 million
                                                                                                                     Social Media
                                                                                                                      Audience
20 Case Study: Going From Broke • #1 title on the Crackle Network • 230M+ minutes streamed as of 6/18/20 • 3.3M+ unique viewers as of 6/18/20 • 16M+ streams to date • De-risked and cost-effective production model • Production cost 100% paid for by sponsors in advance of production • Ad revenue is 5x+ marketing costs • Greenlit for a second season
21

           Crackle Originals & Exclusives: Programming Calendar*

                                                                             Cleanin’ Up the Town           The Sonata                     Robert the Bruce              A Reindeer’s Journey
Wonders of the Sea        Crown Vic              Today’s Homeowner
                                                                             Documentary Feature            Thriller Feature               Drama Feature                 Family Feature
Kids & Family Feature     Drama Feature          DIY Series
                                                                             (Original Movie)

April               May                   June           July                August                 September                    October                      November                    December

 Slumerican             Portals                  The Clearing        Grand Isle                Corporate Animals          Blood and Money Drama      Exit Plan                 Elliot the Littlest Reindeer
 Music Docuseries       Sci-Fi Feature           Zombie Feature      Thriller Feature          Comedy Feature             Feature                    Thriller Feature          Holiday Feature
 (Original)                                      (Original)

                                                                                                                                               * Current schedule as of 6/23/20, subject to change
22
Strategy to Drive Long-Term Free Cash Flow Growth
Content ADD AVOD
• Produce low-cost originals NETWORKS
• Acquire exclusive content
• Expand production partnerships
• Execute library acquisitions
BUILD
EXPLOIT
VALUABLE
CONTENT
Audience LIBRARY
• Acquire networks Building a Next-
• Develop thematic networks generation
• Grow and retain viewers Broadcast Network
Advertising
• Integrate ad platform
• Grow sales force ENGAGE UNIFIED AD
• Increase eCPMs across networks PARTNERSHIPS PLATFORM23
Crackle is Only Pure-Play AVOD Network with an Originals & Exclusives Strategy
A Curated Entertainment Network for Today’s Streamer
Robust Originals & Hand Picked Curation Always Increasing
WHAT DIFFERENTIATES US? Exclusives Slate Discoverability
The Only pure-play Free Streaming We Curate & Program We are Where
Platform that Offers Originals Like a Network Consumers Watch
23M Monthly Uniques1
Inspirational, Educational, We Have Scale, We’re Young
Our Programming Lens 32 Avg. Age2
Entertaining, Diverse, Inclusive & We’re Growing
32% YOY Growth in Time Spent3
(1) Comscore
(2) Nielson Digital Ad Ratings
(3) Internal Crackle Plus data24
Effective, Efficient Customer Acquisition and Retention
Content
CUSTOMER ACQUISITION Fresh, quality and
diverse content
Paid
Discovery and User Interface
marketing on OEM’s Intuitive and
easy-to-use UI
Social Ad Experience
Leverage social Great, non-disruptive
media presence user ad experience
Targeting
On-Air Leverage CRM and
In-network cross behavior targeting
promotion
CUSTOMER RETENTION25
Diverse and Targeted Ad Sales Strategy
We’re data driven, with results
DIRECT SALES LOCAL RESELLERS PROGRAMMATIC
Direct to brand across all of our OTT has been an enhancement for Offer advertisers access to
AVOD networks with data driven the local resellers, and we provide premium long form video in real
consumer targeting capabilities these operators with local geo time across our network
Multiple ad targeted ad supply
sales channels
drive supply
and demand
optionality
Percent of
ad sales1
51% 38% 11%
(1) Percent of ad sales from July 2019 – May 202026
Growth path in 2020 – New Distribution
Expanding the Crackle & Popcornflix experience on VOD and linear platforms
SIGNED New VOD and Linear Streaming Services
Crackle Original
Going From Broke
IN DISCUSSIONS with a Number of Additional Platforms27
Rapidly growing and fragmented VOD market
with consolidation opportunity
Leadership position in AVOD with Crackle Plus
Why We Are Comprehensive, integrated ad platform
Positioned to Win
Cost-effective distribution & production engine
Large and growing content library
Healthy balance sheetFINANCIAL SUMMARY
29

Operating Results
$ in millions

                                                                                                                       (1)
                        Revenue                                                         Adjusted EBITDA

                                                $79.3

                                       $55.3

                                                                                                                                    $10.5
                                                                                                        $10.0

                               $27.8
                                                                                                                       $6.0

                                                                             $3.8          $4.0
                       $10.9
                $8.1
    $1.5
                                                                $0.0
                                                          (2)                                                                                 (2)
    2015        2016   2017    2018    2019    2019 Pro         2015        2016          2017          2018          2019       2019 Pro
                                                Forma                                                                             Forma
                                                                   (1)   See slides 32 and 33 for details regarding Adjusted EBITDA and reconciliation to comparable
                                                                         GAAP measures
                                                                   (2) Assumes the acquisition of Crackle occurred on January 1, 2018. See Form S-1 and
                                                                       documents incorporated by reference
30
Q1 2020 Results
$ in millions
(1)
Revenue Adjusted EBITDA
$14.1
$2.5 $2.0
$-0.8
Q1 2019 Q1 2020 Q1 2019 Q1 2020
(1) See slides 32 and 33 for details regarding Adjusted EBITDA and reconciliation to
comparable GAAP measures31
Balance Sheet
$ in millions
(1)
Solid balance sheet as of 3/31/20
Total Assets
Total Equity
$158.2 Total Liabilities
(incl. Debt)
$79.8
$78.4
Debt
$19.2
(1) See Form 10-Q for the quarter ended March 31,202032
Non-GAAP Financial Measures
Our consolidated financial statements are prepared in accordance with generally accepted accounting principles in the United States (“U.S. GAAP”). We use a non-GAAP financial measure to
evaluate our results of operations and as a supplemental indicator of our operating performance. The non-GAAP financial measure that we use is Adjusted EBITDA. Adjusted EBITDA (as defined
below) is considered a non-GAAP financial measure as defined by Regulation G promulgated by the SEC under the Securities Act of 1933, as amended. Due to the significance of non-cash,
non-recurring, and acquisition related expenses recognized for the year ended December 31, 2019 and the quarter ended March 31, 2020, and the likelihood of material non-cash,
nonrecurring, and acquisition related expenses to occur in future periods, we believe that this non-GAAP financial measure enhances the understanding of our historical and current financial
results as well as provides investors with measures used by management for the planning and forecasting of future periods, as well as for measuring performance for compensation of executives
and other members of management. Further, we believe that Adjusted EBITDA enables our board of directors and management to analyze and evaluate financial and strategic planning
decisions that will directly affect operating decisions and investments. We believe this measure is an important indicator of our operational strength and performance of our business because it
provides a link between operational performance and operating income. It is also a primary measure used by management in evaluating companies as potential acquisition targets. We
believe the presentation of this measure is relevant and useful for investors because it allows investors to view performance in a manner similar to the method used by management. We believe
it helps improve investors’ ability to understand our operating performance and makes it easier to compare our results with other companies that have different capital structures or tax rates. In
addition, we believe this measure is also among the primary measures used externally by our investors, analysts and peers in our industry for purposes of valuation and comparing our operating
performance to other companies in our industry.
The presentation of Adjusted EBITDA should not be construed as an inference that our future results will be unaffected by unusual, infrequent or non-recurring items or by non-cash items. This
non-GAAP financial measure should be considered in addition to, rather than as a substitute for, our actual operating results included in our condensed consolidated financial statements.
We define Adjusted EBITDA as consolidated operating income (loss) adjusted to exclude interest, taxes, depreciation, amortization, acquisition-related costs, consulting fees related to
acquisitions, dividend payments, non-cash share-based compensation expense, and adjustments for other unusual and infrequent in nature identified charges. Adjusted EBITDA is not an
earnings measure recognized by US GAAP and does not have a standardized meaning prescribed by GAAP; accordingly, Adjusted EBITDA may not be comparable to similar measures
presented by other companies. We believe Adjusted EBITDA to be a meaningful indicator of our performance that provides useful information to investors regarding our financial condition and
results of operations. The most comparable GAAP measure is operating income.
Adjusted EBITDA has important limitations as an analytical tool, and you should not consider it in isolation or as a substitute for analysis of our results as reported under GAAP. Some of these
limitations are:
• Adjusted EBITDA does not reflect our cash expenditures or future requirements for capital expenditures or contractual commitments;
• Adjusted EBITDA does not reflect changes in, or cash requirements for, our working capital needs;
• Adjusted EBITDA does not reflect the effects of preferred dividend payments, or the cash requirements necessary to fund;
• Although amortization and depreciation are non-cash charges, the assets being depreciated will often have to be replaced in the future, and Adjusted EBITDA does not reflect any future
cash requirements for such replacements;
• Adjusted EBITDA does not reflect the impact of stock-based compensation upon our results of operations;
• Adjusted EBITDA does not reflect the significant interest expense, or the cash requirements necessary to service interest or principal payments on our debt;
• Adjusted EBITDA does not reflect our income tax (benefit) expense or the cash requirements to pay our income taxes;
• Adjusted EBITDA does not reflect the impact of acquisition related expenses; and the cash requirements necessary;
• Adjusted EBITDA does not reflect the impact of other non-recurring, infrequent in nature and unusual expenses; and
• Other companies in our industry may calculate Adjusted EBITDA differently than we do, limiting its usefulness as a comparative measure.33
Non-GAAP Financial Measures Continued
Quarter Ended Year Ended Pro Forma Year Ended
March 31, December 31, December 31,
2020 2019 2019 2019
General:
Net loss available to common stockholders, as reported $ (11,427,380) $ (3,376,737) $ (34,976,816) $ (32,006,924)
Preferred dividends 974,272 603,307 3,304,947 3,304,947
Provision for income taxes & other taxes 102,411 (156,790) 1,045,205 1,045,205
Interest expense, net of interest income (1) 322,687 127,598 770,826 770,826
Share-based compensation expense (3) 244,835 215,847 1,061,926 1,061,926
All other nonrecurring costs 186,948 24,155 276,400 276,400
Film Library:
Film library and program rights amortization, included in cost of revenue
2,494,832 871,126 10,683,227 10,683,227
(non-cash) (2)
Reserve for bad debt & video returns 1,721,595 300,403 2,669,699 1,241,245
Crackle Plus-Related:
Acquisition-related costs and other one-time consulting fees (4) 98,926 397,935 3,968,227 3,968,289
Amortization 5,204,728 205,623 13,293,279 14,866,387
Transitional Expenses (5) 2,113,469 — 3,505,855 3,505,855
Adjusted EBITDA $ 2,037,323 $ (787,533) $ 5,953,528 $ 10,496,528
(1) Includes non-cash amortization of deferred financing costs of $10,152 and $25,823 for the three months ended March 31, 2020 and 2019, respectively.
(2) Represents amortization of our film library, which include cash and non-cash amortization of our initial film library investments, participation costs and theatrical release costs as well as amortization for
our acquired program rights.
(3) Represents expense related to common stock equivalents issued to certain employees and officers under the Long-Term Incentive Plan, as well as common stock grants issued to employees and non-
employee directors.
(4) Represents aggregate transaction-related costs, including legal fees, accounting fees, investment advisory fees and various consulting fees.
(5) Represents transitional related expenses primarily associated with the Crackle Plus business combination and our Company strategic shift related to our production business. Costs include primarily
non-recurring payroll and related expenses and redundant non-recurring technology costs.THANK YOU
You can also read