The "big picture" and current developments on agricultural markets - Ag Machinery International, AgriTechnica Hannover, November 13, 2019
←
→
Page content transcription
If your browser does not render page correctly, please read the page content below

The „big picture“ and current developments on
agricultural markets

Ag Machinery International, AgriTechnica Hannover, November 13, 2019

Dr. Michaela Kuhl I Commerzbank Research I November 2019

Quelle: FAO, 2011, Looking ahead in world food and agriculture: Perspectives to 2050, Commerzbank Research

Commerzbank Research I November 2019                                                                                                            1
Real agricultural prices tend to follow a declining trend over the long run

   However, there are periods of high volatility and commodity-specific short-term rebounds (due e.g. to
   harvest failures or demand shocks).

                              Long-term evolution of commodity prices, in real terms

                                                                 Source: FAO/OECD, Agricultural Outlook 2019-2028, Commerzbank Research

Commerzbank Research I November 2019                                                                                                      2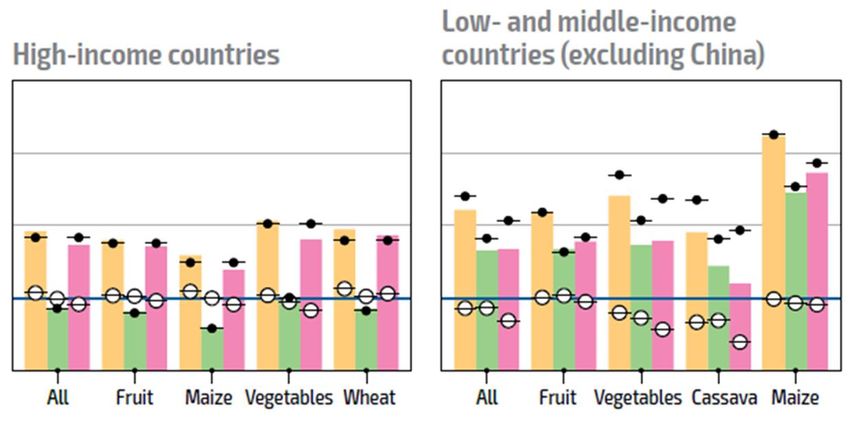
Demand side: Important drivers…

  •Per-capita income

  •Population growth

  •Change in diets

  •Biofuels (probably less so in the future)

   … but the global economy is not supportive at the moment

   •Downward corrections in world economic growth (e.g. by IMF in October 2019)
   •Momentum in manufacturing activity, in particular, has weakened
   •Rising trade and geopolitical tensions have increased uncertainty
   •Global growth is forecast at 3.0 percent for 2019, its lowest level since 2008–09.

                                          Source: FAO/OECD, Agricultural Outlook 2019-2028 , IMF WEO October 2019, Commerzbank Research

Commerzbank Research I November 2019                                                                                                      3
Supply side: Growth in area, growth in yield…

   Most of growth in area will probably take place by cropping intensification (double
   cropping, e.g. soybeans in Latin America and oilseeds in Oceania)

                                       Growth in crop production 2016/18 to 2028

                                                                      Source: FAO/OECD, Agricultural Outlook 2019-2028, Commerzbank Research

Commerzbank Research I November 2019                                                                                                           4
Supply side: Production is highly divers with respect to regional distribution...

   Distribution of production of key food commodity groups by farm size

                             Source: Herrero et al.,Farming and the geography of nutrient production for human use: a transdisciplinary analysis , 2017, Commerzbank Research

Commerzbank Research I November 2019                                                                                                                                            5
Supply side: …. and farm size…

   Production of key food groups by farm size

                             Source: Herrero et al.,Farming and the geography of nutrient production for human use: a transdisciplinary analysis , 2017, Commerzbank Research

Commerzbank Research I November 2019                                                                                                                                            6
… will (hopefully) lead to growth in output large enough to cover demand

         World cereal stocks and stocks-to-use ratios, FAO/OECD projections to 2028

   Decrease in global corn stocks and SUR entirely due to China, stagnant in rest of world
                                                              Source: FAO/OECD, Agricultural Outlook 2019-2028, Commerzbank Research

Commerzbank Research I November 2019                                                                                                   7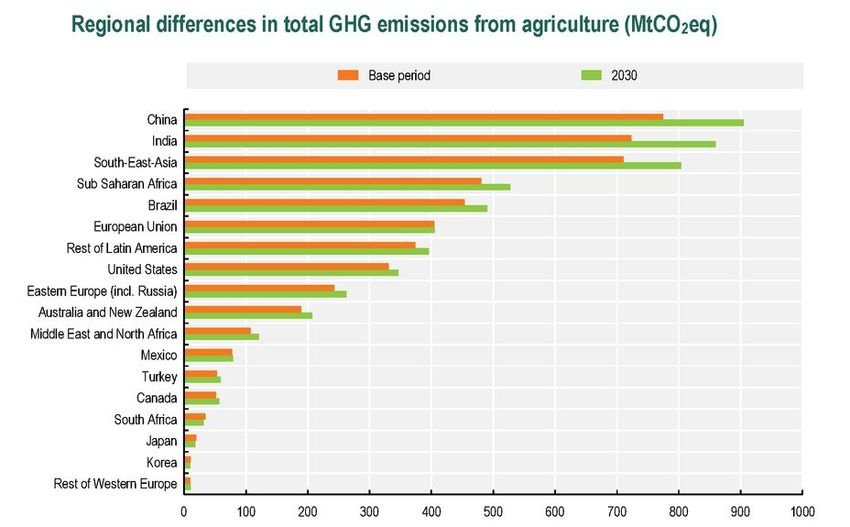
Climate extremes influence agricultural commodity markets
 •      Projections typically assume average agroclimatic conditions.
 •      However: Extreme climate events will likely occur more frequently and last longer in many areas.
 •      In some key wheat exporters (Australia, Kazakhstan, Russia, Canada, and some EU countries),
        yields show particularly high sensitivity to heat and water stress.

Coefficients (dots within bars) show the average relative response of regional yields to a marginal increase in the corresponding Combined Stress Index (CSI). Bar shades represent 50%,
90%, and 95% confidence intervals around the point estimates. Red lines show the multi-country mean response from two pooled models. CSI Combined Stress Index: is a composite index
that attributes yield anomalies (deviations from a baseline Trend) to climatic stress throughout the period 1980–2010. The CSI is based two other indices , a temperature-anomaly index (heat
stress) and a soil-moisture index that quantifies persistent water stress on average national yields. CSI coefficients have the expected negative sign: positive (negative) CSI values are
associated with a decrease (increase) in average national yields, ceteris paribus.
                                                                           Source: Thomas Chatzopoulos, et al., Weather and Climate Extremes , EC JRC 2019, Commerzbank Research

Commerzbank Research I November 2019                                                                                                                                                        8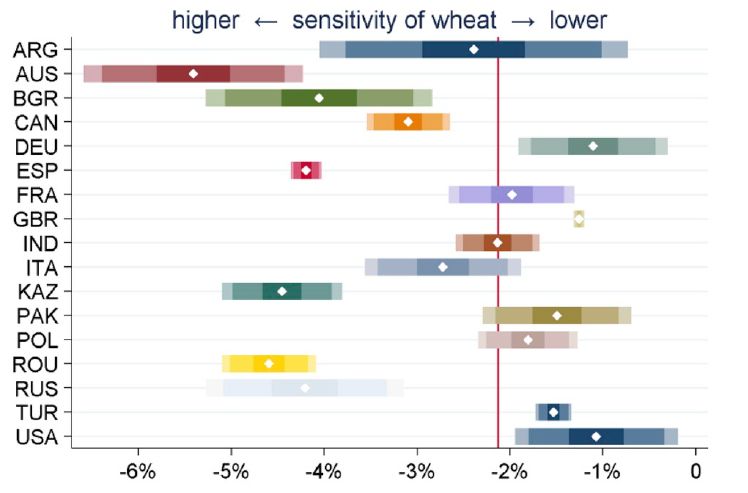
This leads to significant differences in crop prices compared to an “average”
situation
• The response of global wheat stocks-to-use ratios and prices stands out in the case of Russia
(reasons: relatively high average sensitivity to weather extremes and large export volumes)
• Extreme weather events in Australia, Canada and other countries also have global impacts.
Bubbles show how regional extreme events may affect global markets (e.g., extremely unfavorable conditions for wheat production in Russia
would lead the world price to rise by about 10% and the global stock-to-use ratio to drop to about 0.320).
Source: Thomas Chatzopoulos, et al., Weather and Climate Extremes , EC JRC 2019, Commerzbank Research
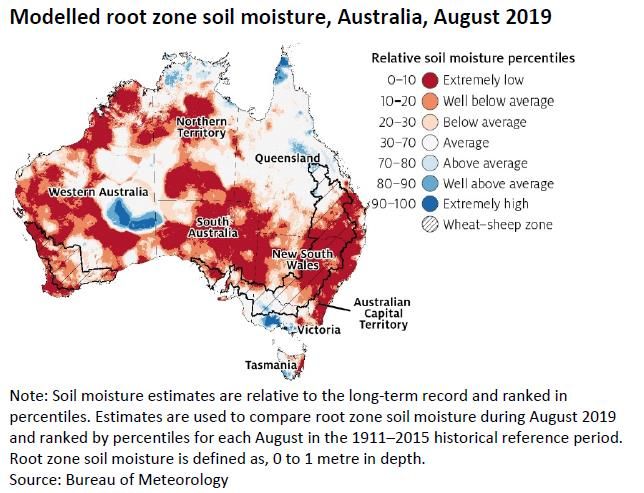
Commerzbank Research I November 2019 9Let‘s take Australia as an example…
• Huge drop in wheat production over the last years due to drought.
• Share in global wheat exports dropped from 12% in 2016/17 to 5% now.
• One main policy objective: increase the agricultural sector’s resilience to drought.
Wheat production in million tons
90 900
80 800
70 700
60 600
50 500
40 400
30 300
20 200
10 100
0 0
2000 2002 2004 2006 2008 2010 2012 2014 2016 2018
Australia, left Russia, left World, right
Source: Abares, Commerzbank Research
Commerzbank Research I November 2019 10Expectations also drive prices ….
300 50
250 40
200
30
150
20
100
50 10
0 0
1970 1980 1990 2000 2010
40 1000
wheat ending stocks in million tons, left
38 900
stocks-to-use ratio in %, right
36
800
34
700
32
600
30
500
28
26 400
24 300
2010 2011 2012 2013 2014 2015 2016 2017 2018 2019
Stocks-to-use (at the end of crop year), %, ls
average price wheat, Usd/ bushel, rs
Source: USDA, Bloomberg, Commerzbank Research
Commerzbank Research I November 2019 11… as do exchange rates ...
US Dollar has significant influence on commodity prices
90 850
95
750
100
650
105
110 550
115 450
120
350
125
250
130
135 150
2000 2002 2004 2006 2008 2010 2012 2014 2016 2018
US dollar index (trade weighted, inverted), left S&P GSCI commodity index, right
Source: Barron’s, S&P, Bloomberg, Commerzbank Research
Commerzbank Research I November 2019 12… and the positioning of short-term oriented market participants
80 '000 contracts 600
40
0 550
-40
500
-80
-120 450
-160
-200 400
Jan-17 Jul-17 Jan-18 Jul-18 Jan-19 Jul-19
net long posit., lS Wheat, USd per bushel, rS
Source: CFTC, Commerzbank Research
Commerzbank Research I November 2019 13Production growth went hand in hand with even stronger trade growth
Developments in agricultural markets and policies since 2001 (percent change)
Source: OECD, Agricultural trade and domestic policy reform: better together, Jan 2019, Commerzbank Research
Commerzbank Research I November 2019 14However, global trade growth has halted and the world is divided into
regional trade blocs
• The 2008/09 financial crisis marked the beginning of a phase of de-globalisation.
• Reasons: Protectionism is en vogue, regional trade on the rise, producers shorten
value chains in reaction to higher uncertainty in international relations
World trade in goods and services, in % of global GDP Number of regional trade agreements
65 350
60 300
55
250
50
45 200
40 150
35
100
30
25 50
20 0
1960 1970 1980 1990 2000 2010 1950 1955 1960 1965 1970 1975 1980 1985 1990 1995 2000 2005 2010 2015
Source: World Bank, Global Trade Alert, WTO, Commerzbank Research
Commerzbank Research I November 2019 15Trade coverage of import-restrictive measures implemented near record high
Source: WTO, WTS July 2019, Commerzbank Research
Commerzbank Research I November 2019 16US – China trade dispute the main topic: Soybeans of major importance
Top U.S. agricultural export destinations,
2016, in billion USD
25
20
15
10
5
0
Japan
Taiwan
South Korea
Hong Kong
China
EU-28
Vietnam
Mexico
Indonesia
Canada
Source: USDA, PantherMedia ,Commerzbank Research
Commerzbank Research I November 2019 17US – China trade dispute: Soybeans of major importance (2)
3600 beginning of trade conflict 1100
1050
3400
1000
3200 950
3000 900
850
2800
800
2600 750
2017 2018 2019
LME industrial metals index, left Soybean price CBOT in USd per bushel, right
Source: USDA, PantherMedia ,Commerzbank Research
Commerzbank Research I November 2019 18US – China trade dispute: Soybeans of major importance (3)
Chinese soybean imports, monthly data, in million tons
10
8
6
4
2
0
Jan-15 Jan-16 Jan-17 Jan-18 Jan-19
USA Brazil
China increasing purchases as a gesture of good will. Uncertainty surrounding the October
"Phase-one trade deal": (How) will Chinese ags imports from US reach a magnitude of up to
50 billion USD (twice the pre-trade war amount)?
Source: USDA, Commerzbank Research
Commerzbank Research I November 2019 19FAO: „Climate change is increasingly affecting yields…”
Yield changes 2012/2050 due to climate change and technical progress (rainfed systems)
Source: FAO, 2018:The Future of food and agriculture. Alternative pathways to 2050, p. 81, Commerzbank Research
Commerzbank Research I November 2019 20FAO: „…while agriculture continues to emit greenhouse gases (GHGs)”
OECD: agriculture contributed approximately 12% of anthropogenic greenhouse gas emissions
over the period 2007 to 2016 and was responsible for an additional 9% of global GHG emissions
each year from changes in land use.
Agricultural GHG emissions (2020, in MtCO2eq)
N2O = Nitrous oxide (laughing gas)
N2O fertilizer,
CH4 rice, 588 CO2 = Carbon dioxide
807
CH4 = Methane
CH4 other, 960
Land Use
Change, 5912
N2O livestock,
1424
CH4 livestock,
2849
CO2 fuel, 288
N2O other, 347
Source: OECD, Enhancing climate change mitigation trough agriculture, Oct 2019, Commerzbank Research
Commerzbank Research I November 2019 21Climate change, future agriculture development paths (2)
2015-17
Source: OECD, Enhancing climate change mitigation trough agricullture, 2019, Commerzbank Research
Commerzbank Research I November 2019 22Enhancing climate change mitigation trough agriculture
OECD analysed several scenarios on a global level. While comparability across
scenarios is limited, they conclude, that…
•Benefits are highest from the scenario „Influencing consumer preferences“ (a
preference shift towards less ruminant products), but difficult to achieve.
•Consumption taxes are the least effective, especially when decoupled from the
actual carbon produced.
•Supply side carbon tax has a high potential to reduce emissions from
agriculture. However, global approach is needed to avoid carbon leakage.
•Increasing productivity could potentially reduce emissions, increase food
availability and improved access via lower prices.
Source: OECD, Enhancing climate change mitigation trough agriculture, Oct 2019, Commerzbank Commodity Research
Commerzbank Research I November 2019 23Summary: The challenge is …
• … to increase agricultural production to cover demand while at the same time
• …make production systems more resource-saving and climate-friendly.
… and agricultural machinery will play a vital role in this process
• FAO 2019: “The digital revolution has thrust the agricultural machinery
industry into a central position in the inputs sector…Intelligent machinery,
drones, sensores and smart apps …will shift the focus … to services whose
value lies in increasing the efficiency rather than the volume of inputs.“
Thank you for your attention
Source: FAO, 2019: Large-scale forces, global tendencies and rural actors in the light of the SDG goals, Commerzbank Research
Commerzbank Research I November 2019 24Disclaimer In accordance with ESMA MAR requirements this report was completed and disseminated on Nov 8 , 2019. This document has been created and published by the Research department within the Corporate Clients division of Commerzbank AG, Frankfurt/Main or Commerzbank’s branch offices mentioned in the document. Commerzbank AG is a provisionally registered swap dealer with the CFTC. If this report includes an analysis of one or more equity securities, please note that the author(s) certify that (a) the views expressed in this report accurately reflect their personal views; and (b) no part of their compensation was, is, or will be directly or indirectly related to the specific recommendation(s) or views expressed by them contained in this document. The research analyst(s) named on this report are not registered / qualified as research analysts with FINRA. Such research analyst(s) may not be associated persons of Commerz Markets LLC and therefore may not be subject to FINRA Rule 2241 restrictions on communications with a subject company, public appearances and trading securities held by a research analyst account. It has not been determined in advance whether and in what intervals this document will be updated. Unless otherwise stated current prices refer to the most recent trading day’s closing price or spread which may fluctuate. Disclaimer This document is for information purposes only and does not take into account specific circumstances of any recipient. The information contained herein does not constitute the provision of investment advice. It is not intended to be and should not be construed as a recommendation, offer or solicitation to acquire, or dispose of, any of the financial instruments and/or securities mentioned in this document and will not form the basis or a part of any contract or commitment whatsoever. Investors should seek independent professional advice and draw their own conclusions regarding suitability of any transaction including the economic benefits, risks, legal, regulatory, credit, accounting and tax implications. The information in this document is based on public data obtained from sources believed by Commerzbank to be reliable and in good faith, but no representations, guarantees or warranties are made by Commerzbank with regard to accuracy, completeness or suitability of the data. Commerzbank has not performed any independent review or due diligence of publicly available information regarding an unaffiliated reference asset or index. The opinions and estimates contained herein reflect the current judgement of the author(s) on the date of this document and are subject to change without notice. The opinions do not necessarily correspond to the opinions of Commerzbank. Commerzbank does not have an obligation to update, modify or amend this document or to otherwise notify a reader thereof in the event that any matter stated herein, or any opinion, projection, forecast or estimate set forth herein, changes or subsequently becomes inaccurate. This communication may contain trading ideas where Commerzbank may trade in such financial instruments with customers or other counterparties. Any prices provided herein (other than those that are identified as being historical) are indicative only, and do not represent firm quotes as to either size or price. The past performance of financial instruments is not indicative of future results. No assurance can be given that any financial instrument or issuer described herein would yield favourable investment results. Any forecasts or price targets shown for companies and/or securities discussed in this document may not be achieved due to multiple risk factors including without limitation market volatility, sector volatility, corporate actions, the unavailability of complete and accurate information and/or the subsequent transpiration that underlying assumptions made by Commerzbank or by other sources relied upon in the document were inapposite. Commerzbank and or its affiliates may act as a market maker in the instrument(s) and or its derivative that has been mentioned in our research reports. Employees of Commerzbank and or its affiliates may provide written or oral commentary, including trading strategies, to our clients and business units that may be contrary to the opinions conveyed in this research report. Commerzbank may perform or seek to perform investment banking services for issuers mentioned in research reports. Neither Commerzbank nor any of its respective directors, officers or employees accepts any responsibility or liability whatsoever for any expense, loss or damages arising out of or in any way connected with the use of all or any part of this document. Commerzbank may provide hyperlinks to websites of entities mentioned in this document, however the inclusion of a link does not imply that Commerzbank endorses, recommends or approves any material on the linked page or accessible from it. Commerzbank does not accept responsibility whatsoever for any such material, nor for any consequences of its use. This document is for the use of the addressees only and may not be reproduced, redistributed or passed on to any other person or published, in whole or in part, for any purpose, without the prior, written consent of Commerzbank. The manner of distributing this document may be restricted by law or regulation in certain countries, including the United States. Persons into whose possession this document may come are required to inform themselves about and to observe such restrictions. By accepting this document, a recipient hereof agrees to be bound by the foregoing limitations. Additional notes to readers in the following countries: Germany: Commerzbank AG is registered in the Commercial Register at Amtsgericht Frankfurt under the number HRB 32000. Commerzbank AG is supervised by both the German regulator, Bundesanstalt für Finanzdienstleistungsaufsicht (BaFin), Graurheindorfer Strasse 108, 53117 Bonn, Marie-Curie-Strasse 24-28, 60439 Frankfurt am Main and the European Central Bank, Sonnemannstrasse 20, 60314 Frankfurt am Main, Germany. United Kingdom: This document has been issued or approved for issue in the United Kingdom by Commerzbank AG London Branch. Commerzbank AG, London Branch is authorised by Bundesanstalt für Finanzdienstleistungsaufsicht (BaFin), and the European Central Bank and is subject to limited regulation by the Financial Conduct Authority and Prudential Regulation Authority. Details on the extent of our regulation by the Financial Conduct Authority and Prudential Regulation Authority are available from us on request. This document is directed exclusively to eligible counterparties and professional clients. It is not directed to retail clients. No persons other than an eligible counterparty or a professional client should read or rely on any information in this document. Commerzbank AG, London Branch does not deal for or advise or otherwise offer any investment services to retail clients. Commerzbank Research I November 2019 25
Disclaimer (contd.)

United States: This document has been approved for distribution in the US under applicable US law by Commerz Markets LLC (‘Commerz Markets’), a wholly owned subsidiary of Commerzbank AG and a US registered
broker-dealer. Any securities transaction by US persons must be effected with Commerz Markets, and transaction in swaps with Commerzbank AG. Under applicable US law; information regarding clients of Commerz
Markets may be distributed to other companies within the Commerzbank group. This research report is intended for distribution in the United States solely to “institutional investors” and “major U.S. institutional investors,” as
defined in Rule 15a-6 under the Securities Exchange Act of 1934. Commerz Markets is a member of FINRA and SIPC. Any derivatives transaction with US persons must be effected in accordance with the provisions of the
Dodd-Frank Wall Street Reform and Consumer Protection Act.
Canada: The information contained herein is not, and under no circumstances is to be construed as, a prospectus, an advertisement, a public offering, an offer to sell securities described herein, solicitation of an offer to buy
securities described herein, in Canada or any province or territory thereof. Any offer or sale of the securities described herein in Canada will be made only under an exemption from the requirements to file a prospectus with
the relevant Canadian securities regulators and only by a dealer properly registered under applicable securities laws or, alternatively, pursuant to an exemption from the dealer registration requirement in the relevant province
or territory of Canada in which such offer or sale is made. Under no circumstances is the information contained herein to be construed as investment advice in any province or territory of Canada and is not tailored to the
needs of the recipient. In Canada, the information contained herein is intended solely for distribution to Permitted Clients (as such term is defined in National Instrument 31-103) with whom Commerz Markets LLC deals
pursuant to the international dealer exemption. To the extent that the information contained herein references securities of an issuer incorporated, formed or created under the laws of Canada or a province or territory of
Canada, any trades in such securities may not be conducted through Commerz Markets LLC. No securities commission or similar regulatory authority in Canada has reviewed or in any way passed upon these materials, the
information contained herein or the merits of the securities described herein and any representation to the contrary is an offence.
European Economic Area: Where this document has been produced by a legal entity outside of the EEA, the document has been re-issued by Commerzbank AG, London Branch for distribution into the EEA.
Singapore: This document is furnished in Singapore by Commerzbank AG, Singapore branch. It may only be received in Singapore by an institutional investor or an accredited investor as respectively defined in section 4A of
the Securities and Futures Act, Chapter 289 of Singapore (“SFA”) pursuant to section 274 or section 275 (as applicable) of the SFA. Nothing in this document constitutes accounting, legal, regulatory, tax, financial or other
advice and/or recommendations to the recipient of this communication. Further, the communication/information provided herein does not constitute a “financial advisory service” within the meaning of the Financial Advisers
Act, Chapter 110 of Singapore (“FAA”) and therefore, the regulatory requirements and duties that may be owed to a client pursuant to or in connection with the FAA are not applicable to the recipient in connection with this
communication. Recipients are advised to seek independent advice from their own professional advisers about the information discussed herein.
Hong Kong: This document is furnished in Hong Kong by Commerzbank AG, Hong Kong Branch, and may only be received in Hong Kong by ‘professional investors’ within the meaning of the Securities and Futures
Ordinance (Cap.571) of Hong Kong and any rules made there under, and persons whose ordinary business is to buy or sell shares or debentures.
Japan: This information and its distribution do not constitute and should not be construed as a "solicitation" under the Financial Instrument Exchange Act (FIEA). This information may be distributed from Commerzbank
international branches outside Japan solely to "professional investors" as defined in Section 2(31) of the FIEA and Section 23 of the Cabinet Ordinance Regarding Definition of Section 2 of the FIEA. Please note that
Commerzbank AG, Tokyo Branch has not participated in its preparation. Not all financial or other instruments referred to in this information are available within Japan. You should contact the Corporate Clients division of
Commerzbank AG for inquiries on availability of such instruments.
Australia: Commerzbank AG does not hold an Australian financial services licence. This document is being distributed in Australia to wholesale customers pursuant to an Australian financial services licence exemption for
Commerzbank AG under Class Order 04/1313. Commerzbank AG is regulated by Bundesanstalt für Finanzdienstleistungsaufsicht (BaFin) under the laws of Germany which differ from Australian laws.
People’s Republic of China (PRC): This document is furnished by Commerzbank AG and is only intended for institutions that are eligible for financial transactions. No-one else may rely on any information contained within
this document. Any derivative transactions by PRC persons may only be entered into by PRC financial institutions which are permitted to conduct derivatives business in the PRC and have obtained all necessary regulatory
approvals in the PRC.
© Commerzbank AG 2019. All rights reserved. Version 9.27

Commerzbank Corporate Clients
Frankfurt                             London                      New York                            Singapore                        Hong Kong
Commerzbank AG                        Commerzbank AG              Commerz Markets LLC                 Commerzbank AG                   Commerzbank AG
DLZ - Gebäude 2, Händlerhaus          PO BOX 52715                225 Liberty Street, 32nd floor,     71, Robinson Road, #12-01        15th Floor, Lee Garden One
Mainzer Landstraße 153                30 Gresham Street           New York,                           Singapore 068895                 33 Hysan Avenue,
60327 Frankfurt                       London, EC2P 2XY            NY 10281-1050                                                        Causeway Bay
                                                                                                                                       Hong Kong
Tel: + 49 69 136 21200                Tel: + 44 207 623 8000      Tel: + 1 212 703 4000               Tel: +65 631 10000               Tel: +852 3988 0988

 Commerzbank Research I November 2019                                                                                                                                                                                         26
Appendix Commerzbank Research I November 2019 27
Wheat prices in Chicago and Paris largely in sync

           600                                                                                     220
                                                                                                   210
           550
                                                                                                   200

           500                                                                                     190
                                                                                                   180
           450                                                                                     170
                                                                                                   160
           400
                                                                                                   150
           350                                                                                     140
              2016                     2017       2018               2019

                              CBOT, Usd/ton, LS          Euronext Paris, EUR/ton, RS

                                                                            Source: Bloomberg, Commerzbank Research

Commerzbank Research I November 2019                                                                              28
Plenty of wheat on the global market
Global wheat stocks record high Russia winning export share at the expense of USA and EU
End-of-season stocks in million tons Share in global wheat exports
300 Stocks-to-use ratio in %,
Lager-Verbrauchs-Verhältnis 45 35%
in Prozent, rechts
right
40 30%
250
35 25%
200 30 20%
25 15%
150
20 10%
100 15 5%
10
50 0%
5 2000 2002 2004 2006 2008 2010 2012 2014 2016 2018
0 0 EU USA Russia Australia
1981 1986 1991 1996 2001 2006 2011 2016
Source: USDA, Bloomberg, Commerzbank Research
Commerzbank Research I November 2019 29Global corn market getting tighter, US crop revised downward
Global corn stocks have been shrinking for 3 years US corn crop smaller than last year and smaller than expected
End-of-season stocks in million tons USDA forecasts for 2019/20, in billion bushels and bushels per acres
15.5 178
400 Stocks-to-use ratio in %,
Lager-Verbrauchs- 50
176
350 Verhältnis in %, rechts
right 45 15.0 174
40
300 172
35 14.5
250 170
30
168
200 25 14.0
166
150 20 164
13.5
15 162
100
10 13.0 160
50 5
0 0
1981 1986 1991 1996 2001 2006 2011 2016
US corn crop forecast, left Expected US corn yield, right
Stocksaußerhalb
Vorräte ex-China,China,
left links StocksChina,
Vorräte China,links
left
Quelle: USDA, Bloomberg, Commerzbank Research
Commerzbank Research I November 2019 30Russia Russian wheat production and exports, million tons
As previously, the State Programme is focussed
on increasing investments in agriculture and
downstream industries and providing production
stimulus to import competing sectors.
The ban on agro-food imports from a number of
countries imposed in 2014 was extended until
end-2020.
On the export policy side, export development
is a new policy priority (not only grain and
oilseeds, but also pork and poultry meat). Russia Strong depreciation of the ruble supported exports
wants to become a “global player”. The Chinese 90
80
market is regarded as one of the key destinations 70
for export development. 60
50
40
Strong increase in wheat exports was supported 30
by big harvests led by yield increases and the 20
steep depreciation of the ruble in 2014/15 after 10
0
liberalisation of the currency regime. Difficulties 2001 2003 2005 2007 2009 2011 2013 2015 2017 2019
going forward: huge distances (production RUB per EUR RUB per USD
potential > export potential)
Source: FAO/OECD, Commerzbank Research
Commerzbank Research I November 2019 31Estimated paths of net trade in the „Business as Usual“ ( yellow) and
„Towards sustainability“ (green) scenarios
Cereals Total agricultural commodities
Source: FAO, 2018:The Future of food and agriculture. Alternative pathways to 2050, p. 81, Commerzbank Research
Commerzbank Research I November 2019 32You can also read