FOUR CORNERS PROPERTY TRUST - NYSE: FCPT

Page created by Tina Lambert
 
CONTINUE READING
FOUR CORNERS PROPERTY TRUST - NYSE: FCPT
FOUR CORNERS PROPERTY TRUST
        NYSE: FCPT

  I N V E S T O R P R E S E N T AT I O N | N O V E M B E R 2 0 2 0   www.fcpt.com

1 | FCPT | NOVEMBER 2020
FOUR CORNERS PROPERTY TRUST - NYSE: FCPT
F O R W AR D L O O K I N G S T AT E M E N T S
AN D D I S C L AI M E R S

Cautionary Note Regarding Forward-Looking Statements:
This presentation contains forward-looking statements within the meaning of the federal securities laws. Forward-looking statements include all
statements that are not historical statements of fact and those regarding FCPT’s intent, belief or expectations, including, but not limited to,
statements regarding: operating and financial performance, acquisition pipeline, expectations regarding the making of distributions and the
payment of dividends, and the effect of pandemics such as COVID-19 on the business operations of FCPT and FCPT’s tenants and their
continued ability to pay rent in a timely manner or at all. Words such as “anticipate(s),” “expect(s),” “intend(s),” “plan(s),” “believe(s),” “may,”
“will,” “would,” “could,” “should,” “seek(s)” and similar expressions, or the negative of these terms, are intended to identify such forward-looking
statements. Forward-looking statements speak only as of the date on which such statements are made and, except in the normal course of
FCPT’s public disclosure obligations, FCPT expressly disclaims any obligation to publicly release any updates or revisions to any forward-
looking statements to reflect any change in FCPT’s expectations or any change in events, conditions or circumstances on which any statement
is based. Forward-looking statements are based on management’s current expectations and beliefs and FCPT can give no assurance that its
expectations or the events described will occur as described.

For a further discussion of these and other factors that could cause FCPT’s future results to differ materially from any forward-looking
statements, see the risk factors described under the section entitled “Item 1A. Risk Factors” in FCPT’s annual report on Form 10-K for the year
ended December 31, 2019, as supplemented by the risk factor described under “Part II, Item 1A. Risk Factors” in FCPT’s quarterly report on
Form 10-Q for the quarter ended September 30, 2020, and other risks described in documents subsequently filed by FCPT from time to time
with the Securities and Exchange Commission

Notice Regarding Non-GAAP Financial Measures:
The information in this communication contains and refers to certain non-GAAP financial measures, including FFO and AFFO. These non-
GAAP financial measures are in addition to, not a substitute for or superior to, measures of financial performance prepared in accordance with
GAAP. These non-GAAP financial measures should not be considered replacements for, and should be read together with, the most
comparable GAAP financial measures. Reconciliations to the most directly comparable GAAP financial measures and statements of why
management believes these measures are useful to investors are included in the supplemental financial and operating report, which can be
found in the Investors section of our website at www.fcpt.com, and on page 26 of this presentation.

2 | FCPT | NOVEMBER 2020
FOUR CORNERS PROPERTY TRUST - NYSE: FCPT
AG E N D A

  Company Overview & COVID-19 Update     Page 3

  Restaurant Industry Update             Page 5

  Lubert-Adler Strategic Joint Venture   Page 11

  Appendix                               Page 15

3 | FCPT | NOVEMBER 2020
FOUR CORNERS PROPERTY TRUST - NYSE: FCPT
EXECUTIVE SUMMARY

Portfolio and Covid-19 Update1
       FCPT’s portfolio of 751 properties across 74 restaurant and retail brands continues to perform well with
        occupancy at 99.6%
       Sector leading rent collection with 99% collected in Q3 2020 and October 2020
       Weighted average lease term of 10.5 years with less than 7% of portfolio base rent expiring before 2027

Liquidity and Capital Markets
       Issued $63 million of equity in the third quarter using our At-the-Market (ATM) equity program
       $268 million of liquidity, inclusive of cash on hand and an undrawn credit facility
       No near-term debt maturities and current leverage at 5.3x2
       Maintains stable, investment grade rating which was recently reaffirmed (Fitch: BBB-)

Acquisitions
       Through November 2, FCPT has acquired $144 million3 of properties in 2020, including $107 million since re-
        resuming activities in June with a weighted average cap rate for the year of 6.5%
       FCPT has closed over $223 million / 121 properties of outparcel transactions since October 2017

New Joint Venture with Lubert-Adler
 On October 12, FCPT announced a strategic joint venture with Lubert-Adler Real Estate Funds to acquire up
   to $150 million of vacant real estate to re-tenant with creditworthy, growing operators
       The venture has the potential to grow FCPT’s acquisition pipeline and strengthen its tenant relationships
    ____________________
    Figures as of 9/30/2020, unless otherwise noted
    1.    Based on contractual Annual Base Rent as defined in glossary, except for occupancy which is based on portfolio square footage.
    2.    Net debt to adjusted EBITDAre leverage as of 9/30/2020, see page 27 for reconciliation of net income to adjusted EBITDAre and page 26 for non-GAAP definitions.
    3.    Includes a $4.2 million tenant allowance payment made in exchange for increase rent, extended term and enhanced financial reporting.

     4 | FCPT | NOVEMBER 2020
FOUR CORNERS PROPERTY TRUST - NYSE: FCPT
AG E N D A

  Company Overview & COVID-19 Update     Page 3

  Restaurant Industry Update             Page 5

  Lubert-Adler Strategic Joint Venture   Page 11

  Appendix                               Page 15

5 | FCPT | NOVEMBER 2020
FOUR CORNERS PROPERTY TRUST - NYSE: FCPT
R E S T AU R AN T I N D U S T R Y P L AY E R S

                                                Independents            Branded Casual Dining           Branded Quick-Service

 Estimated US Number1                                  ~364,000                   ~49,000                         ~243,000

         Geography                          Urban/Suburban/Rural                 Suburban                      Suburban/Rural

                                                                                    Strong;                          Strong;
      Access to Capital                  Limited; friends and family
                                                                         publicly traded companies        publicly traded companies

 PPP Funding/Reliance                                     High                  Almost none                     Almost none

 Off-Premise Capability                                 Limited                  Moderate                  High; >60% Drive-Thru

       Technological
        Investments
                                                        Limited                    High                             High

                                    Slow; still lagging pre-COVID and   Compelling; approaching pre-   Strong; many are exceeding pre-
          Recovery
                                             many still closed                COVID levels                      COVID levels
 1.     Barclays Equity Research, Jeffrey Bernstein (September 2020)
  6 | FCPT | NOVEMBER 2020
FOUR CORNERS PROPERTY TRUST - NYSE: FCPT
R E S T AU R AN T S AL E S T R E N D S B Y
       SECTOR
         Baird’s weekly restaurant survey shows quick service has been minimally impacted by COVID, showing
          positive same-store sales since May
         Casual dining has made a strong recovery after reaching a trough even with partial capacity constraints
          through more efficient operations and to-go ordering

                                                   Baird Restaurants Surveys: Weekly Same-Store Sales vs. 2019

10%    +6% +5%
       +5%+4%                                                   +8% +9% +7% +6% +7% +8% +9% +8% +6%+9% +5%+7% +6%
 0%                         +5% +6% +5% +7% +3% +4% +6% +6% +3%                                                      +2% +4% +3% +4%
        1% 0%            -1%                                                                         0%
                                                                 -2% -2% -4% -4% -4% -3% -2% -2% -1%     -2% -1% -2% -3% -3% -4% -3%
-10%                                                -5% -4% -6%
                                       -10%-10%-10%
-20%            -25%           -13%-12%
                           -17%                                                                         -17%-18%-18%-17%-19%-18%-18%
                   -21% -20%                                                                    -21%-19%
-30%                                                   -24%-26%                         -24%-24%
                                                                            -29%-27%-27%
                                                                -30%-30%-32%
-40%                                               -35%
                   -37%
              -40%                             -41%
-50%                                       -44%
                                                          -51%
-60%                                              -56%-54%                                                                                                                                         Overall
                                                                                                                                                                                                   Casual Dining
-70%                               -64%-63%                                                                                                                                                        Quick Service
                 -77% -71%
-80%
        Jan Feb       2H 1H 2H              5/3    5/10 5/17 5/24 5/31           6/7   6/14 6/21 6/28        7/5    7/12 7/19 7/26      8/2   8/9   8/16 8/23 8/30   9/6   9/13 9/20 9/27 10/4 10/11 10/18
                      Mar Apr Apr

       ____________________
       Source: Data per The Baird Restaurant Surveys (produced by R.W. Baird & Co. Equity Research) reported 10/26/2020
       Note: Results shown may not be indicative of the ability or willingness of our tenants to pay rent on a timely basis or at all

        7 | FCPT | NOVEMBER 2020
FOUR CORNERS PROPERTY TRUST - NYSE: FCPT
C H AI N V S I N D E P E N D E N T R E S T AU R AN T
P E R F O R M AN C E

                          Consumer trailing 7-day average year-over-year spending changes at “Big Chain” and “Other” restaurants

  According to a recent Bank of America study of spending data, sales at big restaurant chains had largely
  recovered from the coronavirus pandemic while the rest of the restaurant industry is taking longer to
  bounce back
  ____________________
  Reprinted by permission. Copyright © 2020 Bank of America Corporation (“BAC”). The use of the above in no way implies that BAC or any of its affiliates endorses the views or interpretation or the use
  of such information or acts as any endorsement of the use of such information. The information is provided "as is" and none of BAC or any of its affiliates warrants the accuracy or completeness of the
  information.
  Note: Results shown may not be indicative of the ability or willingness of our tenants to pay rent on a timely basis or at all

   8 | FCPT | NOVEMBER 2020
FOUR CORNERS PROPERTY TRUST - NYSE: FCPT
K E R R O W L O N G H O R N S T E AK H O U S E
     C O V I D - 1 9 I N I T I AT I V E S & P E R F O R M AN C E
•         Kerrow includes six franchised LongHorn Steakhouses in San Antonio owned and operated by FCPT with 2019 sales of $20.6 million
•         Revenue has largely recovered and is now just below pre-COVID levels after declining over 90% year-over-year before showing the
          quick recovery emblematic of the casual dining sector

                                                                                 Year-over-year revenue
    20%
    Cruise passengers brought
    to base in San Antonio
                        Cruise State of emergency declared
                        passengers
                        test positive
                                                                                           Dining room
    0%                                                                                     75% capacity                            School starts
                                                                                           begins
                                            Spring break
             First positive case in         events canceled;                Memorial Day
             San Antonio                    amusement                                                        Dining room
                                  Grocery parks closed Mother’s Day; ran drive                               capacity
 -20%                             shortages               through business out of                            drops back
                                  begin                   back door and dine in up                           to 50%
                                                          front for social distancing

                                                           Take out
 -40%                                                      banners and
                               Public offices              menu signs
                               and local                   placed outside
                               events close                         Deep                Dining room
                                                  $5 coupon for cleaning                50% capacity
                             Dining rooms go      appetizers;       for dining          begins
                             to 50 person         filets added to room
 -60%                        max, parties of      meal deal         reopen
                             10 or less                                         Dining room
                                                Stay at                         25% capacity
                                                home                            begins
                                                order
                                                                       Set up tents
                                                starts
 -80%                                                                  for take out
                             First day dining                          visibility
                             rooms closed in
                             San Antonio            Steak Shop raw food       Worked on low cost dining
                                                    meal deals begin          room refresh while closed
                        Car side only pick up Start take out beer/wine sales;
                        begins at all locations simplified menu goes live
-100%
     1/19       2/2     2/16      3/1      3/15     3/29     4/12     4/26       5/10   5/24    6/7       6/21   7/5       7/19   8/2    8/16      8/30   9/13   9/27 10/11 10/25

      9 | FCPT | NOVEMBER 2020
FOUR CORNERS PROPERTY TRUST - NYSE: FCPT
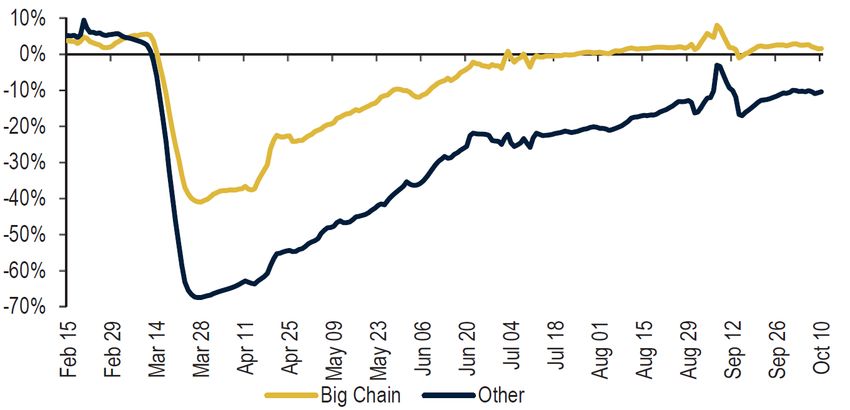
M AI N T A I N I N G AC Q U I S I T I O N
P H I L O S O P H Y AN D C R I T E R I A

Acquisition Philosophy
•   Acquire strong restaurants and retail brands that are well located with creditworthy lease guarantors
•   Purchase assets only when accretive to cost of capital with a focus on low basis.
•   Focused on adding concepts that are category-leaders in resilient industries—only leading brands and no
    theaters, fitness, or entertainment in FCPT’s portfolio or pipeline

Underwriting Criteria
•   Acquisition criteria is approximately split 50% / 50% between credit and real estate metrics based on
    FCPT’s proprietary scorecard
•   The “score” allows FCPT to have an objective underwriting model and comparison tool for asset
    management as well

                                         Credit Criteria (~50%):          Real Estate Criteria (~50%):
                                         − Guarantor credit and fitness    − Location
                                         − Brand durability                − Retail corridor strength and demographics
                                         − Store performance               − Access/visibility
                                         − Lease term                      − Absolute and market rent
                                         − Lease structure                 − Pad site and building reusability

10 | F C P T | N O V E M B E R 2 0 2 0
AG E N D A

   Company Overview & COVID-19 Update      Page 3

   Restaurant Industry Update             Page 5

   Lubert-Adler Strategic Joint Venture   Page 11

   Appendix                               Page 15

11 | F C P T | N O V E M B E R 2 0 2 0
S T R AT E G I C J O I N T V E N T U R E
OPPORTUNITY OVERVIEW

 •       The fallout of COVID-19 on the restaurant industry continues to unfold and, unfortunately, many
         stores will close. Reports have been published in recent months estimating ~65,000 restaurants1
         may go vacant in the coming years as a result of financial strain caused by the pandemic

 •       FCPT’s portfolio has performed exceptionally well despite these headwinds due to our
         focus on high quality real estate, low and sustainable rent setting, and strong tenant
         credit. As a result, our rent collections have been the strongest in the retail real estate industry

 •       We expect the vast majority of the anticipated restaurant closures will be by small brands, weaker
         concepts, and independent restaurants that are unable to compete in a challenging environment

 •       FCPT believes a unique opportunity will exist for a limited time to acquire vacant restaurant
         properties in high quality real estate locations and convert them into new stores for strong and
         growing brands

     Source: Barclays equity research, Jeffrey Bernstein August 2020

     12 | F C P T | N O V E M B E R 2 0 2 0
S T R AT E G I C J O I N T V E N T U R E
THE PARTNERSHIP

  Purpose:                  FCPT and Lubert-Adler will opportunistically bid, acquire and re-lease vacant restaurant
                            properties in attractive retail corridors. The partnership will leverage existing tenant relationships
                            and appropriate rent setting to create highly attractive and marketable net lease properties

  Commitment: The total commitment of up to $150 million will be jointly funded by Lubert-Adler ($130 million /
              87%) and FCPT ($20 million / 13%)

  Take-Out:                 FCPT will have a right of first refusal to acquire Lubert-Adler’s stake in stabilized properties,
                            creating a new source of future acquisition volume for our core business in those cases where
                            market pricing matches our return thresholds

   In-depth knowledge of restaurant real estate                          Strong track record of re-leasing vacant
   Strong tenant relationships with top operators in                      properties including Toys “R” Us and ShopKo
    casual dining and quick service industry                              Key investor in Albertson’s
   Proven expertise in sustainable rent setting and                      Re-leased ~170 million square feet to date
    property selection                                                    Tenant relationships developed through past
   Industry sharpshooter in restaurant and retail                         grocery-anchored outparcel strategies
    underwriting                                                          Extensive ground presence for deal sourcing
   Natural take-out option for stabilized properties                      and investment decisions

  13 | F C P T | N O V E M B E R 2 0 2 0
IDENTIFYING THE OPPORTUNITY

                                                                                      Basis
                                                                                      Reset

                                                                                                       Strong
                                                                                Better               Real Estate
                                                                             Demographics

                                                                                  Drive-thru                                No Vacancy
                                      Vacancy Likely                                Zoned                             (Gaining Market Share,
                                    (The Opportunity)
                                                                                                                         Long-Term Hold)
                                                                                  High Traffic
 Weak                                                                                                                                                            Strong
Tenant/                                                                            Signalized                                                                   Tenant/
                                                                                     Corner                                                                     Concept
Concept

                        Regional Concept /                National Concept/                                        National Concept/               Innovative/
 Independents         Challenged Off-Premise            Challenged Off-Premise                                   Good Response to COVID        Strong Off-Premise

                                                                                 Weak Access
                                                                                                                          Vacancy Limited
                                       Vacancy Likely
                                                                                                                       (Long-Term Closures,
                                       (Avoid / Pass)                            Poor Visibility                      No Immediate Defaults)

                                                                             Ample “Green”
                                                                                Space

                                                                             Low Population

                                                                                                     Weak
                                                                                                   Real Estate

      14 | F C P T | N O V E M B E R 2 0 2 0
AG E N D A

   Company Overview & COVID-19 Update      Page 3

   Restaurant Industry Update              Page 5

   Lubert-Adler Strategic Joint Venture   Page 11

   Appendix                               Page 15

15 | F C P T | N O V E M B E R 2 0 2 0
O U T P AR C E L S T R AT E G Y U P D AT E :
    >$280 MILLION OF LOW BASIS PROPERTIES

      FCPT continues to engage with mall and shopping center owners in its outparcel acquisition strategy with several sellers
       entering repeat and expanded portfolio transactions

      Mall / shopping center outparcels are typically low rent, ground leased properties with national brands. The properties are
       often operated or guaranteed by the brand’s corporate entity (vs. franchisee credit)

      FCPT has closed over $223 million of outparcel transactions representing 121 properties since initiating the strategy in
       October 2017. FCPT is also under contract to acquire over $58 million of additional outparcels2 as they become
       parcelized

      Counterparties have included WPG, Brookfield, Seritage and others. The parcelization process can take 3 to 12+ months
       depending on the jurisdiction
           Outparcel Closings Update
                                                                                                                                                                Other
           As of 11/02/2020                                      WPG I                   WPG II               Brookfield                Seritage              Outparcels             Total Closed1
           Closed
                                                             42 / $67.7                7 / $11.3              16 / $26.8              21 / $60.4               35 / $57.0            121 / $223.1
           (Properties / $ millions)
                                                  2
           Remaining to be Closed
           Purchase Price ($ millions)                            $1.9                   $20.1                   $19.5                    $15.9                                           $57.5
           Leases                                                    1                       9                       8                        5                                              23
           Price per Lease ($ millions)                           $1.9                    $2.2                    $2.4                    $3.2                                             $2.5
           Rent per square foot                                   $17                     $25                      $18                     $27                                              $21
    ___________________
    1.   Certain properties have been removed from the portfolios since transactions were initially announced as a result of continued deal negotiations.
    2.   The remaining to be closed transactions are each subject to customary closing conditions, diligence and regulatory approvals and there can be no assurance that these transactions will be
         consummated on the contemplated timeline, or at all, or that the Company’s actual results will not differ materially from the figures set forth above.

     16 | F C P T | N O V E M B E R 2 0 2 0
C OM P AN Y M OM E N T U M S I N C E
   I N C E P T I ON I N N OV E M B E R 2 0 1 5

                                                                                                                               Casual, Family &
                                              At Inception                                                   As of 9/30/2020     Fine Dining

 Team Members                                           4                                      +19                  23

                                                                                          +$53.4 million /
Annual Base Rent1                             $94.4 million                                                   $147.8 million
                                                                                              +57%

    Properties                                        418                                  +333 / +80%             751

        Brands                                          5                                      +69                  74

   % Darden2                                        100%                                       -32%               68%          Quick Service &
                                                                                                                                 Fast Casual
   Overhead
   Efficiency3
                                                   10.0%                                      -1.8%               8.2%

Equity Market Cap                              $848 million                                +$1.1 billion       $1.9 billion4

 Enterprise Value                               $1.3 billion                               +$1.3 billion       $2.6 billion4

Financial Leverage                                   4.6x                                      +0.7x              5.3x4

Weighted Average
  Lease Term                                      15 years                                  - 4.5 years         10.5 years

   1.    Annual cash base rent (ABR) as defined in glossary.
   2.    Based on annual base rent.
   3.    Overhead Efficiency defined as cash G&A expense divided by cash rental income.
   4.    See page 21 for calculation.

    17 | F C P T | N O V E M B E R 2 0 2 0
FCPT EVOLUTION SINCE SPIN-OFF:
SIGNIFICANT PROGRESS ON TENANT
DIVERSIFICATION

                                                        Brand Exposure by Annualized Base Rent (ABR)

                                                                                                                                  14%                   Other Darden2
                                                                                                                               114 leases      3%
                                                          20%                                                                               14 leases

                                                         104 leases            Other Darden                                                    9%
                                                                   6%                                                                       64 leases
                                                               14 leases
                                           74%
                                      300 leases                                                                                      Other Restaurants
                                                                                                                        51%                 21%
                                                                                                                     308 leases          228 leases
                                                                                                                                         43 brands

                                                                            +56.6% in rent

                                                                                                                                              Non-Restaurant Retail
                                                                                                                                            2% / 28 Leases / 24 Brands

                                Initial Portfolio at Spin:                                                            FCPT Portfolio Today:
                                  418 Leases / 5 Brands                                                               756 Leases / 74 Brands
                             Annual Base Rent of $94.4 million                                                   Annual Base Rent of $147.8 million1
                                 100% Darden Exposure                                                                 68% Darden Exposure

 ___________________
 1.   Represents current scheduled minimum Annual Cash Base Rent (ABR) as of 9/30/2020, as defined on page 26.
 2.   Other Darden represents Bahama Breeze, Cheddar’s, Seasons 52, and Eddie V’s branded restaurants.

  18 | F C P T | N O V E M B E R 2 0 2 0
19 | FCPT | O CT O B E R 2019

        AC Q U I S I T I O N G R O W T H

                Annual Base Rent ($ million)1
                                                                                    +10% CAGR                                                                147.8
                                                                                                                                           139.4 142.0 144.1
                                                                                                                    126.8 129.7 130.9
                                                                                                        120.9 125.6
                                                                             108.0 109.4 109.6
                                                           102.1 105.2 105.3
                     94.4     94.4    94.4      95.9 101.0

                     4Q15    1Q16     2Q16      3Q16   4Q16   1Q17   2Q17   3Q17   4Q17   1Q18   2Q18   3Q18   4Q18   1Q19   2Q19   3Q19   4Q19   1Q20   2Q20   3Q20

                Number of Properties
                                                                                    +13% CAGR
                                                                                                                                                         733    751
                                                                                                                                           699    722
                                                                                                                             642    650
                                                                                                               610    621
                                                                                                        591
                                                                            508    515    527    535
                                                              484    506
                                                       475
                     418      418         418   434

        .

                     4Q15    1Q16     2Q16      3Q16   4Q16   1Q17   2Q17   3Q17   4Q17   1Q18   2Q18   3Q18   4Q18   1Q19   2Q19   3Q19   4Q19   1Q20   2Q20   3Q20
            ___________________
            1.   As defined on page 26.

            19 | F C P T | N O V E M B E R 2 0 2 0
L E AS E M AT U R I T Y S C H E D U L E

                                                Lease Maturity Schedule (% Annualized Cash Base Rent1)

          99.6% occupied2 as of
                9/30/2020                                                                                        15.7%

                                                                          13.7%
   Weighted average lease term
                                                                  12.3%
          of 10.5 years                                                           11.7%
                                                                                          11.1%
                                                                                                  10.3%

      Less than 6.8% of rental
   income matures prior to 2027                                                                           7.4%

                                                                                                                                              3.0%                                       3.0%
                                                                                                                                       2.4%
                                          1.6% 1.7%
                           1.1% 1.0%                       1.1%                                                                 1.2%
                                                                                                                         0.7%                               0.5%
            0.0% 0.3%                                                                                                                                0.2%          0.1% 0.0% 0.0% 0.0%

            2020 2021 2022 2023 2024 2025 2026 2027 2028 2029 2030 2031 2032 2033 2034 2035 2036 2037 2038 2039 2040 2041 2042 2043 2044

___________________
Note: Excludes renewal options. All data as of 9/30/2020
1.    Annual cash base rent (ABR) as defined on page 26.
2.    Occupancy based on portfolio square footage.

20 | F C P T | N O V E M B E R 2 0 2 0
S U M M AR Y C AP I T AL I Z A T I O N AN D
 F I N AN C I AL S

Capitalization                                                                                                               Current Trading Metrics
($ million, except per share)                                                                                                Annual base rent2 ($ million)                                                 $147.8

Share price (9/30/2020)                                                                    $25.59                            Implied Cap Rate                                                                  5.6%
                                                                                                                                                              3
                                                                                                                             Price / AFFO Multiple                                                            17.3x
Shares and OP units outstanding (millions)                                                     73.0
                                                                                                                                                                            4
                                                                                                                             Annualized Dividend per share                                                    $1.22
Equity value                                                                               $1,867
                                                                                                                             Dividend Yield4,5                                                                 4.8%
Debt:
 Bank term debt                                                                               $400
 Revolving credit facility                                                                         $0
 Unsecured private notes                                                                      $350
Total market capitalization                                                                $2,617
Less: Cash and cash equivalents                                                                ($18)
Implied enterprise Value                                                                   $2,600

Credit Metrics                                                                            Current
            6
Net debt to enterprise value                                                                28.2%
Net debt6 to adjusted EBITDAre1                                                                  5.3x
 ___________________
 Figures represent FCPT financials as of and for three months ended 9/30/2020
 1.    Represents Q3 2020 annualized results. See page 27 for reconciliation of net income to adjusted EBITDAre and page 26 for non-GAAP definitions.
 2.    Figure represents current scheduled minimum contractual rent as of 9/30/2020.
 3.    Based on FCPT share price as of 9/30/2020 and FCPT Q3 2020 AFFO ($0.37) annualized.
 4.    Based on quarterly cash dividend of $0.305 per share declared on 9/17/2020 and paid on 10/15/2020 annualized. The declaration of future dividends will be at the discretion of FCPT’s board of directors.
 5.    Dividend yield calculated based on the price per share as of 9/30/2020 and declared dividend per share for the most recent quarter, annualized.
 6.    Net debt figure (in $ millions) represents total debt ($750 million) less cash and cash equivalents ($18 million) as of 9/30/2020.

  21 | F C P T | N O V E M B E R 2 0 2 0
F C P T D E B T M AT U R I T Y S C H E D U L E

($ in Millions)
   4.9-year weighted average                                                                                                                                                                            (1)
             term                                                                                                                                                           Undrawn Revolver Capacity

        87% fixed rate debt                                                                                                                                                 Drawn Revolver

 3.3% weighted average cash
        interest rate                                                                                                                                                       Unsecured Term Loan

 Full $250 million available on
           revolver                                                                                                                                                         Unsecured Notes
                                   $250

                                                     $150               $150              $150

                                                                                           $100
                                                                                                                                                   $75                                         $75
                                                                                                                                 $50                                  $50          $50

                                                                                           $50
                   $0

                  2020             2021              2022               2023              2024               2025               2026              2027               2028          2029       2030
% of Total Debt    0%              0%                 20%                20%               20%                 0%                7%                10%                7%            7%         10%
Outstanding

   ___________________
   Figures as of 9/30/2020
   1.    The revolving credit facility expires on November 9, 2021 subject to FCPT’s availability to extend the term for two additional six-month periods to November 9, 2022.

    22 | F C P T | N O V E M B E R 2 0 2 0
B R AN D D I V E R S I F I C AT I O N

FCPT Portfolio Brands

                                                          Square Feet      % of                                              Square Feet      % of
                                                                              (1)                                                               (1)
Rank    Brand Name                          Number             (000s)     ABR       Rank    Brand Name              Number        (000s)    ABR
1       Olive Garden                           308               2,623    50.7%     16      Wendy's                      7            24     0.5%
2       Longhorn Steakhouse                    114                 639    14.4%     17      McDonald's                   5            23     0.5%
3       Chili's                                 64                 352     8.7%     18      Chick-Fil-A                  6            29     0.4%
4       Red Lobster                             21                 155     3.3%     19      McAlister's Deli             4            15     0.4%
5       Burger King                             24                  77     2.2%     20      Starbucks                    6            13     0.4%
6       Bahama Breeze                           10                  92     2.1%     21      Popeyes                      5            14     0.3%
7       Buffalo Wild Wings                      18                 111     2.1%     22      Panera                       4            22     0.3%
8       Bob Evans                               17                  93     1.8%     23      Pizza Hut                    6            15     0.3%
9       BJ's Restaurant                         10                  82     1.6%     24      Steak 'N Shake               4            15     0.3%
10      KFC                                     20                  57     1.1%     25      AAA                          1            14     0.2%
11      Arby's                                  15                  47     1.1%     26-74   Other                       60            307    4.8%
12      Texas Roadhouse                          9                  65     0.8%             Total Lease Portfolio      756          4,962    100%
13      Taco Bell                               11                  28     0.7%
14      Seasons 52                               2                  18     0.5%
15      Outback Steakhouse                       5                  33     0.5%

___________________
1.   Annual cash base rent (ABR) as of 9/30/2020 as defined on page 26.

 23 | F C P T | N O V E M B E R 2 0 2 0
G E O G R AP H I C D I V E R S I F I C AT I O N

                                                                                                              ND
                                                    WA                                MT
                                                                                                                              MN

751 Properties                                                        ID
                                                                                                              SD                         WI
                                                                                                                                                     MI                                     VT NH
                                                                                                                                                                                                    ME

                                                   OR
                                                                                           WY                                                                                       NY
                                                                                                                                   IA                                                        MA
                                                                                                                 NE                                                                         CT RI
                                                                                                                                                                          PA
                                                                                                                                                          OH
                                                              NV                                                                          IL    IN
  46 States                                                                   UT                CO
                                                                                                                    KS              MO                          WV
                                                                                                                                                                               MD
                                                                                                                                                                                     NJ
                                                                                                                                                                                    DE
                                                                                                                                                     KY                   VA

                                                         CA                                                                                     TN                                       Annualized
                                                                                                                         OK                                          NC
                                                                                                                                                                                                  1
                                                                                                                                    AR                                                   Base Rent (%)
                                                                                                NM
  74 Brands                                                                                                                                                                                   ≥10.0%
                                                                             AZ                                                                                 SC
                                                                                                                                         MS    AL
                                                                                                                                                          GA                                 5.0%–10.0%
                                                                                                                                    LA
                                                                                                                   TX
                                                                                                                                                                                             3.0%–5.0%
                                                                                                                                                                                             2.0%–3.0%

 5.0 mm sq ft                                                                                                                                                  FL                            1.0 %–2.0%
2 0 2 0 C L O S E D AC Q U I S I T I O N S

      2020 Closed Acquisitions
                                                                                                                                                               Purchase     Initial Cash Term
      Tenant                                                                               Location     # of Properties    Operator / Guarantor Information   Price ($mm)       Yield    (years)   Announced Close
      Arby's                                                                                 NC                1           Corporate                              $1.6          6.6%        7          1/6/2020
      Chili's / Texas Roadhouse                                                              KS                2           Franchisee / Corporate                 $2.1          6.3%        6         1/10/2020
      PREIT: REI                                                                              MI               1           Corporate                              $5.2            --        9         1/24/2020
      Bojangles                                                                              NC                1           Corporate                              $1.5          6.8%        5         1/29/2020
      Potbelly / Verizon                                                                     WI                1           Corporate / Franchisee                 $2.0          7.3%        6         1/29/2020
      WPG: Chili's                                                                            IN               2           Corporate                              $2.0            --        4         2/13/2020
      Brookfield: BJ's Restaurant, Black Angus Steakhouse, Bonefish Grill, Olive         MI, MN, MO,
                                                                                                               9           8 Corporate, 1 Franchisee             $12.9           --         4         2/21/2020
      Garden, IHOP, Wendy's, Huntington Bank, local car wash, FedEx Kinko's              NC, OK, WA
      Brookfield: LongHorn Steakhouse / Panera Bread / Applebee's                            MI                 3          2 Corporate, 1 Franchisee              $4.3          --          7         2/26/2020
      PREIT: Chipotle / Chick-Fil-A                                                          SC                 2          2 Corporate                            $2.9          --          9          3/3/2020
      Burger King                                                                            AL                 1          Corporate                              $1.8        6.7%          4         3/12/2020
      Big O Tires                                                                            MN                 1          Corporate                              $2.7        6.6%          5         6/19/2020
      PREIT: Burger King / Firestone / Olive Garden / Starbucks                          MD, SC, NC             4          4 Corporate                            $6.8          --          6         6/23/2020
      Texas Roadhouse                                                                        CO                 1          Corporate                              $4.3        6.4%          5         6/26/2020
      PREIT: IHOP / Multi-tenant: BJ's Restaurant, Sleep Number, Verizon                   SC, MD               2          3 Corporate, 1 Franchisee              $7.6          --          7         6/30/2020
      Seritage: Olive Garden / LongHorn Steakhouse (2)                                       FL                 3          3 Corporate                           $11.3          --          9         6/30/2020
      Texas Roadhouse                                                                        ME                 1          Corporate                              $1.8        6.4%          9          7/2/2020
      Brookfield: LongHorn Steakhouse                                                        OK                 1          Corporate                              $1.8          --          5          7/6/2020
      Seritage: Carrabba's                                                                   SC                 1          Corporate                              $1.6          --          3         7/13/2020
      BP                                                                                     IL                 1          Corporate                              $3.3        6.5%          4         7/14/2020
      Caliber Collision                                                                      WI                 1          Corporate                              $1.8        6.7%         10         7/15/2020
                    1
      Olive Garden                                                                           TX                 1          Corporate                              $3.1          --         10         7/31/2020
      Tires Plus                                                                             KS                 1          Corporate                              $2.2        7.2%          4         8/12/2020
      Seritage: BJ's Restaurant                                                              MD                 1          Corporate                              $3.1          --          7          9/1/2020
      Seritage: Arby's / AAA                                                               UT, CA               2          2 Corporate                            $7.0          --          9          9/3/2020
      BJ's Restaurant                                                                        TX                 1          Corporate                              $3.8          --         15         9/15/2020
                                                   2
      BJ's Restaurant (Tenant Allowance Payment)                                         OH, OK, IN             3          Corporate                              $4.2          --         10         9/15/2020
      WPG: Chick-Fil-A                                                                       IN                 1          Corporate                              $2.1          --          6         9/17/2020
      LongHorn Steakhouse                                                                    FL                 1          Corporate                              $3.2          --          5         9/22/2020
      Texas Roadhouse                                                                        IL                 1          Corporate                              $3.8        6.3%         15         9/22/2020
      Brookfield: Wells Fargo                                                                ID                 1          Corporate                              $1.8          --          4         9/23/2020
      Caliber Collision                                                                      IL                 1          Corporate                              $3.0        6.5%         15         9/24/2020
      Seritage: Bahama Breeze                                                                SC                 1          Corporate                              $2.8          --         10         9/29/2020
      Seritage: Popeyes                                                                      SC                 1          Franchisee                             $1.6          --         14         9/30/2020
      Buffalo Wild Wings                                                                     NC                 1          Corporate                              $1.4        6.4%          4         10/14/2020
      Verizon                                                                                FL                 1          Franchisee                             $1.1        7.1%          4         10/16/2020
      Seritage: Truist Bank                                                                  VA                 1          Corporate                              $2.2          --          9         10/16/2020
      Olive Garden                                                                           SC                 1          Corporate                              $2.9        6.2%          6         10/20/2020
      Multitenant: Panera, AT&T                                                              IN                 1          2 Corporate                            $2.6        7.0%          9         10/26/2020
      WPG: Wendy's                                                                           VA                 1          Corporate                              $1.2          --          4         10/29/2020
      BJ's Restaurant                                                                        OH                 1          Corporate                              $3.8          --         15         10/30/2020
      Verizon Four-Pack                                                                    OH, PA               4          4 Franchisee                           $7.2        7.1%          9         11/2/2020
                                                                                          YTD 2020             66                                               $143.6        6.5%         8
___________________________
1.   Does not include $2.4 land purchase on which FCPT is developing a LongHorn Steakhouse as part of the Kerrow operating business.
2.   Tenant allowance payment made in the third quarter in exchange for increased rent, extended term and enhanced financial reporting, among other items.

 25 | F C P T | N O V E M B E R 2 0 2 0
G L O S S AR Y AN D N O N - G A A P D E F I N I T I O N S

                                          Non-GAAP Definitions and Cautionary Note Regarding Forward-Looking Statements:
This document includes certain non-GAAP financial measures that             employed by other REITs.                                                  condition and results from operations, the utility of FFO as a measure
management believes are helpful in understanding our business, as                                                                                     of our performance is limited. FFO is a non-GAAP measure and
further described below. Our definition and calculation of non-GAAP         Tenant EBITDAR is calculated as EBITDA plus rental expense.               should not be considered a measure of liquidity including our ability
financial measures may differ from those of other REITs and therefore       EBITDAR is derived from the most recent data provided by tenants          to pay dividends or make distributions. In addition, our calculations of
may not be comparable. The non-GAAP measures should not be                  that disclose this information. For Darden, EBITDAR is updated once       FFO are not necessarily comparable to FFO as calculated by other
considered an alternative to net income as an indicator of our              annually by multiplying the most recent individual property level         REITs that do not use the same definition or implementation
performance and should be considered only a supplement to net               sales information (reported by Darden twice annually to FCPT) by the      guidelines or interpret the standards differently from us. Investors in
income, and to cash flows from operating, investing or financing            brand average EBITDA margin reported by Darden in its most recent         our securities should not rely on these measures as a substitute for any
activities as a measure of profitability and/or liquidity, computed in      comparable period, and then adding back property level rent. FCPT         GAAP measure, including net income.
accordance with GAAP.                                                       does not independently verify financial information provided by its
                                                                            tenants.                                                                  Adjusted Funds From Operations “AFFO” is a non-GAAP
Annual Base Rent (ABR) refers to annual cash base rent as of                                                                                          measure that is used as a supplemental operating measure specifically
9/30/2020 and represents monthly contractual cash rent, excluding           Tenant EBITDAR coverage is calculated by dividing our reporting           for comparing year over year ability to fund dividend distribution
percentage rents, from leases, recognized during the final month of the     tenants’ most recently reported EBITDAR by annual in-place cash           from operating activities. AFFO is used by us as a basis to address our
reporting period, adjusted to exclude amounts received from                 base rent.                                                                ability to fund our dividend payments. We calculate adjusted funds
properties sold during that period and adjusted to include a full month                                                                               from operations by adding to or subtracting from FFO:
of contractual rent for properties acquired during that period.             Funds From Operations (“FFO”) is a supplemental measure of our              1. Transaction costs incurred in connection with business
                                                                            performance which should be considered along with, but not as an                 combinations
EBITDA represents earnings (GAAP net income) plus interest                  alternative to, net income and cash provided by operating activities as     2. Straight-line rent
expense, income tax expense, depreciation and amortization.                 a measure of operating performance and liquidity. We calculate FFO          3. Stock-based compensation expense
                                                                            in accordance with the standards established by NAREIT. FFO                 4. Non-cash amortization of deferred financing costs
EBITDAre is a non-GAAP measure computed in accordance with                  represents net income (loss) (computed in accordance with GAAP),            5. Other non-cash interest expense (income)
the definition adopted by the National Association of Real Estate           excluding gains (or losses) from sales of property and undepreciated        6. Non-real estate investment depreciation
Investment Trusts (“NAREIT”) as EBITDA (as defined above)                   land and impairment write-downs of depreciable real estate, plus real       7. Merger, restructuring and other related costs
excluding gains (or losses) on the disposition of depreciable real estate   estate related depreciation and amortization (excluding amortization        8. Impairment charges
and real estate impairment losses.                                          of deferred financing costs) and after adjustments for unconsolidated       9. Other non-cash revenue adjustments, including amortization of
                                                                            partnerships and joint ventures. We also omit the tax impact of non-             above and below market leases and lease incentives
Adjusted EBITDAre is computed as EBITDAre (as defined above)                FFO producing activities from FFO determined in accordance with the         10. Amortization of capitalized leasing costs
excluding transaction costs incurred in connection with the acquisition     NAREIT definition.                                                          11. Debt extinguishment gains and losses
of real estate investments and gains or losses on the extinguishment of                                                                                 12. Recurring capital expenditures and tenant improvements
debt.                                                                       Our management uses FFO as a supplemental performance measure             AFFO is not intended to represent cash flow from operations for the
                                                                            because, in excluding real estate related depreciation and amortization   period, and is only intended to provide an additional measure of
We believe that presenting supplemental reporting measures, or non-         and gains and losses from property dispositions, it provides a            performance by adjusting the effect of certain items noted above
GAAP measures, such as EBITDA, EBITDAre and Adjusted                        performance measure that, when compared year over year, captures          included in FFO. AFFO is a widely-reported measure by other REITs;
EBITDAre, is useful to investors and analysts because it provides           trends in occupancy rates, rental rates and operating costs. We offer     however, other REITs may use different methodologies for
important information concerning our on-going operating                     this measure because we recognize that FFO will be used by investors      calculating AFFO and, accordingly, our AFFO may not be
performance exclusive of certain non-cash and other costs. These non-       as a basis to compare our operating performance with that of other        comparable to other REITs.
GAAP measures have limitations as they do not include all items of          REITs. However, because FFO excludes depreciation and
income and expense that affect operations. Accordingly, they should         amortization and captures neither the changes in the value of our         Properties refers to properties available for lease.
not be considered alternatives to GAAP net income as a performance          properties that result from use or market conditions, nor the level of
measure and should be considered in addition to, and not in lieu of,        capital expenditures and capitalized leasing commissions necessary to
GAAP financial measures. Our presentation of such non-GAAP                  maintain the operating performance of our properties, all of which
measures may not be comparable to similarly titled measures                 have real economic effect and could materially impact our financial

    26 | F C P T | N O V E M B E R 2 0 2 0
R E C O N C I L I AT I O N O F N E T I N C O M E T O
     AD J U S T E D E B I T D A R E

($000s, except shares and per share data)                       Three Months Ended September 30,          Nine Months Ended September 30,
Unaudited                                                          2020                 2019                 2020                2019
Net Income                                                    $         19,404   $           18,409   $           57,260   $          53,946
Adjustments:
  Interest expense                                                       7,410                6,665              21,732               19,969
  Income tax expense                                                        67                   69                 192                  198
  Depreciation and amortization                                          7,523                6,653              21,670               19,532
EBITDA(1)                                                               34,404               31,796             100,854               93,645
Adjustments:
 Gain on dispositions and exchange of real estate                          -                    -                   -                    -
 Provision for impairment of real estate                                   -                    -                   -                    -
EBITDAre (1)                                                            34,404               31,796             100,854               93,645
Adjustments:
 Real estate transaction costs                                              68                   31                 200                   73
 Gain or loss on extinguishment of debt                                    -                    -                   -                    -
Adjusted EBITDAre (1)                                                   34,472               31,827             101,054               93,718
Annualized Adjusted EBITDAre                                  $        137,889    $         127,307   $         134,739    $         124,958

     ___________________________
     1.   See glossary on page 26 for non-GAAP definitions.

      27 | F C P T | N O V E M B E R 2 0 2 0
FOUR CORNERS PROPERTY TRUST
          NYSE: FCPT

   I N V E S T O R P R E S E N T AT I O N | N O V E M B E R 2 0 2 0   www.fcpt.com

28 | F C P T | N O V E M B E R 2 0 2 0
You can also read