Libbey Inc. Investor Presentation - January 2019
←
→
Page content transcription
If your browser does not render page correctly, please read the page content below

Libbey Inc.
Investor Presentation
January 2019
Management
        Bill Foley
        Chairman and Chief Executive Officer
        • Served as Chairman & CEO of Blonder Accents,
          Blonder Company, LESCO Inc., and Think Well Inc.
        • Director of Company Since 1994
        • First 14 Years of his career at Anchor Hocking Corp.

        Jim Burmeister
        Senior Vice President, Chief Financial Officer
        •   VP, Finance & Treasurer, The Anderson’s, Inc.
        •   VP, Finance, Owens Corning
        •   GE Corporate Audit Staff
        •   Captain in the Marine Corps

        Joe Huhn
        Vice President, General Manager, U.S. and Canada
        •   23 years Corporate Finance Experience
        •   1 year serving as Vice President, FP&A and Investor Relations
        •   3 years serving as Group CFO, U.S. and Canada
        •   Finance Director for 8 years at Whirlpool

                                                                            2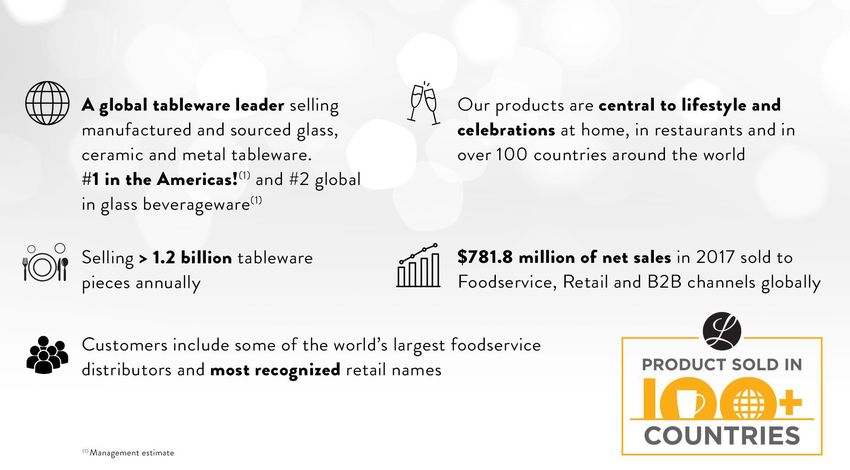
Safe Harbor Statement
Material provided in this presentation includes forward-looking statements about Libbey Inc. These statements
are subject to risks and uncertainties, including market conditions, competitive pressures, the value of the U.S.
dollar and potential significant cost increases. Please refer to the Company’s Form 10-K for fiscal year-end
December 31, 2017, filed on March 1, 2018 for further information.

This presentation includes financial information of which the Company’s independent auditors have not
completed their review. Although the Company believes that the assumptions upon which the financial
information and its forward looking statements are based are reasonable, it can give no assurances that these
assumptions will prove to be accurate.

This presentation also contains non-GAAP financial measures. We believe that the Adjusted Earnings Before
Interest Taxes Depreciation and Amortization, or Adjusted EBITDA; Adjusted EBITDA margin; Trade Working
Capital; Debt, net of cash to Adjusted EBITDA; ROIC and references to sales in constant currency are
meaningful measures for investors to compare our results from period to period.

Reconciliations of the non-GAAP to GAAP measures may be found in the Appendix of this presentation as well
as in the previously filed earnings press releases.

                                                                                                                    3
Corporate Overview
C O R P O R AT E O V E R V I E W

Libbey overview

                                   5
C O R P O R AT E O V E R V I E W

Our manufacturing and supply chain platform
allows us to reach customers across the globe

                                                6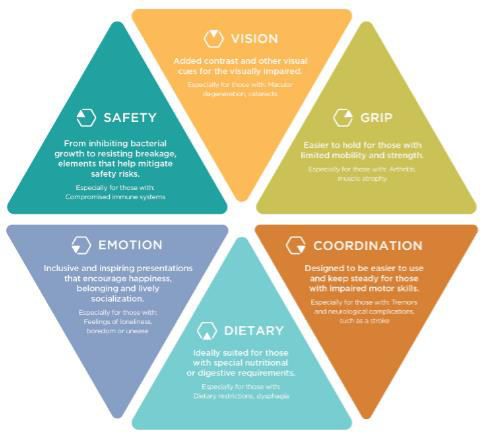
C O R P O R AT E O V E R V I E W

   Our business model is designed to serve
   customers in three distinct channels
                 2017 Net Sales                                2017 Net Sales                2017 Segment
                  by Segment                                    by Channel                       EBIT
                         Other                                             B2B                           Latin America
          EMEA            4%                                               26%                                13%
                                                                                                                         EMEA
           16%                                        Retail                                                              3%
                                                       32%                                                                      Other
                                                                                                                                (8%)

Latin America
     18%                              U.S. & Canada                        Foodservice
                                           62%                                42%        U.S. & Canada
                                                                                              92%

                                                                                                                                    7
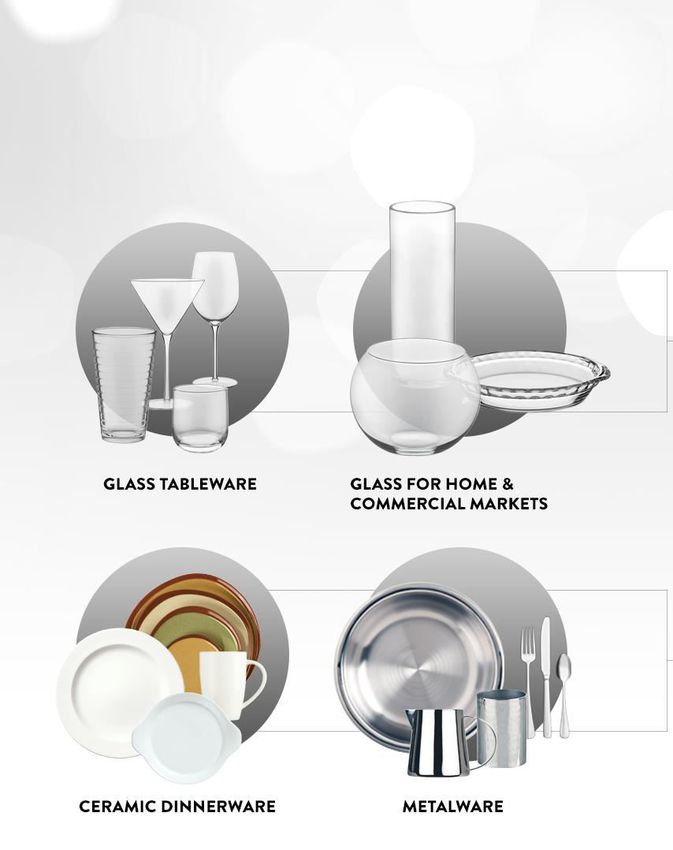
C O R P O R AT E O V E R V I E W

Globally, Libbey competes in four categories of
products

                                   ~87% OF SALES
                                   Tumblers, stemware, mugs, bowls, floral, salt shakers, shot
                                   glasses, canisters, candleholders

                                   Bakeware, handmade tableware, blender jars, mixing bowls, floral, and
                                   candles

                                   ~13% OF SALES
                                   Plates, bowls, platters, cups, saucers, and other tableware
                                   accessories
                                   Knives, forks, spoons, serving utensils, serving
                                   trays, pitchers, other metal tableware accessories
                                                                                                           8
C O R P O R AT E O V E R V I E W

Libbey has a strong portfolio of brands

                                          9
C O R P O R AT E O V E R V I E W : F O O D S E R V I C E

Foodservice channel: 2017 net sales of $328M
  • Market leader recognized for                           WE SELL TO THE LARGEST CUSTOMERS IN THE
    excellence by leading foodservice                      FOODSERVICE INDUSTRIES:
                                                                                   CRISTALERIA DEL ANGEL-
    distributors                                                                   Equipment & Supply

  • Extensive product line and steady                                              CRISTALERIA MONACO-
                                                                                   Equipment & Supply
    pace of innovation has enabled U.S.
    price increases in 43 of last 47 years                                         EDWARD DON &
                                                                                   COMPANY-
  • Strong foodservice network and in-                                             Equipment & Supply
    house salesforce selling to                                                    JOHN ARTIS-
    established restaurants, hospitality                                           UK Equipment & Supply
    and tourism along with other                                                   SYSCO-
    categories                                                                     Broad Line

                                                                                   TRIMARK-
  • ‘Annuity like’ revenue stream with a                                           Equipment & Supply
    strong ‘installed base’ of customers
                                                                                   US FOODS-
    reordering based on table setting                                              Broad Line
    placements
                                                                                   WASSERSTROM-
  • Best in class service                                                          Equipment & Supply

                                                                                   WEBSTAURANT-
                                                                                   Web-based distribution
                                                                                                            10
C O R P O R AT E O V E R V I E W : R E T AI L
Retail channel: 2017 net sales of $249M
• U.S. casual glass beverageware
leader; market share in brick and STRONG RELATIONSHIPS WITH MAJOR RETAILERS:
mortar estimated at ~35%…more than
twice the next competitor(1) AMAZON
• Highly recognized brands and BED BATH &
leading private label supplier BEYOND
CRATE & BARREL
• New E-commerce capabilities
position the company for continued DOLLAR TREE
leadership; ~400 SKUs online IKEA
• Extensive branded product lines METRO
including bakeware and serveware SORIANA
• Established retail relationships TARGET
provide a platform to launch TESCO
innovative products that meet
consumer wants and needs WALMART
WAYFAIR
(1) NPD and Management Estimates 11C O R P O R AT E O V E R V I E W : B 2 B
Business-to-business channel: 2017 net sales of $204M
• The business-to-business channel ESTABLISHED GROUP OF B2B CUSTOMERS:
offers diverse opportunities for
growth BATH & BODY
WORKS
• Established global supplier of
DIAGEO
decorated glassware for promotions
HEINEKEN
• OEM supplier to leading appliance
NEWELL
manufacturers
STAR SOAP &
• Growing in houseware applications: CANDLE
decorated beverageware and glass
SUNBEAM
components for candles and floral
applications SYNDICATE
SALES INC.
WHIRLPOOL
12Strategy Overview
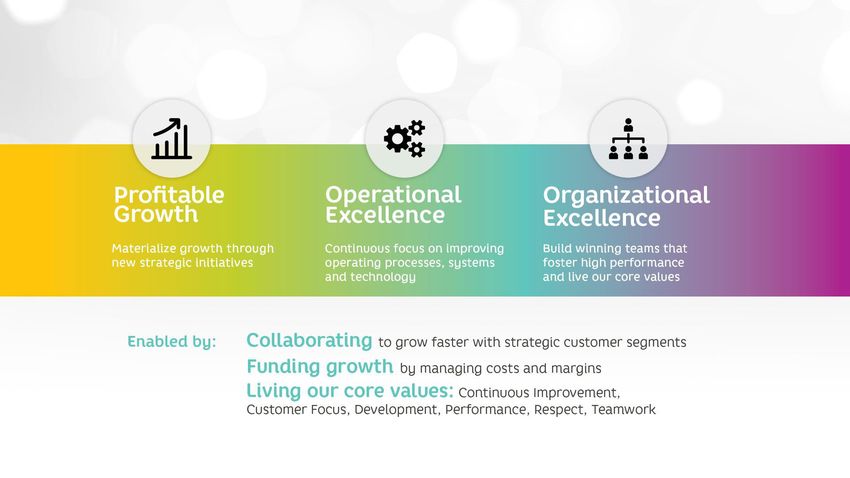
C R E AT I N G M O M E N T U M S T R AT E G Y

                                                14
NEW PRODUCT DEVELOPMENT
In 2016 we implemented efforts to build a new product
pipeline to drive profitable growth
U.S. and Canada launched 647 U.S. and Canada region has a
products in 2017 strong pipeline for next 3 years
Driving Revenue
& Margin Growth • $175M pipeline through 2020
in recent quarters
• 26 projects underway
• 450+ products launched in
2018
Sales from new products are offsetting losses from
declining markets and providing growth
15NEW PRODUCT DEVELOPMENT
Long-term goal is to have new products represent 8-9%
of annual global net sales
Global New Products % Net Sales
8.6%
8.4% • It generally takes 12-18 months to reach
8.2%
run rate…2017 launches are gaining
momentum
8.0%
7.8%
• NPD is offsetting market declines and
7.6%
providing growth in our planning
7.4%
7.2%
• Global process expansion is underway
7.0%
2018 Est. 2019 Est. 2020 Est.
New products are essential for sustainable margins and growth
16N E W P R O D U C T D E V E L O P M E N T : H E AL T H C AR E
The business of aging is becoming big
business …
% of 65+ is Growing in the U.S.
• 10,000 people a day are turning 65(1) 2014 2020 2030 2040 2050 2060
14.5% 16.8% 20.6% 21.7% 22.1% 23.6%
• By 2030, over 20% of the population will be Population by Age in
65+ years of age(2) the United States
$ in millions
500
• Baby Boomers* have 70 percent of the 400 98
nation’s disposable income and stand to 82 88 65+
56 74
300 46
Up to 64
inherit $15 trillion over the next 20 years(3)
200
278 285 306 310 319
275
• Financially, the goal is for seniors to remain 100
independent and receive the least amount of 0
2014 2020 2030 2040 2050 2060
support needed for as long as possible
*born between 1946-1964
Sources:
(1) - U.S. Census Bureau
65+ population more than 50% growth
(2) - Senior Housing News in 16 years to 74 million
(3) - MetLife/Boston College Center for Retirement Research
17N E W P R O D U C T D E V E L O P M E N T : H E AL T H C AR E
Intuitive Diningware™ line is designed to service the
specialized needs required by healthcare facilities
Six aspects are considered in the curation and design
of all products in our Intuitive Diningware collection:
Vision, Grip, Coordination, Dietary, Emotion and Safety
Libbey® Intuitive Diningware™
helps create dining experiences that are more inspiring,
accessible and dignified for all.
Our passion, perspectives and full-spectrum tableware
selection deliver insights-driven solutions that support
your success.
Fully Engage the Healthcare Market
18N E W P R O D U C T D E V E L O P M E N T : H E AL T H C AR E
Dedicated product offerings are a perfect fit for the
Healthcare market
Comfort Bowl
• Easy to grip due to raised rim
• Discreet banded edged; helps diner scoop food easily
Donna Senior Cup and Saucer
• Wider cup handles for easier grip
• Color target saucer assisting people with reduced vision
• Low well in saucer helps protect against tipping
Constellation™ Dinnerware
• Exclusive Microban® Technology1
Ergonomic Flatware
• Knob handle for those with arthritis and limited dexterity
• Shapes facilitate easier scooping and cutting function
Infinium™ Beverageware
• Non-glass, lightweight with a textured body for added grip
1 – ConstellationTM is the first-ever porcelain dinnerware with Microban® technology, which helps to minimize bacterial growth that
contributes to the presence of stains and lingering odors; applies only to bacteria that can cause stains, odors, and product degradation 19E-Commerce
E-COMMERCE
Investment is beginning to pay off
Bringing new products to market faster… at improved price
points…enhancing overall product and margin mix
E-commerce sales are increasing as a percentage of total
Example: U.S. retail sales…we expect to go from 9% in 2017 to >20% by 2021
Investments supporting sales in existing brick and mortar
outlets
Omni-Channel approach is beneficial to our customers
21Operational Excellence
O P E R AT I O N AL E X C E L L E N C E

    Current State

   Significant improvements made over the last 12 months to improve our
   Global Manufacturing Network driving improved ROIC(1)
   • We have established ourselves as the leader in servicing the customer
   • We have reduced capacity on processes in the United States where we were undersold
     and are using the available glass on processes that are sold out
   • We have improved our commercial margin profile in all regions and are adding new
     capabilities to support market needs
   • We have invested in numerous projects to improve safety, quality, delivery and cost

    (1) - see Appendix for definition of non-GAAP measure.

                                                                                           23
Financial Overview and Capital Allocation
Why Libbey? Investment Thesis
           Global Tabletop                                    Positioned for                      Improving Balance
               Leader                                        Profitable Growth                          Sheet
 •Global leader in design,                               •Best in class service to highly      •Positioned to increase Free Cash
  production and sale of tabletop                         diversified customer base             Flow(1) and continue to
  products                                                                                      deleverage the balance sheet
                                                         •Healthy pipeline of new products     •Capital allocation prioritizes
 •Strong leadership with                                  and entering new business             strategic investments and debt
  experience that is aligned to the                       segments                              reduction over returning capital
  strategy                                                                                      to shareholders
                                                         •Growing E-commerce business
 •Leading brands and market share                                                              • ABL extended
                                                         • Global Manufacturing Network        •Ability to flex spending as
                                                          that is aligned to the marketplace
 •Licensing agreements and                                                                      needed
  partnerships                                            and strategy to improve ROIC(1)
                                                                                               •Opportunity to improve Trade
                                                         •ERP will simplify go to market,       Working Capital(1)
 •Low cost production with broad                          improve productivity and enable
  distribution                                            new technology
(1) - see Appendix for definition of non-GAAP measure.

                                                                                                                                   25
F I N AN C I AL O V E R V I E W
Continuous improvement; return to long-term financial
goals by 2021
Goal 2017 Actual 2018 Est.(1) 2021 Est.(1)
$ in millions
Revenue growth 2% to 5% $782 $790 – $805 $840 - $900
(1.5%) 1%-3% 4 – year CAGR ~2-3%
Adjusted EBITDA ~14% - 15%
14% to 16% 9.0% ~10%
margins(2) $118 - $135
Net debt to
2.0x to 3.0x 5.1x 4.0x – 4.5x 2.3x - 2.7x
Adjusted EBITDA(2)
Maintain 11%
ROIC(2) 4.0% 5% - 6% 10% - 12%
to 13%
Capital
$45 - $55 $48 ~$50 $45 - $55
Expenditures
(1) - These projections are based on the Company’s organic business targets as of Q3 ‘18 and do not reflect the potential impacts of any merger, acquisition, divestiture or other corporate restructuring activity
(2) – See Appendix for non-GAAP definitions and reconciliations to nearest U.S. GAAP measure
26F I N AN C I AL O V E R V I E W
A history of reducing debt
Reducing Debt on Balance Sheet Gross Debt by Year
• Outstanding debt at its lowest levels since 500
Millions ($)
$466
$445
2006 450 $437
$413 $412
• Repaid over $55 million in debt over the 400 $388
last 3 years in order to strengthen balance
350
sheet
300
2012 2013 2014 2015 2016 2017
27F I N AN C I AL O V E R V I E W
Interest expense remains stable as debt
reduction and swap provide protection
Capital Structure
Interest Expense vs. Federal Funds Rate
• Term Loan B Millions ($) Fed Funds Rate %
30 2.00
• LIBOR plus 300 bps (currently 5.1%) 25 $23
$21 $20
• Maturity 2021 20
$18 1.50
• No financial covenants 15 1.00
• $150MM accordion option 10
0.50
5
0 0.00
• Interest Rate Swaps 2014 2015 2016 2017
• Providing interest protection in a rising
rate environment
• $100MM ABL Credit Facility
• $220MM fixed at 4.8575%(1) through
• LIBOR plus 150-200 bps
early 2020
• Maturity 2022
• $200MM fixed at 6.19%(1) 2020
through 2025
(1) – The swap interest rates are calculated using the current credit spread of 300bps on the Term Loan B. This credit spread is
subject to change when the current debt is refinanced. 28Thank you for your interest in Libbey
• Our next communication will be Q4 earnings in
late February
• This presentation is available on our website
29Appendix
T H I R D Q U AR T E R R E S U L T S
2018 Third-quarter Highlights
New products drove approximately $15.9MM of
sales, or 8.3% of net sales
Third Quarter E-commerce sales represented approximately
12.0% of total U.S. & Canada retail sales; an
2018 increase of 46% versus prior year
($ in millions)
U.S. & Canada foodservice continues to
Net Sales $190.8 outperform the market in 2018; 4.7% sales growth
Y-O-Y Change 1.8 %
Y-O-Y Constant Currency 2.9%
versus declining traffic of (1.3%)1 during the
quarter, attributed to high level of customer service
Adjusted EBITDA2 $16.1 Latin America and EMEA improved profitability for
Y-O-Y Change (19.6 %) fifth consecutive quarter
Y-O-Y Constant Currency (5.0%)
Sales up 13% in our Other segment (Asia Pacific
region) where segment EBIT margin improved from
(25%) to 13%
(1) Source: Black Box
(2) See our third-quarter 2018 press release filed on form 8-K on November 6, 2018, for reconciliations of Adjusted EBITDA to the most directly 31
comparable U.S. GAAP measure.T H I R D Q U AR T E R R E S U L T S
Key Financial Data
Third Quarter ‘18 & ‘17
Unaudited Third Quarter Year-to-Date
$ in millions, except per share data '18 '17 VPY '18 '17 VPY
Net sales $ 190.8 $ 187.3 $ 3.5 $ 586.2 $ 557.8 $ 28.4
Gross profit $ 37.2 $ 38.0 $ (0.8) $ 117.4 $ 110.6 $ 6.8
Gross profit margin 19.5% 20.3% (0.8%) 20.0% 19.8% 0.2%
Selling, general & administrative expenses $ 33.3 $ 29.5 $ 3.8 $ 98.4 $ 96.9 $ 1.5
Net income (loss) $ (5.0) $ (78.8) $ 73.8 $ (3.9) $ (86.2) $ 82.3
Net income (loss) margin (2.6%) (42.1%) 39.5% (0.7%) (15.5%) 14.8%
Diluted EPS $ (0.22) $ (3.57) $ 3.35 $ (0.18) $ (3.92) $ 3.74
Adjusted EBITDA (1) (non-GAAP) $ 16.1 $ 20.0 $ (3.9) $ 54.8 $ 46.4 $ 8.4
(1)
Adjusted EBITDA margin (non-GAAP) 8.4% 10.7% (2.3%) 9.3% 8.3% 1.0%
Unaudited September December September
$ in millions, except ratio 30, 2018 31, 2017 30, 2017
(1)
Trade Working Capital (non-GAAP) $ 228.7 $ 199.5 $ 215.6
Debt, net of cash to Adjusted EBITDA ratio (1) (non-GAAP) 5.0 x 5.1 x 5.5 x
(1) See the Appendix for reconciliations and definitions of non-GAAP measures.
32T H I R D Q U AR T E R R E S U L T S
Q3 2018 Net Sales of $190.8 vs. $187.3 in Q3 2017
$ in millions
U.S. & Canada Latin America
$40
$116 $0.4 $115.3
$2.6
$1.1 ( $0.6) ( $0.4)
$35.3 $35.4
$114
$35
$112.3 $0.0
$112
$110 $30
Q3 '17 Net Retail Foodservice B2B Q3 '18 Net Q3 '17 Net Retail Foodservice B2B Q3 '18 Net
Sales Sales Sales Sales
EMEA Other
$40 $10
$35 $33.7 ( $0.5) $0.4 ( $0.3) $33.3 $8 $0.8 $6.8
$6.0
$30 $6
$4
$25
$2
$20
Q3 '17 Net Retail Foodservice B2B Q3 '18 Net $0
Sales Sales Q3 '17 Net Sales Sales Increase Q3 '18 Net Sales
33T H I R D Q U AR T E R R E S U L T S
YTD 2018 Net Sales of $586.2 vs. $557.8 in YTD 2017
$ in millions
U.S. & Canada Latin America
$360 $115
$355 $3.5 $110.0
$3.5 $351.7 $110
$350 $4.0 ( $0.1)
$4.0
$0.7 $105
$345 $343.5 $102.6
$340 $100
Q3 '17 YTD Retail Foodservice B2B Q3 '18 YTD Q3 '17 YTD Retail Foodservice B2B Q3 '18 YTD
Net Sales Net Sales Net Sales Net Sales
EMEA $103.7
Other
$105 $5.1 $25
$100 $3.6 $21.7 (0.9)
$20.8
$4.9
$95 $20
$90.1
$90
$85
Q3 '17 YTD Retail Foodservice B2B Q3 '18 YTD
$15
Q3 '17 YTD Net Sales Sales Decline Q3 '18 YTD Net Sales
Net Sales Net Sales
34T H I R D Q U AR T E R R E S U L T S
Adjusted EBITDA(1) Walk
$ in millions
30.0 Q3 '18 QTD Adjusted EBITDA vs. Prior Year $MM
25.0 $4.5 ($2.9)
$20.0 ($4.3)
20.0
($1.1)
($0.1) $16.1
15.0 Store and Ship ($2.4MM)
Downtime ($1.4MM)
10.0
Prior Year Impact of Sales/ FCM Currency Operating Activity Benefits Other Adjusted EBITDA
Q3 '18 YTD Adjusted EBITDA vs. Prior Year $MM
$65.0 $2.2 ($10.1)
$15.0
$3.0 $54.8
$55.0 ($1.7)
$46.4
$45.0 Downtime ($3.9MM) Reduced E-commerce
Store and Ship ($3.5MM) spend $4.4MM
$35.0
Prior Year Impact of Sales/ FCM Currency Operating Activity Benefits Other Adjusted EBITDA
(1) - See the Appendix for a reconciliation of Adjusted EBITDA to net income (loss).
35Definition and reconciliation of non-GAAP measures
Reconciliation of Net Income (Loss) to Adjusted Earnings Before Interest, Taxes, Depreciation and Amortization (Adjusted EBITDA) and Adjusted EBITDA Margin
(Dollars in millions)
Q3 2018 Q3 2017 FY 2017 FY 2016 FY 2015 FY 2014 FY 2013 FY 2012 FY 2011 FY 2010
Net income (loss) (U.S. GAAP) $ (5.0) $ (78.8) $ (93.4) $ 10.1 $ 66.3 $ 5.0 $ 28.5 $ 7.0 $ 23.6 $ 70.1
Add:
Interest expense $ 5.7 $ 5.1 $ 20.4 $ 20.9 $ 18.5 $ 22.9 $ 32.0 $ 37.7 $ 43.4 $ 45.2
Provision (benefit) for income taxes 1.8 2.7 15.8 17.7 (38.2) 8.5 13.2 5.7 1.7 11.6
Depreciation and amortization 11.3 11.2 45.5 48.5 42.7 40.4 44.0 41.5 42.2 41.1
Add: Special items before interest and taxes:
Restructuring and facility closure charges - - - - - 1.0 6.5 - (0.1) 2.5
Severance - - - - - - - 5.1 1.1 -
Pension curtailment and settlement charges - - - 0.2 21.7 0.8 2.3 4.3 - -
Loss (gain) on redemption of debt - - - - - 47.2 2.5 31.1 2.8 (58.3)
Abandoned property - - - - - - 1.8 - 2.7 -
Gain on sale of assets - - - - - - - - (6.8) -
Goodwill and intangible impairment charges - 79.7 79.7 - - - - - - -
Product portfolio optimization - - - 5.7 - - - - - -
Other (1) 2.3 - 2.5 8.5 5.3 (3.5) 5.1 - 2.5 2.8
Less: Accelerated depreciation expense included in special items
and also in depreciation and amortization above - - - - - - (1.5) - - -
Adjusted EBITDA (non-GAAP) $ 16.1 $ 20.0 $ 70.6 $ 111.6 $ 116.3 $ 122.1 $ 134.4 $ 132.4 $ 113.1 $ 115.0
$ 119.2
Net sales $ 190.8 $ 187.3 $ 781.8 $ 793.4 $ 822.3 $ 852.5 $ 818.8 $ 825.3 $ 817.1 $ 799.8
Net income (loss) margin (U.S. GAAP) -2.6% -42.1% (11.9%) 1.3% 8.1% 0.6% 3.5% 0.8% 2.9% 8.8%
Adjusted EBITDA Margin (non-GAAP) 8.4% 10.7% 9.0% 14.1% 14.1% 14.3% 16.4% 16.0% 13.8% 14.4%
(1) Q3 2018 includes $2.3 million for legal and professional fees associated with a strategic initiative. 2017 includes $2.5 million for reorganization charges. 2016 includes $4.1 million for work stoppage and
$4.4 million for executive terminations. 2015 includes $4.2 million for reorganization charges, $0.9 million for executive termination, and $0.2 million for an environmental obligation. 2014 includes $(4.7) million
for furnace malfunction net proceeds, $0.9 million for executive retirement charges, and $0.3 million for an environmental obligation. 2013 includes $4.4 million of furnace malfunction charges and $0.7 million
for executive retirement charges. 2011 includes $2.7 million for CEO transition expenses, $(1.0) million for an equipment credit and an $0.8 million write-down of unutilized fixed assets. 2010 includes $2.7
million of fixed asset write-down charges, $1.0 million in expenses related to a secondary stock offering and a $(0.9) million insurance claim recovery. 2008 includes a $4.5 million fixed asset write-down
Adjusted EBITDA excludes special items that Libbey believes are not reflective of our core operating performance.Definition and reconciliation of non-GAAP measures
Computation of Adjusted EBITDA to Debt net of cash to Adjusted EBITDA Ratio and Adjusted EBITDA
(Dollars in millions)
LTM Q3 LTM Q3
2018 2017 FY 2017 FY 2016 FY 2015 FY 2014 FY 2013 FY 2012 FY 2011 FY 2010
(1)
Adjusted EBITDA (non-GAAP) $ 78.9 $ 69.9 $ 70.6 $ 111.6 $ 116.3 $ 122.1 $ 134.4 $ 132.4 $ 113.1 $ 115.0
Debt reported on balance sheet(2) (U.S. GAAP) $ 410.7 $ 398.9 $ 384.4 $ 407.8 $ 431.0 $ 437.9 $ 402.4 $ 454.2 $ 390.1 $ 436.6
Plus: Unamortized discount, finance fees and warrants (2) 2.6 3.6 3.3 4.5 5.8 7.0 9.5 12.3 11.6 16.9
Less: Carrying value in excess of principal on PIK notes - - - - - - - - - -
Less: Carrying value adjustment on debt related to the Interest
Rate Agreement - - - - - - (1.3) 0.4 4.1 3.3
Gross Debt 413.3 402.5 387.7 412.3 436.9 444.9 413.2 466.1 397.6 450.2
Less: Cash and cash equivalents 19.1 21.6 24.7 61.0 49.0 60.0 42.2 67.2 58.3 76.3
Debt net of cash $ 394.2 $ 380.9 $ 363.0 $ 351.3 $ 387.9 $ 384.9 $ 371.0 $ 398.9 $ 339.3 $ 373.9
Debt net of cash to Adjusted EBITDA Ratio (non-GAAP) 5.0 5.5 5.1 3.1 3.3 3.2 2.8 3.0 3.0 3.3
(1) - See prior page for calculation and reconciliation to net income.
(2) - All years reflect retrospective adoption of ASU 2015-03 and 2015-15, which presents debt issuance costs of senior debt as a reduction to the liability.Definition and reconciliation of non-GAAP measures
Calculation of Return on Invested Capital (ROIC) Definitions – Other Non-GAAP Measures
(dollars in millions)
FY 2017 Trade Working Capital is defined as net accounts receivable plus net inventory less
Reported income from operations $ (53.7) accounts payable.
Add: Adjustments Return On Invested Capital (ROIC) is defined as after tax income from operations
Goodwill Impairment $ 79.7 (using a 35% tax rate), adjusted for special items, over ending Trade Working
Reorganization/ Restructuring Charges 2.5 Capital plus net book value of property, plant and equipment
Adjusted income from operations 28.5 Constant currency references regarding net sales reflect a simple mathematical
Factor to apply taxes 65% translation of local currency results using the comparable prior period’s currency
After tax adjusted income from operations $ 18.5 conversion rate. Constant currency references regarding Segment EBIT, Adjusted
EBITDA and Adjusted EBITDA Margin comprise a simple mathematical translation
of local currency results using the comparable prior period’s currency conversion
Reported property, plant and equipment, net $ 265.7 rate plus the transactional impact of changes in exchange rates from revenues,
expenses and assets and liabilities that are denominated in a currency other than
Accounts receivable 90.0 the functional currency. Our currency market risks include currency fluctuations
Inventories 187.9 relative to the U.S. dollar, Canadian dollar, Mexican peso, euro and RMB.
Less: Accounts payable 78.3
Reported Trade Working Capital $ 199.5 Free Cash Flow is defined as net cash provided by operating activities plus net
cash provided by (used in) investing activities.
Total Invested Capital $ 465.2
ROIC 4.0%Disclaimer
This presentation is being shared by Libbey Inc. (the “Company”) for informational purposes only and is not, and may not be relied on in any manner as, legal, tax, investment,
accounting or other advice. This presentation contains forward-looking statements within the meaning of Section 27A of the Securities Act, Section 21E of the Securities Exchange
Act of 1934 and the Private Securities Litigation (Reform Act of 1995, that involve a number of risks and uncertainties. These statements relate to future events, the Company’s
future financial performance with respect to the Company’s financial condition, results of operations, business plans and strategies, operating efficiencies or synergies, competitive
positions, growth opportunities for existing products, plans and objectives of the Company’s management, capital expenditures and other matters. These statements involve known
and unknown risks, significant uncertainties and other factors (many of which are beyond the control of the Company) that may cause the Company or the Company’s industry’s
actual results, levels of activity, performance or achievements to be materially different from those expressed or implied by any forward-looking statements. In some cases, you can
identify forward-looking statements by terminology such as “may”, “will,” “could,” “would,” “should,” “expect,” “plan,” “anticipate,” “intend,” “believe,” “estimate,” “predict,”
“potential,” “pro forma,” “seek” or “continue” or the negative of those terms or other comparable terminology. These statements are only predictions and actual results may differ
from predictions and such differences may be material. Any forward-looking statements that we make in this presentation speak only as of the date this presentation is given, and
we undertake no obligation to update such statements. Comparisons of results for current and any prior periods are not intended to express any future trends or indications of
future performance, unless expressed as such, and should only be viewed as historical data.
Although we base these forward-looking statements on assumptions that we believe are reasonable when made, we caution you that forward-looking statements are not
guarantees of future performance and that our actual results of operations, financial condition, liquidity, prospects, growth, strategies, position in the market and the development
of the industry in which we operate may differ materially from those described in or suggested by the forward-looking statements contained in this presentation. In addition, even if
our results of operations, financial condition, liquidity, prospects, growth, strategies, position in the market and the development of the industry in which we operate are consistent
with the forward-looking statements contained in this presentation, those results or developments may not be indicative of results or developments in subsequent periods. Given
these risks and uncertainties, you are cautioned not to place undue reliance on these forward-looking statements.
The Company advises you that in the normal course of its business it evaluates potential strategic opportunities that may be available from time to time, including acquisitions,
dispositions, mergers, private equity financings and other corporate transactions. The Company’s evaluation of such opportunities may involve discussions and negotiations with
interested parties concerning the proposed terms and conditions of a potential transaction. As a matter of policy, the Company does not comment on such matters unless
negotiations with interested parties have advanced to the point where they would be material to a reasonable investor and the Company is legally obligated to disclose such
negotiations.
This presentation and today’s prepared remarks contain non-GAAP financial measures. We believe that the Adjusted Earnings Before Interest Taxes Depreciation and Amortization,
or Adjusted EBITDA; Adjusted EBITDA margin; Adjusted Selling, General & Administrative Expense (Adjusted SG&A); Trade Working Capital; Debt, net of cash to Adjusted EBITDA; and
references to sales in constant currency are meaningful measures for investors to compare our results from period to period. Reconciliations of the non-GAAP to GAAP measures
may be found in the Appendix of this presentation as well as in the earnings press release and the supplemental financials.
This presentation also contains estimates and other statistical data made by independent parties and by the Company relating to market size and growth and other industry data.
These data involve a number of assumptions and limitations, and you are cautioned not to give undue weight to such estimates. The Company has not independently verified the
statistical and other industry data generated by independent parties and contained in this presentation and, accordingly, it cannot guarantee their accuracy or completeness. In
addition, projections, assumptions and estimates of its future performance and the future performance of the industries in which it operates are necessarily subject to a high degree
of uncertainty and risk due to a variety of factors.
You can also read