Investor Update July 2021 TSX : SES | secure-energy.com
←
→
Page content transcription
If your browser does not render page correctly, please read the page content below
July 2021

Investor Update
TSX : SES | secure-energy.com
SECURE ENERGY Overview
                                                                                                                                     Delivering customer-focused solutions to Energy and Industrial companies
                                                                                                                                     across Western Canada and the U.S.
      308.1                                         $1.3                                       $419                                  » Recent Tervita merger creates a stronger midstream infrastructure and
 Common Shares                                    Market                                   2020 Adjusted                               environmental solutions business; expected to provide enhanced free
   Outstanding                                 Capitalization                                 EBITDA                                   cash flow generation resulting from greater scale and significant
   (millions )(1)                               (billions)(2)                               (millions)(5,6)
                                                                                                                                       annual integration cost savings of at least $75 million
                                                                                                                                     » The two main operating business segments are:
                                                                                                                                                  Midstream Infrastructure:
       ~1%                                          $2.7                                      >$200                                                • Oil and water midstream processing facilities
   Dividend Yield                           Enterprise Value                                   2020
                                                                                                                                                   • Oil and water gathering pipelines
                                             (billions)(1,2,3)                             Discretionary
                                                                                          Free Cash Flow                                           • Storage tanks and crude oil marketing
                                                                                           (millions)(5,6)                                        Environmental Solutions:
                                                                                                                                                   • Network of industrial landfill disposal sites
                                                                                                                                                   • Onsite abandonment, remediation and reclamation management
       $0.03                                         2.9x                                        19%                                               • Drilling, completion and production fluid operations management
     Annualized                                                                           Discretionary
    Dividend per                            Total Debt /
                                            Adj. EBITDA(3,5,6)
                                                                                         Free Cash Flow                              » Strong management team with a proven track record since inception
        Share                                                                               Yield (1,2,4)                              in 2007, founded on principles of environmentally responsible
                                                                                                                                       solutions
(1) Common shares outstanding as at June 29, 2021. For Pro Forma the Tervita transaction which closed on July 2, 2021, an exchange ratio of 1.2757 has been applied to Tervita’s
outstanding shares as per the arrangement agreement.                                                                                                                                      (5) Refer to Non-GAAP Measures.
(2) Based on SECURE’s closing share price on June 29, 2021 of $4.28 per share                                                                                                             (6) Pro forma the Tervita transaction and inclusive of annual expected integration cost savings of at least $75 million.
(3) Pro forma the Tervita transaction, based on outstanding debt as at March 31, 2021.
(4) Calculated as 2020 Pro Forma Discretionary Free Cash Flow as a percentage of market capitalization utilizing SECURE’s closing share price on the TSX as at June 29, 2021 . Refer to
Non-GAAP measures.

                                                                                                                                                                                                                                                                                                               2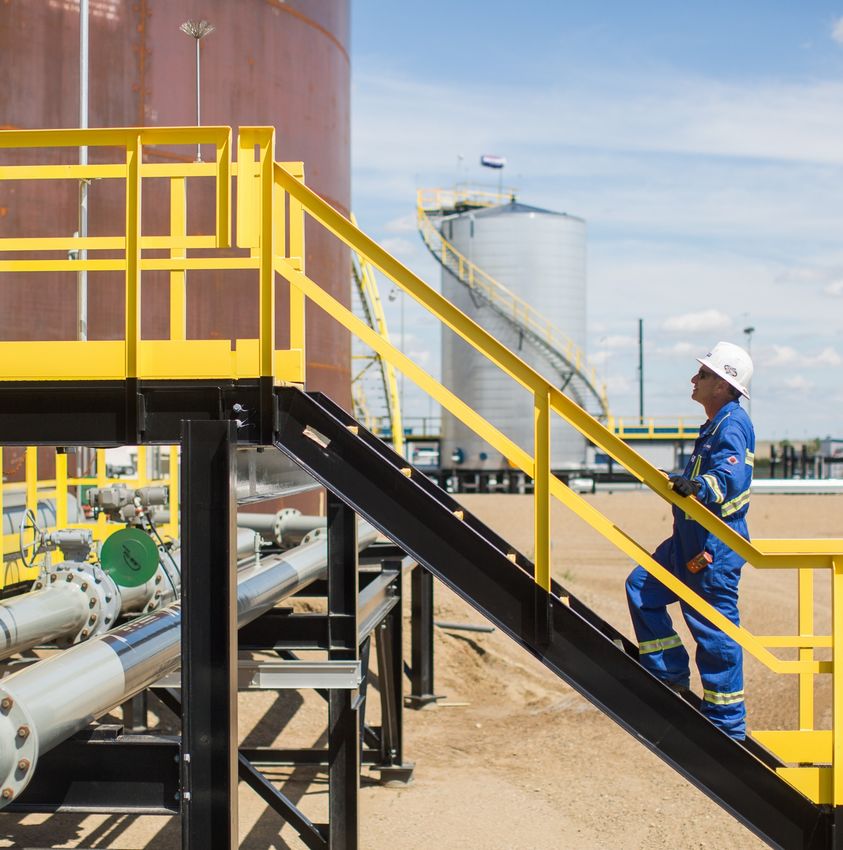
SECURE Energy and Tervita Merger Closed July 2, 2021
Creates Stronger Midstream Infrastructure and Environmental Solutions Business

                                         Highly complementary assets that provide enhanced scale, utilization, efficiencies
                                 1
                                         and geographic coverage
                                         Stronger, cost-effective infrastructure supports consolidating customer base,
                                  2      providing enhanced services to customers, and supporting increased
                                         commitments to achieving ESG goals

       +                          3
                                         Significant annualized integration cost savings of at least $75 million expected to
                                         be realizable within 12 to 18 months after closing

                                         Expected to be immediately accretive to cash flow and discretionary free cash
                                  4
                                         flow per share for all shareholders

                                  5       Significant discretionary free cash flow to direct towards debt repayment

                                     6    Increased trading liquidity and improved access to lower cost of capital

                                                                                                                               3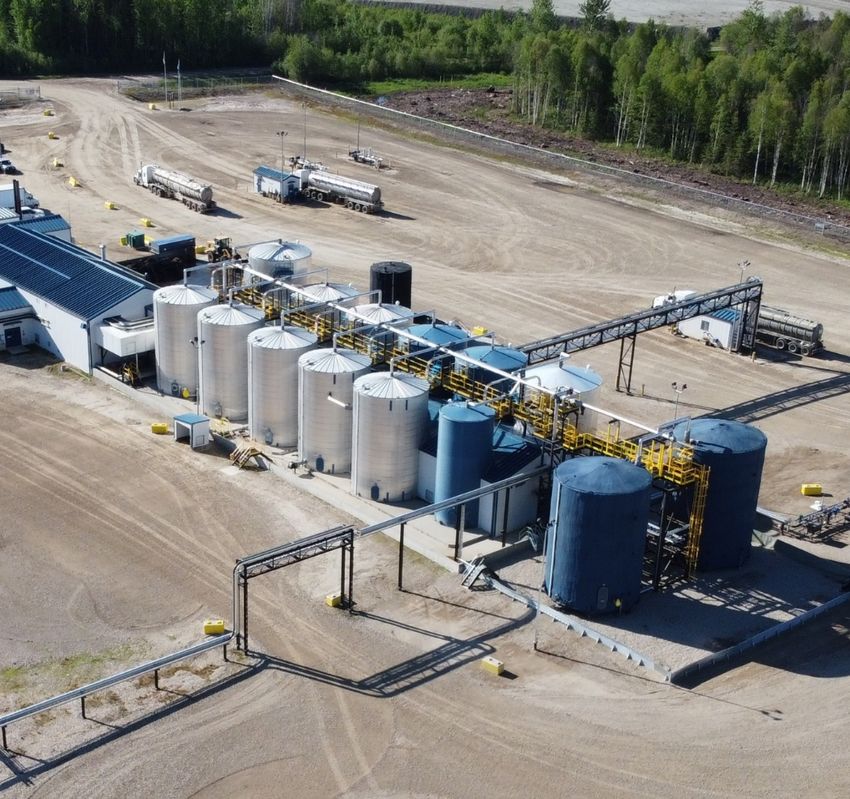
Significant Value Creation Opportunity From Integration
Cost Savings
        Operational Efficiencies
                                                                        Corporate
    • Optimize pro forma operations
      through facility utilization,                                     Overhead
      reduced field overhead, field                                       40%
      office closures, transportation
      savings and operating cost
      efficiencies

                                                  ~$75 Million
                                               Annualized Expected
                                                  Cost Savings
                           Operational
                                                                                          Corporate Overhead
                          Optimizations
                              60%                                                 • Reduce costs by combining public
                                                                                    company, board, executive,
                                                                                    administration, legal, IT systems, HR
                                                                                    and corporate development
                                                                                  • Eliminate one corporate head office
                                                                                  • Utilize best-in-class practices to drive
                                                                                    efficiency across all business units

  Annual Expected Integration Cost Savings Of At Least $75 Million Realizable In 12 To 18 Months After Closing

                                                                                                                               4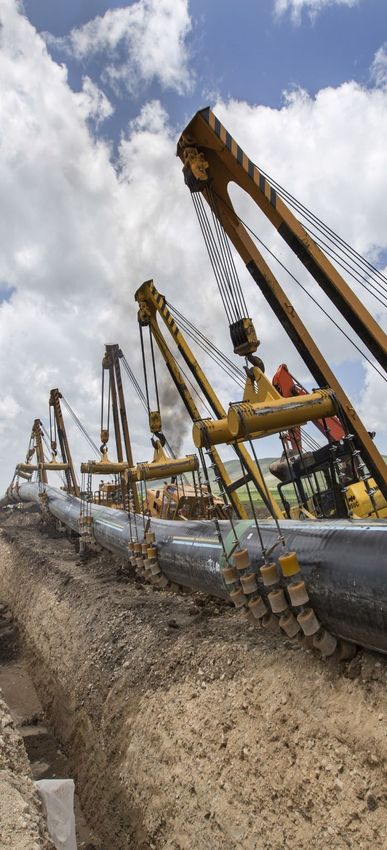
The Combination Enhances Capital Markets Relevance
                            Combined market                                                                       Pro forma annual EBITDA                             Pro forma annual free cash
                          capitalization of $1.3                                                                  of $419 million, including                            flow of >$200 million,
                         billion(1) and enterprise                                                                  expected annual cost                              including expected annual
                          value of $2.7 billion(1)                                                                        savings                                            cost savings

                                                                                                    Select Infrastructure and Energy Services Companies
                     Enterprise Value                (1)
                                                                                                                          2020 Adjusted EBITDA (2)                                2020 Free Cash Flow (3)
  ($MM)                                                                                                  ($MM)                                                        ($MM)

  $5,000

                                                                                                          $500                                                        $300
                                                                                                                                                                                  Pro forma FCF yield of ~19% (4)
  $4,000
                                                                                                                                                                                     (including cost savings)
                                                                                                          $400
  $3,000                                                                                                                                                              $200
                                                                                                          $300

  $2,000                                                                                                  $200
                                                                                                                                                                      $100

  $1,000                                                                                                  $100

                                                                                                                  -                                                       -
          -

                                                                                        SECURE                                  Annualized Integration Cost Savings

  1.   Market capitalizations based on share prices as at June 29, 2021 and net debt as at December 31, 2020 as per FactSet.
  2.   As per FactSet.
  3.   Free cash flow defined as cash flow from operations less capital expenditures as per FactSet
  4.   Free cash flow yield calculated as free cash flow divided by market capitalization, utilizing SECURE’s closing share price on the TSX as at June 29, 2021.

                                                Combination Expected to Materially Increase EBITDA And Free Cash Flow                                                                                               5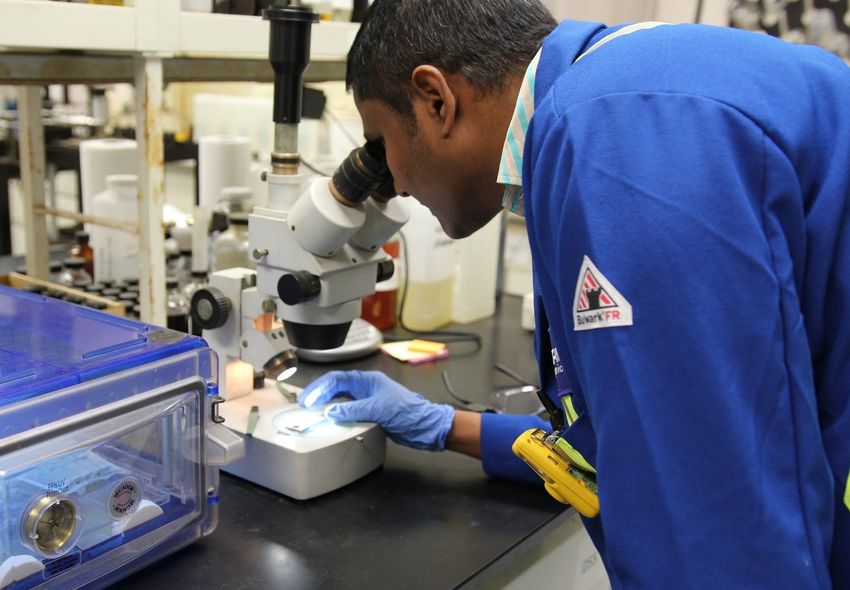
Broad Geographic Asset Coverage in Western Canada

                                                    6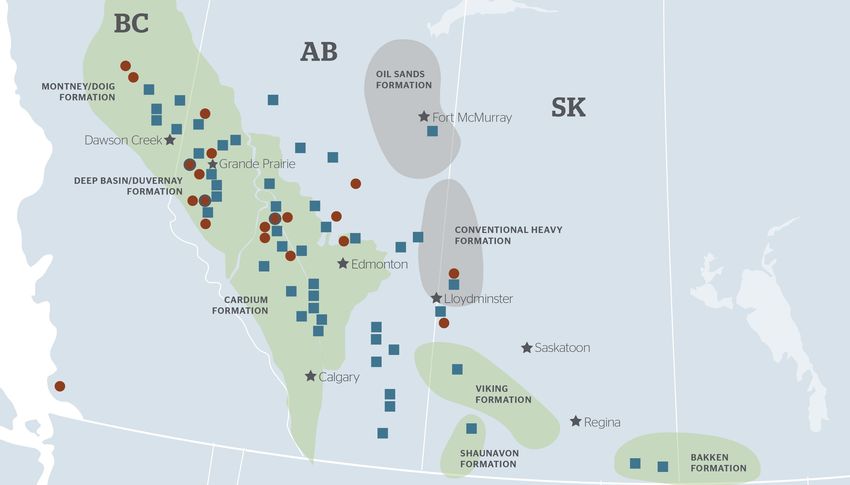
Leadership and Governance
                   Grant Billing                                              Rene Amirault                                           Allen Gransch                                            Chad Magus

                   Chairman of the Board                                      Chief Executive Officer                                 Chief Operating Officer                                  Chief Financial Officer
                                                                              and Director
                   Previously Tervita’s                                                                                               SECURE EVP & Officer                                     SECURE CFO since
                   Chairman of the Board                                      SECURE President &                                      since 2012                                               2017
                   since 2016                                                 CEO since 2007                                          SECURE employee since                                    SECURE employee since
                                                                              SECURE director and                                     2007                                                     2014
                                                                              Chairman since 2007

BOARD OF DIRECTORS
                                                                                                             Kevin Nugent    Director of Hifi Engineering Inc., VentMeter technologies Inc.,
   Rene Amirault See above
                                                                                                                             RGL Reservoir Management Inc.

     Grant Billing Chairman of Cortex Business Solutions Inc. and a director of
                                                                                                        Susan Riddell Rose   President and CEO of Perpetual Energy Inc., and director of
       Chairman Badger Daylighting
                                                                                                                             Perpetual Energy Inc. and Paramount Resources Ltd.
                   Previously Chairman and CEO of Superior Plus
                                                                                                                             Previously director of Tervita Corporation
                   Previously Chairman of Tervita Corporation
                                                                                                             Jay Thornton    Previously director of Tervita Corporation
                                                                                                                             Chairman of Obsidian Energy Ltd. and director of North
Michael Colodner Managing Director of Solus Alternative Asset Management LP
                                                                                                                             American Energy Partners Inc.
                   Previously director of Tervita Corporation
                                                                                                                             Previously an executive of Shell and Suncor

     Brad Munro President and CEO of Bittercreek Capital Corporation                                     Deanna Zumwalt      CFO of Coril Holdings Ltd.

                   Lead Director of SECURE since 2020                                                                        Previously VP, Energy Marketing at Nexen Energy ULC

                               Proven Management Team And Board, Reflecting The Strengths And Capabilities Of Both Organizations

                                                                                                                                                                                               7
                                                                                                                                                                                                                         7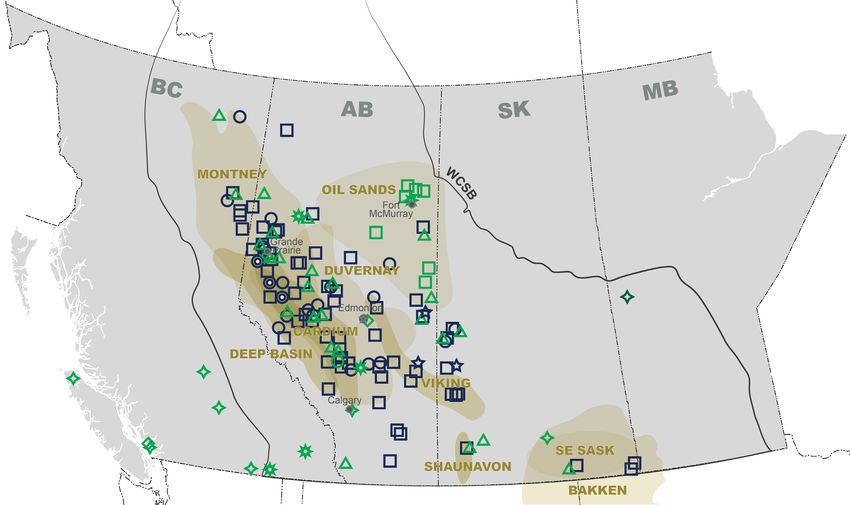
Key Strategic Priorities
SECURE’s key priorities for 2021 are to:
» Drive towards estimated annual cost savings of at least $75
  million expected to be realized within 12 to 18 months after
  closing
» Continued focus on the health and safety of our people and
  our communities
» Drive increased discretionary free cash flow and pay down
  debt, optimize capital structure of go forward business
» Progress sustainability initiatives to reduce the environmental
  impact of our operations and positively contribute to the
  health, safety and economic wellbeing of our employees and
  communities
» Continue working with our customers to deliver improved and
  more innovative midstream and environmental solutions that
  reduce their costs, lower emissions, and improve safety

                                                                    8
Commitment to ESG Leadership

                               9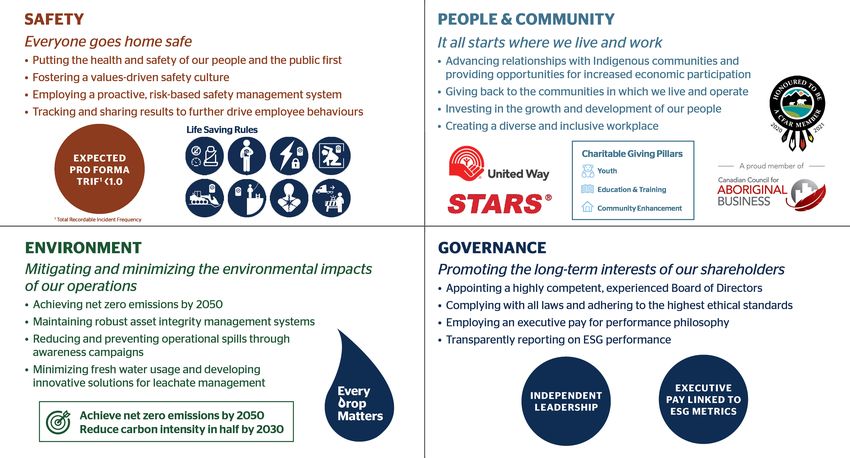
SECURE 2020 Annual Sustainability Highlights
Delivering on our key commitments to sustainability
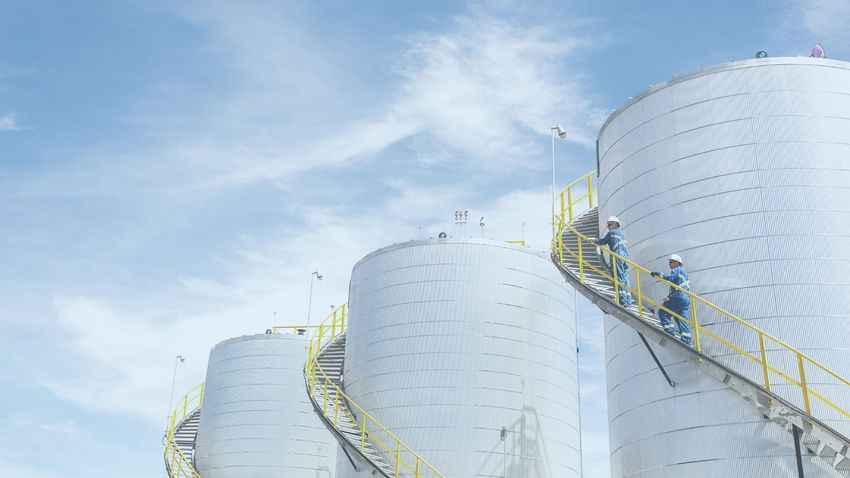
10Midstream Infrastructure
Strategically located midstream processing facilities and pipelines in high impact resource plays
11East Kaybob Oil Pipeline ESG Highlights
Pipelines provide capital efficient transportation, eliminating trucking constraints and reducing CO2 emissions
» Aggregating volumes from multiple producers reduces
infrastructure redundancy, lowering overall cost and
environmental impact
» Over 12,000 truck loads displaced annually based on initial
pipeline usage
• Reduces emissions by nearly 15,000 tonnes CO2e
• Eliminating the need to haul crude by truck increases
road safety for all users
» Over 235,000 man hours spent on the project with zero lost
time incidents
» Horizontal directional drilling utilized for pipeline installation
to reduce impact to wetlands and existing infrastructure
» State of the art leak detection system deployed to reduce
risk of environmental disaster in remote areas
» ~$7 million spend with Aboriginal vendors
» Represents 11% of the total project spend
Newly pipeline-connected Kaybob Full Service Terminal
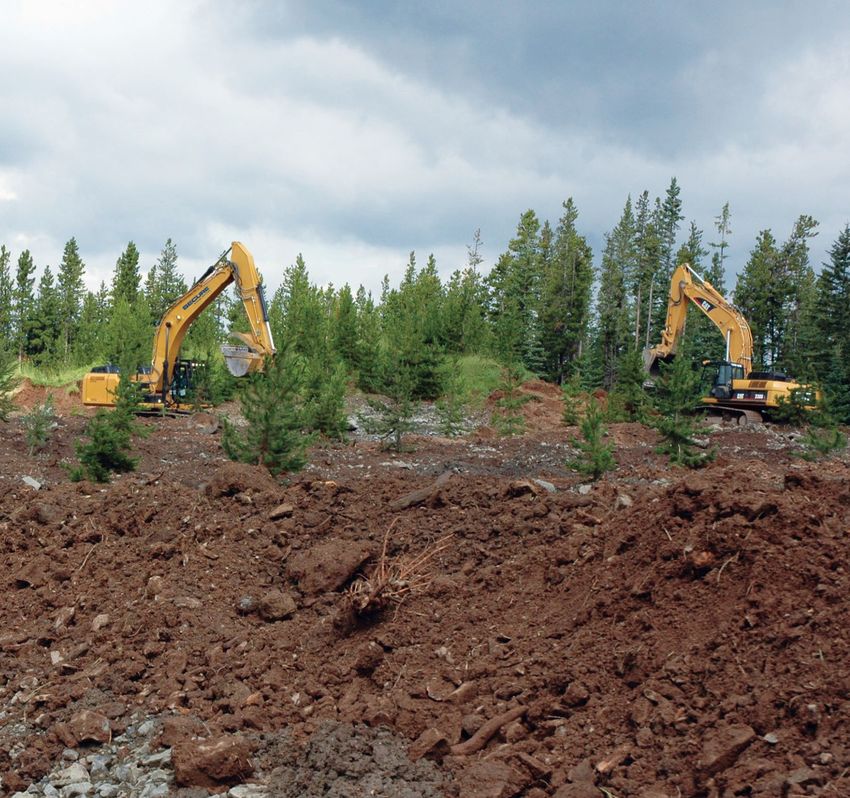
12Environmental Solutions
Offering a full suite of solutions utilizing expanded network of facilities to provide customers with environmental
and waste management solutions delivered with world-class ESG standards
» Offering landfill disposal and a full suite of solutions
including onsite abandonment, decommissioning,
remediation and reclamation
» Metals recycling service purchases and resells metals
collected from demolition sites, operating oil production
mines and industrial facilities
» Long-term contracts with three oil sands producers in
the Fort McMurray area
» Specialized mobile heavy equipment provides services to
rail connected facilities
» Customer recognized safety excellence
Remediation and Reclamation Project in Alberta
13Fluid Management
PRODUCTION & STIMULATION COMPLETIONS
» Industry leading products: flow assurance, asset » Storage water tanks
integrity, production optimization and stimulation » Water management and recycling solutions
fluids » Completion fluids
» Over 350 fully formulated proprietary products
» Creating new products in our research labs
» Leveraging midstream customer base to accelerate
market share growth
» Provides recurring revenue stream
DRILLING
» Multiple patents, innovative chemical solutions,
customized drilling fluid programs
» Technical expertise in long and deep horizontal
wells drilling fluid systems
» Fleet of “large bowl” solids control equipment
matched with drilling fluid programs
Production Chemicals Lab in Edmonton, Alberta
14SECURE and Tervita Quarterly Financial Results
Current quarter benefited from stable cash flows provided by contracted volumes and cost reductions since the first
quarter of 2020
(1)
Adjusted EBITDA per Quarter
» Stable cash flows across the past five quarters, except for Q2
$100 2020, which was the most heavily impacted by the COVID 19
pandemic and the challenging oil price environment
$80
» As the impact of the Canadian Emergency Wage Subsidy has
$60
decreased, activity in our markets has increased resulting in
($ MM)
stabilizing and improved AEBITDA
$40
$20
$0
Q1 2020 Q2 2020 Q3 2020 Q4 2020 Q1 2021
SECURE Tervita
Excluding any integration cost saving adjustments
(1) Refer to Non-GAAP Measures for SECURE Energy and Tervita.
15Strong Free Cash Flow Profile Combined With Sound Capital
Allocation Decisions
Capital Allocation Principles / Priorities
Expected to achieve debt to EBITDA target ratio ofDiscretionary Free Cash Flow
Discretionary free cash flow (1) generation for debt reduction, growth, and returns to stakeholders
Trailing Four Quarters
SECURE Energy
$30 $120
$25 $100
» Generating discretionary free cash flow (DFCF) in
Cumulative Trailing
excess of the quarterly dividend and capital growth
Quarterly ($ MM)
$20 $80
program. Prioritizing debt repayment in 2021, driven
$15 $60
by:
$10 $40
$5 $20 • Higher Adjusted EBITDA from increasing activity levels
and full run rate of cost reductions taken in April 2020
$0 $0
Q2 2020 Q3 2020 Q4 2020 Q1 2021
• Quarterly dividend of $0.0075 per share(2)
Discretionary FCF Growth Capital Dividends TTMCumulativeDFCF
• Capital program of less than $20 million
Tervita
$50 $100
Quarterly ($ MM)
Cumulative Trailing
$40 $80
$30 $60
$20 $40
$10 $20
$0 $0
Q2 2020 Q3 2020 Q4 2020 Q1 2021
Discretionary FCF Growth Capital TTMCumulativeDFCF
(1) Discretionary free cash flow is a non-GAAP measure. Calculated by SECURE as net cash flows from operating activities before changes in non-cash working capital less sustaining capital and lease payments. Calculated by Tervita as funds from
operations, less cash spent on maintenance capital and payment of principal portion of lease liabilities, plus cash proceeds on the sale of long-lived assets and sublease payments received. Refer to Non-GAAP Measures.
(2) Dividends of SECURE are subject to approval by the board of directors.
17Stronger Financial Position Long-Term Debt Maturities (C$M)(3)
900
» No near-term maturities and significant liquidity:
• C$800M revolving credit facility capacity 800
• US$400M senior secured notes due 2025 (post US$100M
redemption that has been announced) 700
• C$200M unsecured notes due 2026
• C$30M LC facility guaranteed by Export Development Canada 600
» Near-term focus will be on paying down debt – target 2.5X Total 500
Debt to EBITDA by mid-2023
» Corporate credit rating received from S&P of ‘B’ with a positive 400
outlook following the merger announcement with Tervita
300
» Senior Unsecured Notes indicative ratings of ‘B’ from S&P and ‘B+’
from Fitch
200
» Covenants as at March 31, 2021:
100
SECURE Pro Forma (1) Covenant (2)
Senior Debt to EBITDA 2.1 1.4 2.75 0
2021-2023 2024 2025 2026
Total Debt to EBITDA 3.0 2.9 4.5 Total Credit Facility Capacity 2025 Senior Secured Notes (11%)
Interest Coverage Ratio 6.5 4.5 2.5 2026 Unsecured Notes (7.25%)
(1) Includes at least $75 million of integration cost savings.
(2) Senior Debt to EBITDA covenant is 3.0x and the Total Debt to EBITDA covenant is 4.75x for the first two quarters after closing the merger, before stepping down to the amounts listed in the table.
(3) Pro forma the Tervita transaction
18SECURE ENERGY
Delivering energy to the world, so people and
communities thrive
» Tervita transaction expected to unlock significant
shareholder value
• Combined scale enhances efficiency and execution
• Integration cost savings will materially increase Adjusted
EBITDA and discretionary free cash flow
• Enhanced capital markets relevance
• Trusted relationships with diverse customer base
• Proven management team and Board, reflecting the
strengths and capabilities of both organizations
» Growth supported by:
• Produced water volumes increasing at a disproportionate
rate relative to aggregate production
• Increased use of multi-well pad drilling supports
economics for pipeline connecting to midstream facilities
» Challenging what’s possible with solutions to increase
customer netbacks and improve capital efficiency
SECURE’s Kerrobert Oil Terminal and Pipeline
» Trading below midstream and environmental industry peers
offers investment opportunity
19Appendix
20Canadian Energy: Helping People and Communities Thrive
Canada has best in class safety, environmental and social practices, and the natural resources to make us the
leading provider of sustainably produced energy
» Energy Improves Lives
• The world continues to need affordable and reliable energy
provided by oil and gas
» Canadian energy provides an environmentally and socially
responsible solution to meet growing demand requirements and
help displace fuels from other less responsibly produced sources
Enviable safety standards
Promotes and protects human rights
Stable political environment
Strong and ethical governance
Environmental leaders
Canada Action as of 4/16/2021. Sources: worldstopexports.com, various indexes listed above. Note: only the world’s top 10 oil
exporters ranked in order: Saudi Arabia (1), Russia (2), Iraq (3), Canada (4), UAE (5), USA (6), Kuwait (7), Nigeria (8), Kazakhstan
(9), Angola (10), are shown.
21Oil and Gas Industry: Leaders in Technological Innovation
Investment in oil and gas will drive innovation and technology to supplement policy in the effort to meet Paris
Agreement objectives
What will be the biggest factor to help the energy Environmental Protection Spending by Industry
sector meet the Paris Agreement’s objectives?
Technological innovation 68%
Nature-based solutions 3%
TOTAL:
$9.7 billion
Carbon pricing 22% OIL AND NATURAL GAS:
$3.5 billion
"Green New Deal"-style stimulus 7%
Poll question results from Scotiabank’s Second Annual ESG Conference (June 2020)
Statistics Canada, 2020
» The oil and gas industry is in a permanent state of innovation
• Geological, chemical and engineering challenges have been addressed efficiently and economically over the past 100 years
» Currently undertaking challenge of reducing CO2 emissions
• Large-scale technological innovation is the key to abating this challenge
• Canada’s energy sectors have the technical expertise and entrepreneurialism to drive forward solutions to emission issues
Investing in the Canadian oil and gas industry is part of the solution
22Forward-Looking Statements and Non-GAAP Measures
Forward Looking Statements: This presentation contains "forward-looking statements" and/or "forward-looking information" within the meaning of applicable securities laws (collectively referred to as "forward-looking statements").
When used in this document, the words "achieve", "commit", "continue", "deliver", "drive", "enhance", “eliminate”, "execute", "expect", "focus", "go forward" "integrate", "long-term", "opportunity", "optimize", "plan", "position",
"priority", "progress", "realize", "reach", "strategy", "target" and "will", and similar expressions, as they relate to SECURE, or the combined company following close of the Tervita merger, or their respective management, are intended
to identify forward-looking statements. Forward-looking statements included or implied herein may include: expectations with respect to the business, financial prospects and future opportunities for the combined company following
close of the Tervita merger, including its ability to be an industry leader and increased market relevance; the complementary nature of the combined company's asset base, and the ability to enhance scale, increase utilization,
efficiencies and geographic coverage, and consolidate SECURE's and Tervita's customer bases as a result thereof; the combined company's ability to provide enhanced customer services; the combined company's commitment to
achieving ESG goals and expected results; the priorities of the combined company, including related to ESG and health and safety; the combined company's expected free cash flow and expected uses thereof; the optimized capital
structure of the combined company; expected returns for combined company's investors and the ability of the combined company to create significant shareholder value; accretion to cash flow and discretionary free cash flow per
share resulting from the Tervita Merger, and timing thereof; increased trading liquidity of the combined company's shares and publicly traded debt; the combined company's access to capital and the cost of such capital; results of the
combined company, including, expected market capitalization, enterprise value, annual Adjusted EBITDA, dividend yield, discretionary free cash flow and discretionary free cash flow yield, free cash flow and free cash flow yield,
including expectations relative to its peers; anticipated efficiencies of the combined company; expected annual integration cost savings of the combined company and timing thereof, including from optimization of overhead and
corporate savings, with expected one-time implementation costs; expected debt to EBIDTA ratios and the timing thereof; focus on stakeholder returns; the redemption of US$100M of the combined company's senior secured notes; the
combined company's expected dividends; the combined company's capital program; the combined company's long-term debt maturities; produced water volumes and the use of multi-well pads and the effect on the combined
company's business; general market conditions and industry growth trends; demand for the Corporation's services and products; future commodity prices and their effect on the business; the advancement of ESG initiatives within the
Canadian oil and gas industry; Canada’s standing among oil exporters in terms of safety, environmental, social and governance standards; the ability of Canadian oil and gas companies to drive forward solutions to emission issues; the
Corporation's future capital spending and cost controls; SECURE's growth opportunities, expansion strategies and future business drivers; SECURE’s proposed 2021 capital expenditure programs.
Forward-looking statements are based upon, among other things, factors, expectations and assumptions that SECURE has made as at the date of this presentation regarding, among other things: the combined company's ability to
successfully integrate the businesses of SECURE and Tervita; sources of funding that each of SECURE and Tervita have relied upon in the past continue to be available to the combined company on terms favorable to the combined
company; future acquisition and sustaining costs will not significantly increase from past acquisition and sustaining costs and the combined company will have access to sufficient capital to pursue future development plans; the impact
of COVID-19 or its variants and government responses related thereto; the impact of lower global energy pricing on oil and gas industry exploration and development activity levels and production volumes (including as a result of
demand and supply shifts caused by COVID-19 or its variants and the actions of OPEC and non-OPEC countries); the success of SECURE's operations and growth projects; SECURE's competitive position remaining substantially
unchanged; that counterparties comply with contracts in a timely manner; that there are no unforeseen material costs relation to the combined company's facilities; that prevailing regulatory, tax and environmental laws and
regulations will continue to apply; increases to the combined company's share price and market capitalization over the long term; the ability of the combined company to repay debt and return capital to shareholders; the combined
company's ability to obtain and retain qualified staff and equipment in a timely and cost-efficient manner; and other risks and uncertainties described from time to time in filings made by SECURE and Tervita with securities regulatory
authorities. SECURE believes that the factors, expectations and assumptions reflected in the forward-looking statements are reasonable; however, no assurances can be given that these factors, expectations and assumptions will prove
to be correct.
Forward-looking statements involve significant known and unknown risks and uncertainties, should not be read as guarantees of future performance or results, and will not necessarily be accurate indications of whether such results will
be achieved. Readers are cautioned not to place undue reliance on these statements as a number of factors could cause actual results to differ materially from the results discussed in these forward-looking statements, including but not
limited to: the ability to complete the Tervita merger on the terms contemplated by SECURE and Tervita; the ability of the combined company to realize the anticipated benefits of, and synergies from, the Tervita merger and the timing
thereof; actions taken by government entities or others seeking to prevent or alter the terms of the Tervita merger; potential undisclosed liabilities unidentified during the due diligence process; the accuracy of the pro forma financial
information of the combined company; the interpretation of the Tervita merger by tax authorities; the success of business integration; the focus of management's time and attention on the Tervita merger and other disruptions arising
from the Tervita merger ; the ability to maintain desirable financial ratios; the ability to access various sources of debt and equity capital, generally, and on acceptable terms; the ability to utilize tax losses in the future; the ability to
maintain relationships with partners and to successfully manage and operate integrated businesses; risks associated with technology and equipment, including potential cyberattacks; the occurrence of unexpected events such as
pandemics, war, terrorist threats and the instability resulting therefrom; risks associated with existing and potential future lawsuits, shareholder proposals and regulatory actions; and those factors referred to under the heading "Risk
Factors" in the SECURE 2020 Annual Information Form and the Joint Information Circular of SECURE and Tervita dated May 6, 2021, each of which is available on SEDAR. In addition, the effects and impacts of the COVID-19 (including
variants) outbreak, the rapid decline in global energy prices and the length of time to significantly reduce the global threat of COVID-19 and its variants on SECURE's, Tervita's and the combined company's respective businesses, the
global economy and markets are unknown and cannot be reasonably be estimated at this time and could cause the combined company's actual results to differ materially from the forward-looking statements contained in this
presentation. Although forward-looking statements contained in this presentation are based upon what SECURE believes are reasonable assumptions, SECURE cannot assure investors that actual results will be consistent with these
forward-looking statements. The forward-looking statements in this presentation are expressly qualified by this cautionary statement. Unless otherwise required by law, SECURE does not intend, or assume, any obligation to update
these forward-looking statements.
Non-GAAP Measures and Operational Definitions: SECURE uses accounting principles that are generally accepted in Canada (the issuer’s “GAAP”), which includes International Financial Reporting Standards (“IFRS”). This presentation
contains certain supplementary measures, such as discretionary cash flow and Adjusted EBITDA, which do not have any standardized meaning as prescribed by IFRS. These measures are intended as a complement to results provided in
accordance with IFRS. SECURE believes these measures provide additional useful information to analysts, shareholders and other users to understand SECURE’s financial results, profitability, cost management, liquidity and ability to
generate funds to finance its operations. However, they should not be used as an alternative to IFRS measures because they do not have a standardized meaning under IFRS and therefore may not be comparable to similar measures
presented by other companies. These non-GAAP measures, and certain operational definitions used by SECURE, are further explained in SECURE's most recent MD&A, which includes reconciliations of the non-GAAP measures to the
most directly comparable measures calculated in accordance with IFRS.
23You can also read