Investor Presentation - March 11, 2021 - Seeking Alpha
←
→
Page content transcription
If your browser does not render page correctly, please read the page content below

Investor Presentation

    March 11, 2021

                        1
Forward Looking Statements
FORWARD LOOKING STATEMENTS:
Certain matters within this presentation include “forward–looking statements” within the meaning of Section 27A of the Securities Act of 1933, as
amended, and Section 21E of the Securities Exchange Act of 1934, as amended. The “forward-looking statements” may include our current expectations,
assumptions, estimates and projections about our business and our industry. They may include statements relating to the proposed offering, the
anticipated use of proceeds, future revenues, expenses and profitability, the future development and expected growth of our business, projected capital
expenditures, attendance at movies generally or in any of the markets in which we operate, the number or diversity of popular movies released and our
ability to successfully license and exhibit popular films, national and international growth in our industry, competition from other exhibitors and alternative
forms of entertainment and determinations in lawsuits in which we are defendants. Forward-looking statements can be identified by the use of words
such as “may,” “should,” “could,” “estimates,” “predicts,” “potential,” “continue,” “anticipates,” “believes,” “plans,” “expects,” “future” and “intends” and
similar expressions. Forward-looking statements may involve known and unknown risks, uncertainties and other factors that may cause the actual results
or performance to differ from those projected in the forward-looking statements. These statements are not guarantees of future performance and are
subject to risks, uncertainties and other factors, some of which are beyond our control and difficult to predict, including, among others, the impacts of
COVID-19. Such risks and uncertainties could cause actual results to differ materially from those expressed or forecasted in the forward-looking
statements. For a description of the risk factors, please review the “Risk Factors” section or other sections in the Company’s Annual Report on Form 10-K
filed February 26, 2021. All forward-looking statements are expressly qualified in their entirety by these cautionary statements and such risk factors. We
undertake no obligation, other than as required by law, to update or revise any forward-looking statements, whether as a result of new information,
future events or otherwise.

Except as otherwise specified or indicated by the context references in this presentation to “we,” “us,” “our,” “Cinemark” or the “Company” are to the
combined business of Cinemark Holdings, Inc. and its consolidated subsidiaries.

NON-GAAP FINANCIAL MEASURES:
Certain non-GAAP financial measures included in this presentation, including Free Cash Flow, Adjusted EBITDA and other financial measures utilizing
Adjusted EBITDA, may not comply with the guidelines adopted by the Commission regarding the use of financial measures that are not prepared in
accordance with U.S. generally accepted accounting principles (“GAAP”). Our measurement of Adjusted EBITDA and other financial measures may not be
comparable to those of other companies. Please see the Appendix for definitions of our non-GAAP financial measures and a reconciliation of each non-
GAAP financial measure to the most directly comparable financial measure stated in accordance with GAAP.

                                                                                                                                                              2
Cinemark Overview

                    3
Cinemark Overview
                                                                        331 Theatres 4,507 Screens

 • One of the largest and most influential movie theatre
   companies in the world
      – 531 theatres with 5,958 screens in 16 countries (1)

 • U.S. Operations (2)
      – Third largest exhibitor in terms of market share
      – 42 states, 104 DMAs
      – #1 or #2 in box office revenues in 80% of our top 25 markets
      – Highest attendance per screen among leading exhibitors
      – Surpassed North American industry box office growth for 10
        out of the past 11 years                                        200 Theatres 1,451 Screens
      – U.S. operations funded the debt, domestic growth
        opportunities and dividend

 • International Operations (2)
      –    First modern theatre experience throughout Latin America
      –    More than 26 years of operating experience
      –    15 countries
      –    Approximately 30% market share in key countries
      –    Presence in 14 of top 20 metropolitan cities in the region

 1)       As of 12/31/2020.
                                                                                                     4
 2)       As of 12/31/2019
Highly Experienced Management Team

         Lee Roy Mitchell                                                  Mark Zoradi
         Founder & Executive Chairman                                      CEO & Board Director
         Founded Cinemark in 1987, served as CEO                           Served as Cinemark’s CEO since 2015. Spent
         through 2006 and has served as Executive                          30+ years at Walt Disney Company, most
         Chairman since 1996                                               recently serving as President of the Walt
                                                                           Disney Studios Motion Picture Group

         Sean Gamble                                                       Valmir Fernandes
         CFO & COO                                                         President, International
         10+ years of industry experience. Joined as                       20+ years of Cinemark experience includes
         Cinemark’s CFO in 2014 after spending 5+                          the past 10 years as President of
         years as CFO/Executive Vice President of                          International following 10 years as the
         Universal Pictures within NBCUniversal                            General Manager of Cinemark Brazil

                                       Mike Cavalier
                                       EVP General Counsel
                                       Served as General Counsel since 1997. Helped
                                       guide company through various transactions
                                       including M&A, IPO and numerous lending
                                       agreements

            Additional key leaders with 20+ years of industry/Cinemark
                     experience in the US and internationally

                                                                                                                        5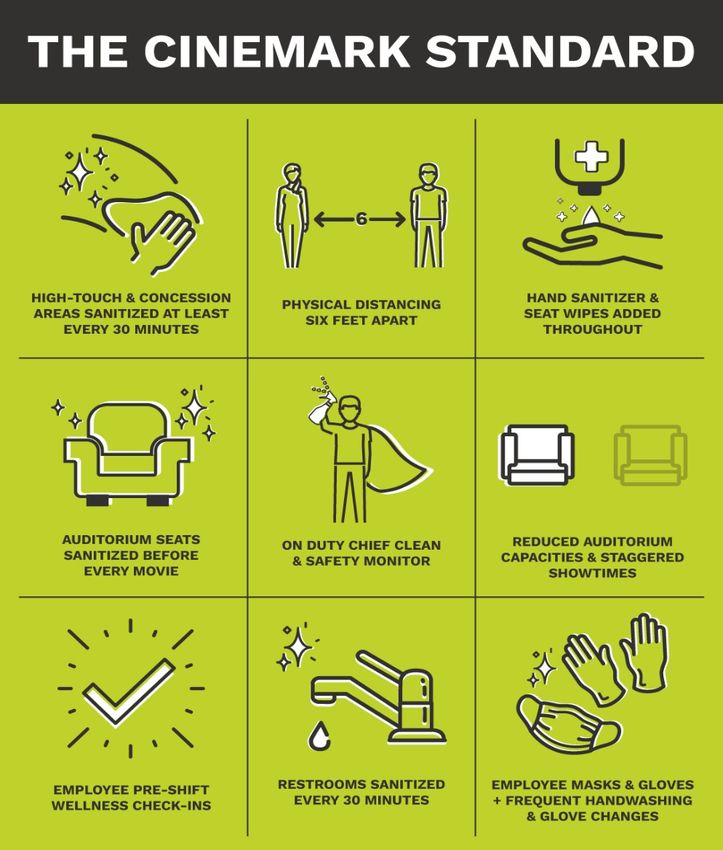
Exhibition Industry Trends
Stable, long-term industry growth trends across technology innovations and economic cycles

                                                        North America Box Office Trends
                                                                                                                                                                    Recliners and
                                                                                                                                                                   enhanced food
                                                                                                     DVD player              Digital projector conversion          Investments ...
                                                                                                    drops to$100
                                                                                                    (DVD heyday)                             Mass OTT streaming adoption ...
         Recession year                                                                                                    Financial
                                                                                                                             crisis
                                                                                               Exhibition
                                                                                             bankruptcies/
                                                                                             consolidation
                                                                     Megaplex and
                                                                    stadium seating

                                                           Internet begins

                                                                                                                                                                                 $11.4B
                                                          to go mainstream

            VHS begins
              to ramp
           post beta-max

                                                                                             1.57B patrons

                                                                                                                    1.38B patrons
                                                                                                                                                     1.3B patrons
 $2.8B

                                  1.1B patrons
  1980

                           1985

                                                 1990

                                                             1995

                                                                                      2000

                                                                                                             2005

                                                                                                                                    2010

                                                                                                                                                            2015

                                                                                                                                                                                          2020
             VCR                                                Internet                             DVD                                        Streaming

                                                                                                                                                                                            6
 Sources: North America: ComScore; NATO.
Broad and Leading Presence in the Americas
Strong presence across the U.S. and Latin America that is strategically important to film
distributors as well as promotional partners

       Market Share - North America1                           Market Share - Key Latin American Markets1

                                                                                                 Cinemark
                                                                                        27%      Cinepolis
                                                                         37%
                                                                                                 Kinoplex
                                               AMC            Brazil
                                                                                                 Araujo
                                         23%                                            15%
                                                                                                 UCI
                                                                               6% 10%
Others                                                                   5%                      Others
          36%

                                                                                                 Cinemark
                                                                              20%
                                                                                                 Cinepolis
                                                                                           37%
                                                                                                 NAI
                                                             Argentina   7%
                                               17%                       8%                      Lumiere
                                                     Regal                                       Cinemacenter
                                                                              13%    15%
           2%                                                                                    Others
    Harkins 3%
       Marcus     6%               13%
           Cineplex                                                             4%
                                    Cinemark                              16%                    Cinepolis
                                                                                           45%   Cinemark
                                                               Chile                             Cineplanet
                                                                          35%                    Others

 1) Based on FY 2019 box office.                                                                                7
Pre-COVID
Summary & Financials

                       8
Initiatives to Drive Growth and Outperformance
Cinemark’s strategic initiatives drove growth and consistent outperformance leading into the crisis.
While the initiatives are currently being reprioritized, we expect these to be a focus over the long-term.

   1    Create an extraordinary in-
        theatre guest experience

        Deepen and extend the overall
   2    guest engagement

        Actively pursue organic and
   3    synergistic growth opportunities

         Invested in strategic initiatives while maintaining the strength and flexibility of our balance sheet.
                      Going forward, re-fortifying the balance sheet will be our primary focus.

                                                                                                                  9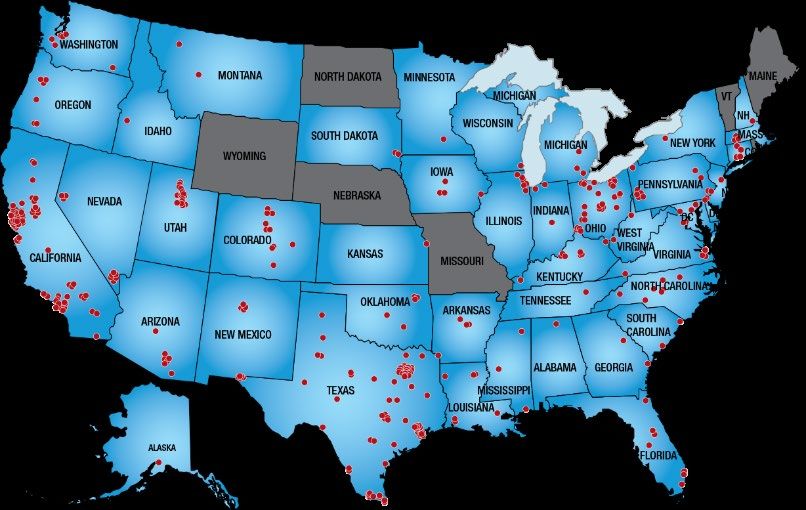
Consistent Industry Outperformance
Cinemark has surpassed North American industry box office growth 40 out of the past 45 quarters and
has consistently led the industry in profitability
   2014 - 2019 Admission Revenue Growth 1                                                                  CNK WW Adjusted EBITDA Growth 1, 2

                                                                                                                                            +6%
                                                               22.9%                                                                       CAGR            $745

                                       17.3%                                                                               $551

               10.1%

        North America               Cinemark                Cinemark                                                     2014                               2019
          Industry                     U.S.                 Worldwide                                                  Constant $
                                                            Constant $
  Source: MPAA and Public Filings.
  1) As of December 31, 2019. 10% WW growth in USD as reported. Constant currency is a non-GAAP measurement calculated using the average exchange rates for the
      corresponding months for 2019. We translate results of our international operating segment from local currencies into U.S. dollars using currency rates for respective reporting
      periods. Significant changes in foreign exchange rates from one period to the next can result in meaningful variations in reported results. We provide constant currency
      amounts to compare performance without the impact of foreign currency fluctuations. See schedule of non-GAAP measures and financial metrics at investors.Cinemark.com
102) Adjusted EBITDA has been presented including all cash distributions from equity investees for all years presented. See Appendix page 28 for reconciliation of Adjusted EBITDA to    10
      the most directly comparable GAAP measures.
2019 Financial Summary
Amounts in millions
2019 Worldwide Results Highlights
• Served ~280 million patrons globally
• Achieved 5th consecutive year of record revenue with top-
5-Year line growth in U.S. and International2 segments
2019 CAGR • Exceeded North America industry box office growth by
Attendance 280 1.2% 200 bps, outperforming in 10 of the past 11 years
• Grew global concession per caps 8.7% in constant $,
Revenue $3,283 4.6% extending growth trend to 13 consecutive years
Adj. EBITDA (1) $745 3.9% • Generated over 20% free cash flow growth vs. 2018
Adj. EBITDA % (1) 22.7% • Maintained balance sheet strength with almost $0.5B in
cash and ~2x net leverage, consistent with results for past
10 years
Free Cash Flow (1) $258 4.2%
• Strengthened circuit and customer experience by
End Cash Balance $488 reclining another 200 screens, representing 60% of U.S.
Net Leverage 2x circuit at year-end
• Expanded highly successful Movie Club subscription
program to 950K members
1) See Appendix page 24 for reconciliation of Adjusted EBITDA and Free Cash Flow to the most directly comparable GAAP measures 11
2) Intl segment growth in constant $Track Record of Balance Sheet Strength
Cinemark has historically maintained a conservative, low leverage profile and maintained cash on-hand
of ~$0.5B with a focus on maintaining the balance sheet strength as it was considered a strategic asset
2015 - 2019 Leverage
Secured Debt / Adj. EBITDA Net Debt / Adj. EBITDA
3.0x 2.9x 2.9x
2.6x 2.6x
2.1x 2.1x 2.2x
2.1x
2.0x
1.3x 1.3x 1.3x 1.2x 1.1x
2015 2016 2017 2018 2019
12COVID-19
Update
132020 Financial Summary
Amounts in millions
FY 2020 Worldwide Results Highlights
• Ahead of the crisis, through Feb QTD, on relatively flat
attendance, revenue was up 5%, Adj. EBITDA had increased
16% and Adj. EBITDA margin expanded ~200 bps compared to
1Q19
FY20 FY19 • The impact of COVID-19, including being shutdown for last
Attendance 54 280 two weeks of March, throughout 2Q and most of 3Q, with
limited film content materially distorted FY20 reported results
and yielded a net loss of $(617)MM
Revenue $686 $3,283
• We have taken significant actions to preserve cash and bolster
Adj. EBITDA (1) $(277) $745 liquidity, which limited our monthly cash burn and secured
cash runway into 2022 if the current environment continues
Adj. EBITDA % (1) N/A 22.7%
• Our history of favoring a strong balance sheet with low
Free Cash Flow (1) $(414) $258 leverage has positioned us well to withstand the COVID-19
pandemic; cash management will remain a central focus as
End Cash Balance $655 $488 we emerge from crisis
Net Leverage N/A 2x – Full-year CapEx reduced to ~$84MM vs. $300MM budget
– Negotiated $75M in rent deferrals, along with payment
extensions of varied other obligations
1) See Appendix page 24 for reconciliation of Adjusted EBITDA and Free Cash Flow to the most directly comparable GAAP measures. 14Liquidity Runway
Based on our current estimates for recovery, we believe we have and will generate sufficient cash to
sustain operations
Liquidity Runway Highlights
$’s in millions • Liquidity runway extends into fourth quarter of 2021 and into
FY20 2022 with the incremental tax refunds we expect to receive
that we have already filed
Cash Balance $655
• 2021 cash burn ~$65/month based on the current operating
Available Revolver $100 environment
Expected Tax Benefits $100+ – Does not assume any further improvements in operating
results as new film content ramps up during the course of
the year
Total Available Liquidity $855+
– Also does not assume any additional rent adjustments,
Monthly Burn Rate ~$65 which we continue to aggressively pursue
• Additional financing options remain available to us in the
event they are needed
15Key Liquidity Actions
We have been working aggressively to preserve cash and bolster liquidity to effectively navigate
through the crisis; we have limited cash burn and secured a runway into 2022 if the current operating
environment continues
Eliminated Non- Cash Preservation & Liquidity Actions
Essential Expenses
– Significantly limited all non-essential operating/capital expenditures
Reduced Payroll – Board of Directors and CEO elected to take no salary for 5 months during the shutdown; numerous
executives voluntarily reduced to 20% salary
– Additional payroll reductions included laying-off hourly workers during the shutdown and temporarily
Delayed Payments reducing salaries for corporate employees, both domestically and internationally
– Negotiated payment deferrals and modifications across a wide range of lease-related and other contractual
obligations (ex: deferred ~$75MM of facility lease payments to 2021 and 2022)
Suspended
Dividend – Temporarily suspended quarterly dividend of ~$42MM per quarter
– Secured $730M of new debt
Secured Additional
Financing
– $124MM CARES Act received associated with QIP and net loss deductions with an incremental $100MM
filed with the IRS
Pursuing CARES
– As part of restructuring plan, permanently closed 24 lower performing theatres and reduced corporate
Act Opportunities
workforce, which will improve annual Adj. EBITDA/cash $10MM+
Restructured – Re-engineering business processes to be more streamlined and efficient
Operations
1) International operations have pursued similar actions, however lay-offs have not yet been as significant due to varied country regulations. 16Streamline & Business Efficiency Actions
Have enacted, and are continuing to pursue, varied productivity and efficiency initiatives to achieve our
strategic cash management and profitability objectives, including aligning expenses with near-term
demand.
Optimizing operating hours and showtime schedules through utilization of
enhanced data management analytics
Simplifying and streamlining numerous theatre practices, such as ticket issuance,
inventory procedures and ushering routines, to be leaner and more efficient
Refining the degree of staffing required to operate theatres, including enhanced
planning and management controls
Concentrating food and beverage offerings to core categories, which are less
labor intensive (will ramp up offerings once attendance warrants)
Continuing to drive company-wide Continuous Improvement and margin
expansion projects
Delaying certain capital and resource-intensive initiatives that are not critical in
the near-term, and rationalizing theatre and corporate headcount accordingly
17Enhanced Cleaning, Safety and Efficiency Measures
A range of enhanced cleaning and distancing protocols have been implemented to ensure guest and
employee safety
• Staggering show times to minimize crowds and
implementing seat buffering technology within our
point-of-sale system that will ensure physical distancing
between parties
• Mandatory face masks for employees and guests
• Substantially raising the fresh-air rates of our HVAC
systems with constant use of supply fans to increase the
total volume of fresh, outside air flowing through our
theatres
• Screening employee well-being before each shift
• Assigning a Chief Clean & Safety Monitor for each
theatre shift for a heightened level of accountability
• Minimizing physical contact at the box office and
concession stand (e.g., installing plexiglass barriers)
• Implementing contactless transactions protocols
• Frequently disinfecting all high-touch areas, as well as
seats every morning and between show times with
products approved by EPA to combat COVID-19
18Domestic Theatre Results
The results of our test-and-learn theatres were instrumental in the phased reopening of our global
circuit with key learnings on training, communication, implementation and execution of our clean
and safety protocols in this new operating environment.
• Box office of $44.4M generated in 4Q20 with ~75% theatres operating and limited
Box
new film offerings
Office
• Private Watch Parties generated 24% of the 4Q20 box office
Food & • Food & beverage per cap trends in-line with pre-COVID figures with limited
Beverage concession offerings and discounted ‘welcome back’ pricing
• Weekend occupancy during 4Q20 was 7%+ with reduced capacity and library content
Occupancy relative to 25 – 30% averages historically; 4Q20 holiday weekend occupancy was 16%+
Movie Club • Movie Club members representing 20 - 25% of attendance
• Theatres operating are more than covering incremental variable costs (film rental,
Operating COGS, hourly labor, utilities, janitorial, etc.)
Costs
• Operating theatres burning less cash relative to being shut down
Guest • 96% guest satisfaction with Cinemark protecting their health and safety
Satisfaction • Vast majority of guests intend to visit again and will recommend Cinemark to
family and friends 19Theatre Reopening Status
Cinemark’s reopening strategy was based on a range of strategic health, regulatory and consumer
considerations, as well as active collaboration with our studio partners on the timing of their new film
releases
Reopening Considerations Reopening Timeline and Approach
• ~75% U.S. theatres open as of year-end
1 Current status of the virus • ~80% re-opened as of March 5
• Expectations that theatres in California, our #2 market,
Evolving restrictions imposed by will continue to open over the coming weeks
2
governmental authorities
• 65% of Latin America open as of year-end
• ~50% re-opened as of March 5 with temporary
3 Availability of new film content
government restrictions due to rising COVID rates,
predominately in Sao Paolo and Chile
4 New health and safety protocols • Tactical and phased reopening was successful in the U.S. and
was applied throughout Latin America
Consumer confidence and • Showing classic repertory content at attractive ‘welcome back’
5
willingness to return to theatres promotional pricing of $5 for adults and $3 for children and
seniors in addition to new release films
20A Look Ahead
21Theatre Industry – A Look Ahead
• Innovating and evolving movie-going the movie-going
experience with Private Watch Parties and reparatory
content as we await the reignition of the industry
• We believe pent-up demand for out-of-home
entertainment, along with a backlog of strong film
content, bodes well for exhibition
• A return to ‘normalcy’ may span multiple months
driven by staggered theatre openings due to
government limits, reduced operating hours, lingering
social distancing and a ramp-up of consumer comfort
with public gatherings
– Note: our historic occupancy levels in peak periods
typically range between 20-30%, so we can operate
profitably while maintaining social distancing
requirements
• Studio and talent support is strong with marketing
campaigns, festival ideas and other creative concepts
already in motion to help excite consumers to return to
theatres
• We have maintained active communication with
Cinemark Movie Rewards members, including Movie
Club, which will be a key channel for reopening
222021 Film Slate
232022 Film Slate
2 24International Theatrical Momentum
As shown in international markets where COVID-19 is more contained, such as China, Japan and
Australia, the box office has seen significant pent-up demand and record-breaking theatrical releases
Japan China Australia
Demon Slayer: Detective Hi, Mom Wonder Woman 1984
Mungen Train Chinatown 3
• Demon Slayer: Mungen Train, • The Chinese New Year holiday box office • Strong Australian box office
released in October 2020, brought in an all-time high of $1.2 billion performance during the
became the highest-grossing and 160 million viewers Christmas holiday, driven by
movie of all-time in Japan – • Represents the first time that China’s Wonder Woman 1984
surpassing the previous record single day box office earned more than • Represents the #1 release in
held by Spirited Away $155 million for 5 straight days Australia since cinemas
• Represents the first movie to • Detective Chinatown 3 had the largest reopened
gross 10 billion yen ($96 million) opening day ever in a single market
• Represents the second highest
in Japan within 10 days of • Hi, Mom and Detective Chinatown 3 have grossing film released in
opening grossed more than $600 million each after Australia in 2020, behind 1917
only 2 weekends
25
Source: IMDb and Box Office MojoAppendix
26FY 2020 Non-GAAP Measure Reconciliations
$’s in thousands
Reconciliation of Cash Flows (Used for)
Reconciliation of Net Income/(Loss) to Adjusted EBITDA
Provided by Operating Activities to Free Cash Flow
FY 2020 FY 2019 FY 2020 FY 2019
Net Income/(Loss) ($617,948) $193,848 Cash flows (used for) provided by operating
($330,098) $561,995
activities
Add (deduct):
Income taxes (309,376) 79,912 Deduct:
Interest expense (1) 129,871 99,941 Capital Expenditures 83,930 303,627
Other (income) expense, net (2) 62,369 (22,441) Free Cash Flow ($414,028) $258,368
Cash distributions from DCIP (3) 10,383 23,696
Cash distributions from other equity investees(4) 15,047 29,670
Non-cash distribution from equity investee(5) (12,915) 0
Depreciation and amortization 259,776 261,155
Impairment of long-lived and other assets 152,706 57,001
Restructuring costs 20,369 0 FY 2020 FY 2019
(Gain)/Loss on disposal of assets and other (8,923) 12,008
Total Revenues $686,310 $3,283,099
Non-cash rent expense 2,357 (4,360)
Share based awards compensation expense 19,404 14,615 Adjusted EBITDA (276,880) 745,045
Adjusted EBITDA ($276,880) $745,045 Adjusted EBITDA Margin N/A 22.7%
1) Includes amortization of debt discount and debt issue costs.
2) Includes interest income, foreign currency exchange gain (loss), interest expense – NCM and equity in income of affiliates and excludes distributions from NCM.
3) See discussion of cash distributions from DCIP, which were recorded as a reduction of the Company’s investment in DCIP in the notes to the consolidated financial statements included
in our Annual Report on Form 10-K filed February 26, 2021. These distributions are reported entirely within the U.S. operating segment.
4) Reflects cash distributions received from equity investees, other than those from DCIP noted above, that were recorded as a reduction of the respective investment balances. These
distributions are reported entirely within the U.S. operating segment.
5) Reflects non-cash distribution from DCIP. These distributions are reported entirely within the U.S. operating segment. 27Thank You
Chanda Brashears
SVP Investor Relations
cbrashears@cinemark.com
972-665-1671
28You can also read