Brookfield Renewable Partners - Brookfield Renewable ...

Page created by Charles Garza
 
CONTINUE READING
Brookfield Renewable Partners - Brookfield Renewable ...
Brookfield Renewable Partners
I N V E S T O R D AY
SEPTEMBER 26, 2019
Brookfield Renewable Partners - Brookfield Renewable ...
Agenda

Track Record and Outlook                  3
Sachin Shah, Managing Partner & CEO

Investment Capabilities                  27
Connor Teskey, Managing Partner & CIO

Proven Financial Strength                42
Wyatt Hartley, Managing Director & CFO

Summary and Q&A                          68
Sachin Shah, Managing Partner & CEO

                                              2
Track Record and Outlook

Sachin Shah
Managing Partner & CEO

                           3
Brookfield Renewable is a leading
           global owner, operator and developer
                 of renewable power assets

                                                                                                                         SMOKY MOUNTAIN HYDRO
                                                                                                                                 UNITED STATES

          $50B                                   18,900 MW                                  15 COUNTRIES                5 SECTORS
    TOTAL POW ER                                     INSTALLED                                       GLOBALLY              MULTI-
      ASSETS                                         CAPACITY¹                                      DIVERSIFIED         TECHNOLOGY

Includes transactions signed but not yet closed.
1. Includes assets currently under construction at X-Elio which are expected to be commissioned by December 31, 2019.

                                                                                                                                           4
We have a consistent, proven
  and repeatable strategy

                               5
…Underpinned by our key pillars

                           12% to 15% returns

               Value                Operating                Capital
             Investing              Expertise               Discipline

        Our business generates stable, attractive returns over the long-term

                                                                               6
This playbook allows us to set objectives and deliver

   Key priorities over the last five years
   Deploy $3.5 billion of equity at our target returns

   Grow scale in wind and solar

   Build a distributed generation business

   Globalize our operations

   Maintain an investment grade balance sheet

   Reduce payout ratio

   Monetize up to $1 billion of assets and enhance liquidity

                                                               7
We have a consistent track record of strong performance

          BBB (HIGH)                                                                                         BBB (HIGH) / BBB+

                                                                                                                                          $2.06
                                                                                                                                       PER UNIT
                                                                                                                                     DISTRIBUTION

                                                                                                                                                        16%
                                                                         $1.25                                                                          BEP TOTAL
                                                                      PER UNIT                                                                          RETURN
                                                                    DISTRIBUTION

                                                                                                                                                        Total Returns
         $0.71                                                                                                                                          Alerian MLP Index: 11%
        PER UNIT
      DISTRIBUTION                                                                                                                                      S&P Utilities Index: 8%

                                                                                                                                                        S&P 500 Index: 6%
          1999

                 2000

                        2001

                               2002

                                      2003

                                             2004

                                                    2005

                                                           2006

                                                                  2007

                                                                          2008

                                                                                 2009

                                                                                        2010

                                                                                               2011

                                                                                                      2012

                                                                                                             2013

                                                                                                                    2014

                                                                                                                            2015

                                                                                                                                   2016

                                                                                                                                          2017

                                                                                                                                                 2018
                                      BEP              Alerian MLP                      S&P Utilities                      S&P 500

Source: Bloomberg
Total return assuming reinvestment of dividends between November 1999 and August 2019.

                                                                                                                                                                                  8
Growth of renewables will be larger
      than anyone expected

                                      9
In the last five years…

                    $1.5 trillion                                                         1 million
                        INVESTED IN                                                      MEGAWATTS OF NEW
                      NEW RENEWABLES                                                    RENEWABLE CAPACITY

                    20%
                    HYDRO
                                                                                                        42%
                                                                                                        SOLAR
                              5%
                              OTHER

                                                                                               33%
                                                                                                W IND

Source: Bloomberg New Energy Finance, Brookfield estimates of large hydro investment.
Note: Pie chart reflects breakdown of capacity additions.

                                                                                                                10
What has driven this growth?

                  1       Competitive cost structure

                  2       Carbon reduction targets

                                                       11
Wind and solar are now the most economic sources of bulk power

                                                Levelized Cost of Energy
                                                         $/MWh

               140                                              Forecast
                                                                   Forecast
               120
               100
       $/MWh

               80
               60
               40
               20
                0
                      2014       2015   2016   2017   2018   2019   2020      2021   2022   2023   2024   2025

                                           Solar
                                           PV Solar      OnshoreWind
                                                         Onshore Wind            Gas
                                                                                CCGT

Source: Bloomberg New Energy Finance.

                                                                                                                 12
Carbon reduction is universal

                                    Current Renewable Power Generation is Below 2030 Targets

                                         70%
          60%
                                                                        55%
                                                                                                                       50%
                                                                                                      40%

                        31%                            26%                           34%                    15%               27%

                    California                     New York                           U.K.                  India            China

                            Current Renewables Generation                             Other Generation          2030 Renewables Target

Source: Bloomberg New Energy Finance.
Note: China and India renewables targets are not currently in legislation, but proposed by policy-makers.

                                                                                                                                         13
Coal is gone and gas is going…

                                          Coal and Gas Generation: North America & Europe
                                                               TWh

                                                                            Forecast
          4,500
          4,000
          3,500
          3,000
    TWh

          2,500
          2,000
          1,500
          1,000
            500
                0
                     2012            2014            2016            2018   2020       2022   2024   2026   2028   2030

                                                                            Coal   Gas

Source: Bloomberg New Energy Finance.
Markets: Canada, France, Germany, Iberia, Italy, North Europe, U.K., U.S.

                                                                                                                          14
And in North America and Europe alone…

                                                              2.5 million MW
                                                                  OF INSTALLED CAPACITY¹

                                                                    Today, 45%
                                                         OF CAPACITY IS COAL AND GAS¹

                                                                  IF THAT FALLS BY HALF IN
                                                                     10 years…

                                          There is $500 billion² of investment
                                               that would be disrupted

1.   Source: Bloomberg New Energy Finance.
2.   Assumes $1,000/kW remaining value for coal and gas plants.

                                                                                             15
The global opportunity set is growing

                                                             $10T

                                       $5T

                     $1.5T

               INVESTMENT IN           RANGE OF INVESTMENT OVER THE
                  THE LAST                   NEXT DECADE
                  5 YEARS

Source: Bloomberg New Energy Finance

                                                                      16
Our strategy in this environment
        will not change

                                   17
1
Rising renewable penetration
  will increase disruption

                               18
2
Margins will be further compressed
     as lower cost renewables
       penetrate the system

                                     19
3
This level of change and disruption
          will be global…

 …which plays to our strengths

                                      20
This capability allows us to generate attractive, risk-adjusted returns

  RISK
                                              Capital Scarcity
                                              Operational Complexity
                                              Technological Disruption

                                                     VALUE-
                                                     ENHANCING
                                                     TOOLKIT

               Contracted              Brookfield Renewable
              wind and solar

                                                               RETURNS

                                                                          21
We have global renewable operations

        NORTH AMERICA                                                                 EUROPE
               9,500MW                                                                4,000MW

                                                                    SOUTH AMERICA                                          ASIA
                                                                    4,800MW                                                620MW

Includes capacity from transactions signed but not yet closed, including assets currently under construction at X-Elio which are expected to be commissioned by the end of
2019.

                                                                                                                                                                             22
We invest in scale across all major renewable technologies

                                     HYDRO                              UTILITY SOLAR                          WIND
                                    7,900 MW                              2,600 MW                           4,300 MW

                                                 DISTRIBUTED                                          STORAGE
                                               GENERATION (DG)                                        2,700 MW
                                                    730 MW

Note: Brookfield Renewable also owns a ~580 megawatt portfolio of biomass and co-generation facilities.
Note: Includes capacity from transactions announced but not yet closed.

                                                                                                                        23
~3,000 Operating Employees

ENGINEERING & DEVELOPMENT

H E ALT H , S AF E T Y, S E C U R I T Y
AN D E N V I R O N M E N T

G E N E R AT I O N M AN AG E M E N T,
P L AN N I N G & D I S PAT C H

N AT I O N AL S Y S T E M C O N T R O L

S TAK E H O L D E R E N G AG E M E N T

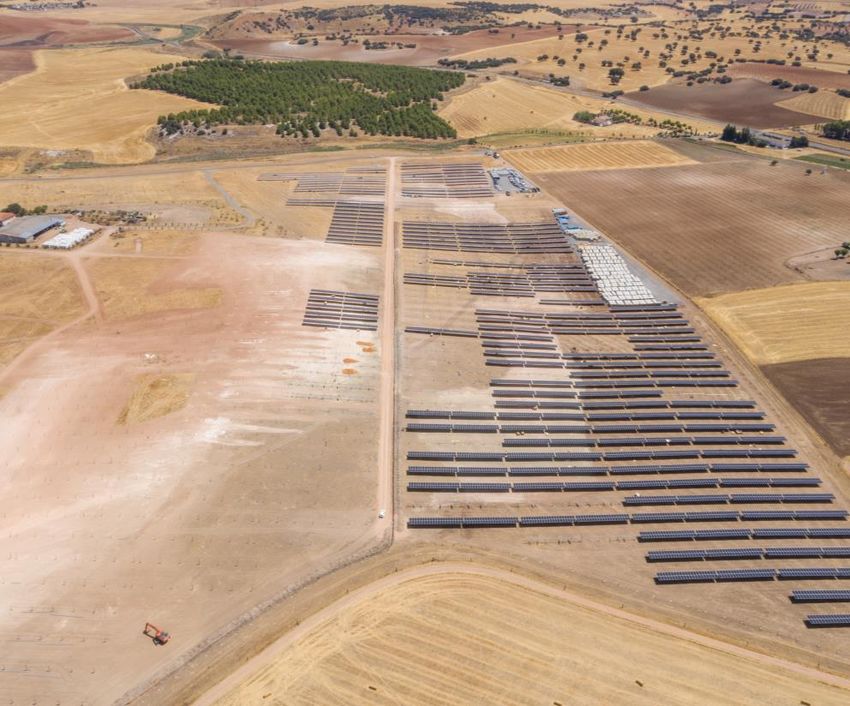
                                          X-ELIO DEVELOPMENT SITE

                                                               24
In the last five years…
                                                                CAPITAL SCARCITY

                                                                        Energisa
                                                                        Saeta

                                                                                   Isagen
                                                        Bord Gais                  TerraForm Power
                                                        Axis                       TerraForm Global

FINANCIAL                            X-Elio
                                                                      $3.5B                           First Hydro
                                                                                                                    OPERATIONAL
DISCIPLINE                                                             EQUITY                                       COMPLEXITY
                                                                      DEPLOYED¹

                                                        Distributed                 U.S. Merchant
                                                        Generation                  Hydros

                                                                       TransAlta

                                                          TECHNOLOGICAL DISRUPTION
1.   Includes transactions signed but not yet closed.

                                                                                                                             25
Looking ahead…

                         The number of      We have a proven
   Decarbonization
                        value-enhancing      and repeatable
    is taking over
                          opportunities         strategy
       the world
                           is growing

      We are one of the few future-proof stocks today

                                                               26
Investment Capabilities

Connor Teskey
Managing Partner & CIO

                          27
We have executed on a repeatable growth strategy for over 20 years

    We are value-oriented investors who seek opportunities where we can
       differentiate ourselves using something other than cost of capital

   ENDURING COMPETITIVE ADVANTAGES         CONSISTENT RETURN TARGETS

         SIZE
                                              Remain disciplined in our
         GLOBAL REACH                           12% to 15%
                                                   return targets
         OPERATIONAL CAPABILITIES

                                                                            28
While our strategy has not changed,
     our capabilities have grown...

 ACCESS           GEOGRAPHIC          TECHNOLOGY           OPERATIONAL
TO CAPITAL         DIVERSITY           DIVERSITY              DEPTH

...Giving us access to the largest spectrum of growth opportunities globally

                                                                               29
And we have deployed capital across a growing number of technologies…

                                     $1B                                     $3.5B
                          EQUITY DEPLOYED                                 EQUITY DEPLOYED¹

                                                                                Storage & Other
                                                                                5%
                                                                  Solar
                                                                   16%

              Wind
              36%                                                             2014-2019           Hydro
                                                                                                  47%
                                   2009-2013
                                                                Wind
                                                        Hydro   32%
                                                        64%

1.   Includes transactions signed but not yet closed.

                                                                                                          30
…And geographies

                                     $1B                                          $3.5B
                          EQUITY DEPLOYED                                      EQUITY DEPLOYED¹

                                                                                 Canada
                                                                                    5%
                                                                        Asia                      U.S.
                                                                        12%                       20%

                      Canada
                        12%

                                                               Brazil
                                                                                   2014-2019
                                                                15%
          Brazil                   2009-2013            U.S.
           26%                                          62%

                                                                                                         Europe
                                                                                                         25%
                                                                    Colombia
                                                                        23%

1.   Includes transactions signed but not yet closed.

                                                                                                                  31
These diverse transactions are
underpinned by a playbook that we have
  refined over the last two decades

                                         32
Value-enhancement toolkit
      in practice…

                   TOOLKIT

Carve-out                  Partnership
Government Privatization   Development
Take-private               Multi-technology
Development Pipeline       Platform
Bankruptcy Restructuring   Structured Transaction

                                                    33
European YieldCo: The Opportunity

•     Spanish renewables temporarily out-of-favor due to regulatory uncertainty
•     Market price providing significant downside protection
•     Improving Spanish economic and renewables backdrop

          1,028 MW                                                           100%            $1.2B¹
           SOLAR AND WIND                                                 CONTRACTED            SCALE
             PORTFOLIO                                                    CASH FLOWS         TRANSACTION

1.   Reflects gross equity capital deployed by TerraForm Power, which is 30% owned by BEP.

                                                                                                           34
European YieldCo: new geography and growth platform in Europe

•   Local presence and existing knowledge of Spanish market from previous due diligence
•   Existing relationships provided opening to engage with shareholders
•   Able to provide a binding offer in under one month

                                          TOOLKIT

                      Carve-out                   Partnership
                      Government Privatization    Development
                      Take-private                Multi-technology
                      Development Pipeline        Platform
                      Bankruptcy Restructuring    Structured Transaction

                                                                                     35
Alberta Hydro: The Opportunity

•     Counterparty was seeking capital for coal to gas conversion
•     Large-scale hydro portfolio, providing critical grid-stabilizing services to the Alberta
      power market
•     Transitioning energy market favoring experienced operators

              813 MW                                                                 90%¹      C$750M²
                   HYDRO                                                  MARKET SHARE OF   CONVERTIBLE SECURITY
                 PORTFOLIO                                                HYDRO PORTFOLIO       INVESTMENT

1.   TransAlta Corporation 2019 Investor Day presentation.
2.   Reflects gross equity capital deployed by BEP and its institutional partners.

                                                                                                                   36
Alberta Hydro: large-scale, perpetual asset portfolio

•   Multi-year discussions with management regarding potential partnership opportunities
•   Structured a “win-win” transaction
•   Attractive economics of convertible securities act as downside protection

                                          TOOLKIT

                      Carve-out                   Partnership
                      Government Privatization    Development
                      Take-private                Multi-technology
                      Development Pipeline        Platform
                      Bankruptcy Restructuring    Structured Transaction

                                                                                           37
Global Solar Developer: The Opportunity

•     Global development at an inflection point as subsidies disappear
•     High-quality portfolio of operating assets, visible pipeline of assets under
      construction and strong future pipeline
•     Experienced management team with global development pipeline, and best-in-class
      contracting capabilities

           1,700 MW                                                      4,800 MW          $500M¹
     OPERATING OR UNDER                                                      DEVELOPMENT      SCALE
    CONSTRUCTION ASSETS                                                        PIPELINE    TRANSACTION

Transaction has been announced but has not yet closed.
1. Reflects gross equity capital deployed by BEP and its institutional partners.

                                                                                                         38
Global Solar Developer: market-leading solar development platform

•   Seller sought like-minded strategic partner with operational capabilities and industry
    experience
•   Significant growth optionality over the long-term
•   Self-funded model predicated on pipeline build-out with asset sales to capture a
    development premium

                                           TOOLKIT

                      Carve-out                    Partnership
                      Government Privatization     Development
                      Take-private                 Multi-technology
                      Development Pipeline         Platform
                      Bankruptcy Restructuring     Structured Transaction

                                                                                             39
We expect to earn our target returns with significant downside protection

 RISK

                                       Capital Scarcity
                                       Operational Complexity
                                       Technological Disruption

                                              VALUE-
                                              ENHANCING
                                              TOOLKIT

                                     • European YieldCo
          Contracted
         wind and solar              • Alberta Hydro
                                     • Global Solar Developer
                                                                  RETURNS
        6% to 9% IRR                     12% to 20% IRR

                                                                            40
Looking ahead, we will look to…

    Invest $4 billion into M&A and development over the next five years

    Grow all our regional platforms and achieve scale in Asia

    Build a leading distributed generation platform

    Continue to enhance our development capabilities across technologies

    Prioritize a disciplined approach to underwriting

                                                                           41
Proven Financial Strength

Wyatt Hartley
Managing Director & CFO

                            42
Our business has delivered strong results
      through economic cycles

                                            43
This is underpinned by the
lowest risk balance sheet in the sector

  BBB+                 80%                10-year
INVESTMENT GRADE   NON-RECOURSE DEBT   AVERAGE DEBT DURATION

                                                               44
…And $2.5 billion of available liquidity

$0.3B
CASH & MARKETABLE SECURITIES

                                       $2.2B
                                 CREDIT FACILITIES

                                                     45
We have the highest quality
  cash flows in the sector

                              46
We have simultaneously grown and de-risked our cash flows

                                 $1.32                                                                                 ~$2.50¹
                              FFO PER UNIT                                                                             FFO PER UNIT
                                                                                       10%
                                                                                       CAGR

                                   2%
                                 2%                                                                                    5%2%       11%
                       11%                        20%                                                             6%
                                                                                                                3%                                New York
                                                                                                                                                  12%
                                                                                                           6%
                                                                                                                                                  New England
                                                                                                                                                  10%
                                   2012                                                                  6%               2019
             21%                                                                                                                            31%   MISO
                                                                                                           6%                                     6%

                                                                                                                                                  PJM
                                                                                                                                                  3%
                                                                                                                10%
                                               43%
                                                                                                                            15%

                  Today a ~20% below LTA-hydrology year in any single market
                       would have less than a 2% impact on our FFO

                                  Canada Hydro                   U.S. Hydro²                  Brazil Hydro              Colombia Hydro
                                  Canada Wind                    U.S. Wind                    Europe Wind               LatAm & Asia Wind
                                  Europe & Asia Solar            North America Solar          Storage & Other
1) Last twelve months FFO
2) Lievre hydro, which sells into New England, is included in U.S. Hydro segment
                                                                                                                                                             47
…And diversified our foreign currency exposure

            2012 FX Exposure                               2019 FX Exposure
              Post-Hedging                                   Post-Hedging
                                                                              Brazil
                                 Brazil                                       15%
                                 29%
                                                                                       Colombia
                                                                                       10%
                                                                     26%
                                                                                        India
                                                                                        1%

    Fully
  Hedged                                           Fully
    71%                                          Hedged
                                                   74%

              In the event of a 10% depreciation in any single currency,
                          we have only 1% FFO exposure

                                                                                                48
We have access to flexible and
   diverse funding sources

                                 49
In the last five years, we have funded almost $3.5 billion of growth through…

                   Growth Capital                                    Funding Sources

                       Other Asia
    TerraForm Global                North America         Non-Recourse
                                    Hydro                 Up-financings                 Common
                                                                                        Equity

TerraForm
    Power
                                                    Corporate

                 ~$3.5B                    Brazil   Debt
                                                                     ~$3.5B
                                      Europe
                                                                                       Preferred
                                                          Capital Recyling             Equity
                   Isagen

                                                                                                   50
And in the last year alone,
we have raised $1.6 billion

                              51
Our operational know-how has allowed us to monetize assets for value…

                                                                $780M
                                                                CAPITAL RECYCLING
                                                        $1.6B
                                                                •   Select Canadian Hydro
                                                                •   Scottish Wind Development
                                                                •   South Africa Wind & Solar
                                                                •   Northern Ireland Wind¹
                                                                •   Portugal Wind¹
                                                                •   Thailand Solar¹
                                                                •   Malaysia Solar¹

1.   Reflects transactions signed but not yet closed.

                                                                                                52
We generated significant liquidity at the corporate level…

                                  $1.6B
$315M
CORPORATE DEBT

       …Including issuing 10-year and 30-year non-amortizing, green bonds
                at an interest rate of 3.38% and 4.29%, respectively

                                                                            53
Opportunistically issued preferred units…

$130M
PREFERRED EQUITY
                               $1.6B

                                            54
…And continue to prudently up-finance our perpetual hydro assets

$340M
NON-RECOURSE
UP-FINANCINGS

$65 million
W IND UP-FINANCING

$275 million
H YD R O U P - F I N A N C I N G
                                   $1.6B

                                                                   55
Our financial strength allows us to be
patient and target value enhancing
       growth opportunities

                                         56
We do not use excess leverage
 to achieve our target returns

                                 57
Meaning our risk-reward proposition is aligned with investors

                              BEP                          Peers

       Target Return          12% to 15%                   8% to 10%

       Credit Rating          Investment Grade             Sub-Investment Grade

       Average Corporate
                              10 years                     5 years¹
       Debt Maturity

       Non-Amortizing Debt    Backed by perpetual hydros   Mismatch with underlying asset profile

       Use of converts, tax
       equity and other       No                           Yes
       deferral structures

1.   U.S. YieldCos.

                                                                                                    58
Looking ahead, we are well positioned to
fund growth through diverse pools of capital

                                               59
Our priority funding sources over the next five years

                     ~$800M                                                      ~$500M
                     CORPORATE DEBT                                         PREFERRED UNITS
                     FFO YIELD: 5.0%¹                                             FFO YIELD: 6.5%¹

~$1,000M
ASSET-LEVEL UP-FINANCINGS
FFO YIELD: 4.5%
                                                    $4B
                                                                             ~$1,500M
                                                     5.5%                        ASSET SALES
                                                AVERAGE FFO YIELD                FFO YIELD: 7.0%
       ~$200M
       RETAINED CASH FLOW S

                                 While maintaining our investment grade rating

1.   Post-management fees.

                                                                                                     60
We are also facilitating
the broadening of our investor base

                                      61
Including a similar structure to the newly-announced BIPC

  …This will give shareholders the option to invest in our business either through a
         Partnership or through a newly created Canadian Corporation

                      Identical                        Fully exchangeable
               Dividends/distributions                     at any time

                      BEP                                 BEPC
             (LIMITED PARTNERSHIP)               (CANADIAN CORPORATION)

                                Brookfield Renewable

                       BEP LP units and BEPC shares would be
                             economically equivalent

                                                                                       62
We believe the creation of BEPC could lead to increased
demand and enhanced liquidity for Brookfield Renewable

We see a number of benefits to establishing BEPC:

    EXPANDED INVESTOR BASE
    Unlock potential investment from currently restricted investors

    BROADER INDEX INCLUSION
    Allow Brookfield Renewable to be eligible for Russell and MSCI indices and other ETFs

    TAX ADVANTAGES
    Certain investors would receive high after-tax yields

                                                                                            63
The number of value-enhancing
  opportunities is increasing

     And our stable financial profile positions
            us well to take advantage

 •   Investment grade balance sheet and significant liquidity
 •   Lowest risk and highest quality cash flows
 •   Access to diverse pools of capital

                                                                64
…Which supports significant growth visibility over the next five years

                                                                                           10%+
                                                                                 FFO PER UNIT GROW TH

                                                                                                                         3-5%

                                                                                                   3-5%
                10%+
                    CAGR
                                                                             2-4%
                                                       1-2%

            2012                 2019               Inflation             Margin   Development                     Acquisitions¹               2024
                                                   Escalation          Enhancement & Repowering

1. Assumes $4 billion deployed between development and M&A investments at target FFO yields of 11% to 13% and average funding costs of 5.5%.
Note: slide reflects FFO per unit.

                                                                                                                                                      65
This translates into the
 most attractive total return in the sector

  ~5%            10%+              ~15%
DISTRIBUTION     CASH FLOW           TOTAL
    YIELD         GROWTH            RETURN

                                              66
…With significant upside from
                yield compression

                       Yield   Unit Price

                       5.5%       $37

                       5.0%       $41       +25%

                       4.5%       $46

RENEWABLES     INTEREST RATE      GROWING            PRUDENT
 TAILWINDS      ENVIRONMENT    INVESTOR BASE       PAYOUT RATIO

                                                                  67
Summary and Q & A

Sachin Shah
Managing Partner & CEO

                         68
In summary…

          1   We have a large opportunity set

          2   We have a unique capability to execute
              on value-enhancement opportunities

          3   We have a stable financial profile that
              facilitates our growth

                                                        69
Q&A

      70
Notice to Recipients
All amounts are in U.S. dollars unless otherwise specified. Unless            the regulation of water supply; advances in technology that impair or           to hold its ownership interests in Brookfield Renewable; and
otherwise indicated, the statistical and financial data in this               eliminate the competitive advantage of our projects; an increase in             Brookfield Asset Management acting in a way that is not in the best
presentation is presented as of June 30, 2018, and on a                       the amount of uncontracted generation in our portfolio; industry risks          interests of Brookfield Renewable or our unitholders.
consolidated basis.                                                           relating to the power markets in which we operate; the termination of,
                                                                              or a change to, the MRE hydrological balancing pool in Brazil;                  We caution that the foregoing list of important factors that
CAUTIONARY STATEMENT REGARDING FORWARD- LOOKING                               increased regulation of our operations; concessions and licenses                may affect future results is not exhaustive. The forward-looking
STATEMENTS AND INFORMATION                                                    expiring and not being renewed or replaced on similar terms;                    statements represent our views as of the date of this presentation
This presentation contains “forward-looking information” within the           increases in the cost of operating our plants; our failure to comply            and should not be relied upon as representing our views as of any
meaning of Canadian provincial securities laws and “forward-looking           with conditions in, or our inability to maintain, governmental permits;         subsequent date. While we anticipate that subsequent events and
statements” within the meaning of Section 27A of the U.S.                     equipment failures, including relating to wind turbines and solar               developments may cause our views to change, we disclaim any
Securities Act of 1933, as amended, Section 21E of the U.S.                   panels; dam failures and the costs and potential liabilities associated         obligation to update the forward-looking statements, other than as
Securities Exchange Act of 1934, as amended, “safe harbor”                    with such failures; force majeure events; uninsurable losses and                required by applicable law. For further information on these known
provisions of the United States Private Securities Litigation Reform          higher insurance premiums; adverse changes in currency exchange                 and unknown risks, please see “Risk Factors” included in our Form
Act of 1995 and in any applicable Canadian securities regulations.            rates and our inability to effectively manage foreign currency                  20-F.
Forward-looking statements include statements that are predictive             exposure; availability and access to interconnection facilities and
in nature, depend upon or refer to future events or conditions, and           transmission systems; health, safety, security and environmental                CAUTIONARY STATEMENT REGARDING USE OF NON-
include statements regarding our and our subsidiaries’ operations,            risks; disputes, governmental and regulatory investigations and                 IFRS MEASURES
business, financial condition, expected financial results,                    litigation; counterparties to our contracts not fulfilling their obligations;   This presentation contains references to financial metrics that are not
performance, growth prospects and distribution profile, expected              the time and expense of enforcing contracts against nonperforming               calculated in accordance with, and do not have any standardized
liquidity, the expected closing of our joint venture with respect to X-       counter-parties and the uncertainty of success; our operations being            meaning prescribed by, International Financial Reporting Standards
Elio and our development plans for the company’s solar capacity,              affected by local communities; fraud, bribery, corruption, other illegal        (“IFRS”). We believe such non-IFRS measures including, but not
the expected closing of TerraForm Power’s acquisition of a U.S.               acts or inadequate or failed internal processes or systems; our                 limited to, funds from operations (“FFO”) and FFO per unit, are
distributed energy business and the expected benefits with respect            reliance on computerized business systems, which could expose us                useful supplemental measures that may assist investors and others
thereto, the expected closing of the sales of our remaining non-core          to cyber-attacks; newly developed technologies in which we invest               in assessing our financial performance and the financial
portfolios in South Africa and in Thailand and Malaysia, growth of            not performing as anticipated; labor disruptions and economically               performance of our subsidiaries. As these non-IFRS measures are
FFO (defined below), priorities, targets, ongoing objectives,                 unfavorable collective bargaining agreements; our inability to finance          not generally accepted accounting measures under IFRS,
strategies and outlook, as well as the outlook for North American             our operations due to the status of the capital markets; operating and          references to FFO and FFO per unit, as examples, are therefore
and international economies for the current fiscal year and                   financial restrictions imposed on us by our loan, debt and security             unlikely to be comparable to similar measures presented by other
subsequent periods, and include, but are not               limited to,        agreements; changes to our credit ratings; our inability to identify            issuers and entities. These non-IFRS measures have limitations as
statements regarding our asset management. In some cases,                     sufficient investment opportunities and complete transactions; the              analytical tools. They should not be considered as the sole
forward-looking statements can be identified by terms such as                 growth of our portfolio and our inability to realize the expected               measure of our performance and should not be considered in
“expects,” “plans,” “estimates,” “seeks,” “targets,” “projects,” “grow”       benefits of our transactions or acquisitions; our inability to develop          isolation from, or as a substitute for, analysis of our financial
or negative versions thereof and other similar expressions, or future         greenfield projects or find new sites suitable for the development of           statements prepared in accordance with IFRS. For a reconciliation
or conditional verbs such as “may,” “will,” “should,” “would” and             greenfield projects; delays, cost overruns and other problems                   of FFO and FFO per Unit to the most directly comparable IFRS
“could.”                                                                      associated with the construction and operation of generating facilities         measure, please see “Financial Performance Review on
                                                                              and risks associated with the arrangements we enter into with                   Proportionate Information – Reconciliation of Non-IFRS Measures”
Although we believe that our anticipated future results, performance          communities and joint venture partners; Brookfield Asset                        included in our annual report on Form 20-F and “Part 4 - Financial
or achievements expressed or implied by the forward-looking                   Management’s election not to source acquisition opportunities for us            Performance Review on Proportionate Information – Reconciliation
statements and information are based upon reasonable                          and our lack of access to all renewable power acquisitions that                 of non-IFRS measures” in our management’s discussion and
assumptions and expectations, the reader should not place undue               Brookfield Asset Management identifies; we do not have control over             analysis for the three and six months ended June 30, 2019.
reliance on forward- looking statements and information because               all our operations or investments; political instability, changes in
                                                                                                                                                              References to Brookfield Renewable are to Brookfield Renewable
they involve known and unknown risks, uncertainties and other                 government policy, or unfamiliar cultural factors could adversely
                                                                                                                                                              Partners L.P. together with its subsidiary and operating entities
factors, many of which are beyond our control, which may cause                impact the value of our investments; foreign laws or regulation to
                                                                                                                                                              unless the context reflects otherwise.
our and our subsidiaries’ actual results, performance or                      which we become subject as a result of future acquisitions in new
achievements to differ materially from anticipated future results,            markets; changes to government policies that provide incentives for
performance or achievements expressed or implied by such                      renewable energy; a decline in the value of our investments in
forward-looking statements and information.                                   securities, including publicly traded securities of other companies; we
                                                                              are not subject to the same disclosure requirements as a U.S.
Factors that could cause actual results to differ materially from those       domestic issuer; the separation of economic interest from control
contemplated or implied by forward-looking statements include, but            within our organizational structure; the incurrence of debt at multiple
are not limited to, the following: changes to hydrology at our                levels within our organizational structure; being deemed an
hydroelectric facilities, to wind conditions at our wind energy facilities,   “investment company” under the U.S. Investment Company Act of
to irradiance at our solar facilities or to weather generally as a result     1940; the effectiveness of our internal controls over financial
of climate change or otherwise at any of our facilities; volatility in        reporting; our dependence on Brookfield Asset Management and
supply and demand in the energy markets; our inability to re-                 Brookfield Asset Management’s significant influence over us; the
negotiate or replace expiring power purchase agreements on similar            departure of some or all of Brookfield Asset Management’s key
terms; increases in water rental costs (or similar fees) or changes to        professionals; changes in how Brookfield Asset Management elects

                                                                                                                                                                                                                                    71
You can also read