FOUR CORNERS PROPERTY TRUST - NYSE: FCPT
←
→
Page content transcription
If your browser does not render page correctly, please read the page content below
FOUR CORNERS PROPERTY TRUST
        NYSE: FCPT

  I N V E S T O R P R E S E N T AT I O N | AP R I L 2 0 1 6   w w w . f o u r c o r n e r s p r o p e r t yt r u s t . c o m

1 | FOUR CORNERS PROPERTY TRUST | APRIL 2016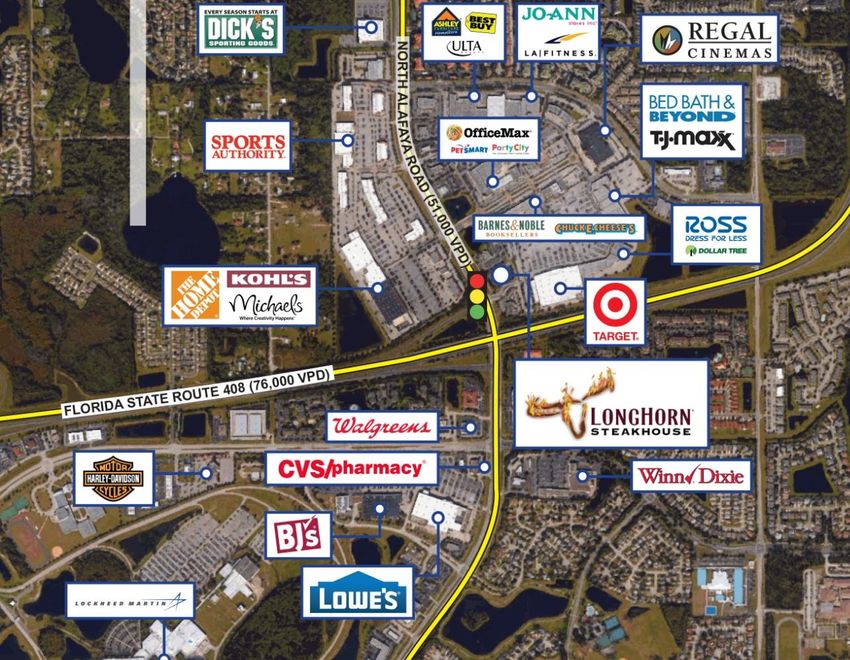
F O R W AR D L O O K I N G S T AT E M E N T S
AN D D I S C L AI M E R S

Cautionary Note Regarding Forward-Looking Statements:
This presentation contains forward-looking statements within the meaning of the federal securities laws. Forward-looking statements include all
statements that are not historical statements of fact and those regarding the Company’s intent, belief or expectations, including, but not limited
to, statements regarding: operating and financial performance; and expectations regarding the making of distributions and the payment of
dividends. Words such as “anticipate(s),” “expect(s),” “intend(s),” “plan(s),” “believe(s),” “may,” “will,” “would,” “could,” “should,” “seek(s)” and
similar expressions, or the negative of these terms, are intended to identify such forward-looking statements. Forward-looking statements speak
only as of the date on which such statements are made and, except in the normal course of the Company’s public disclosure obligations, the
Company expressly disclaims any obligation to publicly release any updates or revisions to any forward-looking statements to reflect any
change in the Company’s expectations or any change in events, conditions or circumstances on which any statement is based. Forward-looking
statements are based on management’s current expectations and beliefs and the Company can give no assurance that its expectations or the
events described will occur as described. Forward-looking statements are subject to a number of risks and uncertainties that could cause actual
results to differ materially from those set forth in or implied by such forward-looking statements. Factors that could have a material adverse
effect on the Company’s operations and future prospects or that could cause actual results to differ materially from the Company’s expectations
are included in the sections entitled “Business,” “Risk Factors” and “Management’s Discussion and Analysis of Financial Condition and Results
of Operations” of the Company’s Annual Report on Form 10-K filed with the Securities and Exchange Commission on March 22, 2016.

Notice Regarding Non-GAAP Financial Measures:
The information in this communication contains and refer to certain non-GAAP financial measures, including FFO and AFFO. These non-GAAP
financial measures are in addition to, not a substitute for or superior to, measures of financial performance prepared in accordance with GAAP.
These non-GAAP financial measures should not be considered replacements for, and should be read together with, the most comparable GAAP
financial measures. Reconciliations to the most directly comparable GAAP financial measures and statements of why management believes
these measures are useful to investors are included in the supplemental financial and operating report, which can be found in the investor
relations section of our website at www.fourcornerspropertytrust.com.

2 | FOUR CORNERS PROPERTY TRUST | APRIL 2016
S E N I O R M AN A G E M E N T T E AM
Former Board member and Chair of the Finance and Real Estate Committee at Darden Restaurants,
Inc.
Private investor in net lease retail real estate
William Lenehan Member of the Board of Directors of Macy’s, Inc.
President and CEO
Former Board member and Chairman of the Investment Committee at Gramercy Property Trust, Inc.
Former CEO of Granite REIT, an investment grade single-tenant, triple-net REIT listed on the TSX
Ten years at Farallon Capital Management
B.A. from the Claremont McKenna College
Former CFO of Amstar Advisers, served on Amstar’s Executive and Investment Committees
Former Managing Director of Financial Strategy & Planning at Prologis, Inc.
Former President and CFO of American Residential Communities
Gerald Morgan Served as a Senior Officer with Archstone prior to the company’s sale
CFO
B.S. in Mechanical Engineering and MBA from Stanford University
Former Partner in the real estate department at the law firm of Pircher, Nichols & Meeks where he had
practiced since 1998
B.A. from Macalester College
James Brat Juris Doctorate from the UCLA School of Law
General Counsel
3 | FOUR CORNERS PROPERTY TRUST | APRIL 2016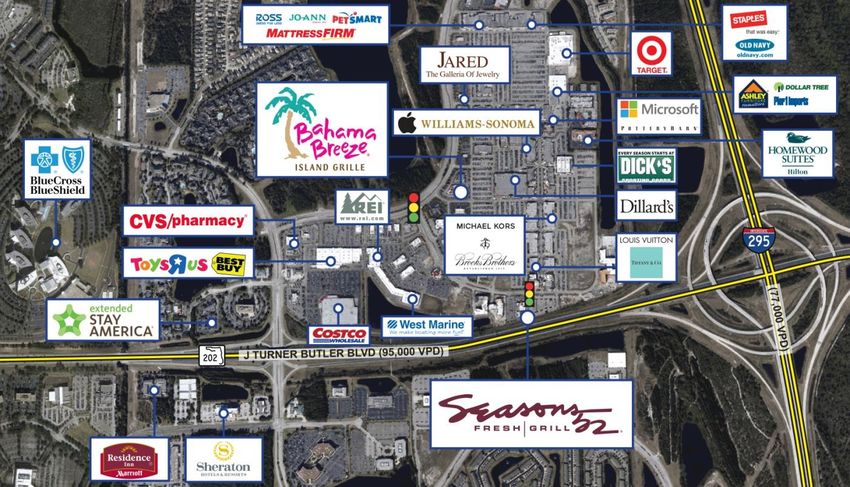
KEY INVESTMENT HIGHLIGHTS

      Well-located high-quality assets, diversified by geography and brand

 Long-term, triple-net lease structure provides stable cash flow with embedded
                                     rent growth

 Investment grade tenant with best in class EBITDAR coverage and appropriate
                                       rents

 Significant external growth potential in fragmented restaurant real estate sector

   Strong balance sheet with low leverage and capacity to support growth and
                              diversification strategy

    Highly regarded leadership with extensive retail net lease and public REIT
                                    experience

   2016 announced annual dividend of $0.97 per share, a CAD payout of ~80%

4 | FOUR CORNERS PROPERTY TRUST | APRIL 2016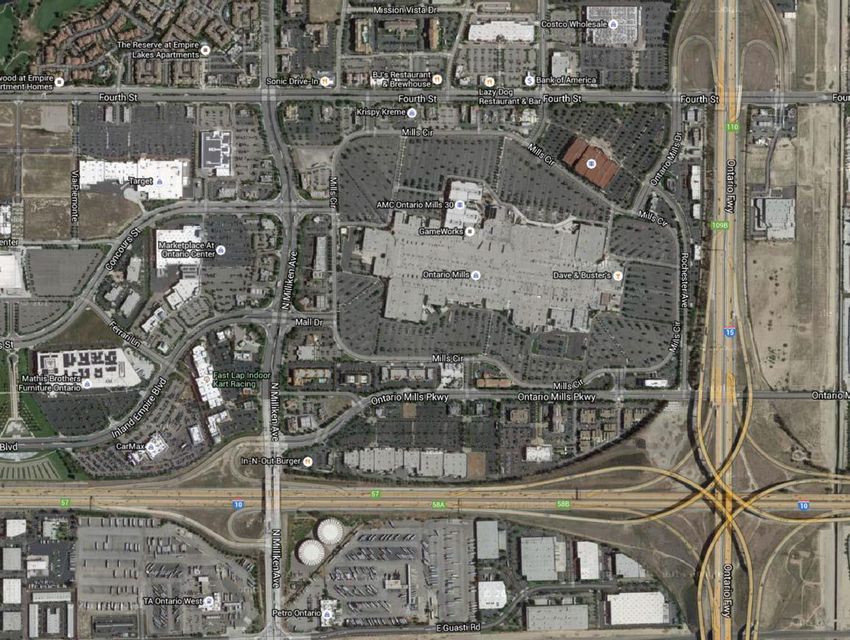
AS S E T S E L E C T I O N
Darden performed an extensive asset selection process to determine which
properties were ultimately transferred to FCPT
Asset Selection
(# of Properties)
1,534
Select filtering criteria included: Sold individually over a few months
Fully Leased Operating below a minimum Average cap rate of 5.4% with a range
(260) EBITDAR margin threshold of 4.5% to 6.0%
1.0% annual rent growth vs.1.5% for
Identified as Darden locations FCPT
that may be relocated
Not guaranteed by Darden
New restaurants without long- Corporate headquarters sold
term performance data separately
Ground
Leased
(704)
(88)
(64) 418
Total Darden Leased and Ground Select Filtering Individual Sale Transferred
Restaurants Leased Criteria Leaseback to FCPT
5 | FOUR CORNERS PROPERTY TRUST | APRIL 2016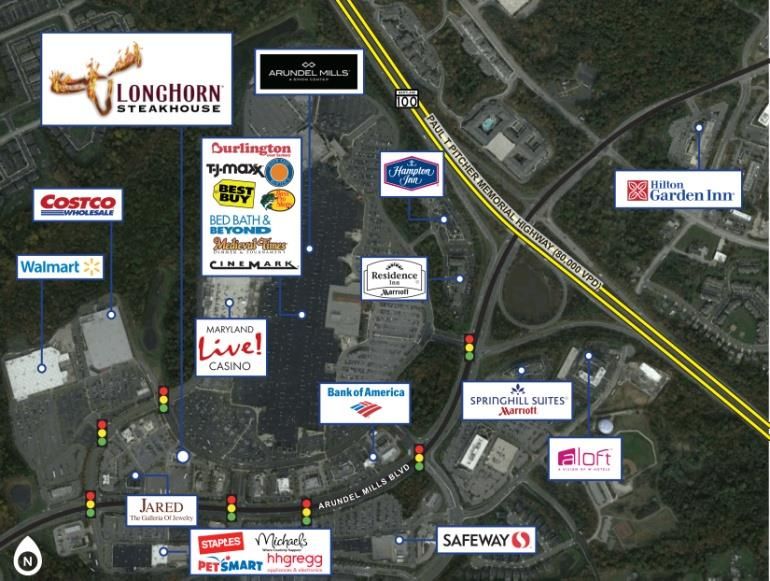
G E O G R AP H I C D I V E R S I F I C AT I O N

     418 Properties (1)

                44 States

                 5 Brands
                                                                             Olive Garden (300)
                                                                             LongHorn Steakhouse (104)       (1)

                                                                             Bahama Breeze (11)
                                                                             Seasons 52 (2)
             3.3mm sq ft                                                     Wildfish Seafood Grille (1)

                                                  Locations in 41 of the top 50 MSAs (2) in the U.S.
___________________________
1. Excludes six owned or ground leased properties that comprise the LongHorn San Antonio Business, which are operated by a taxable REIT subsidiary (“TRS”).
2. Source: Darden Restaurants management; Ranked by population.

 6 | FOUR CORNERS PROPERTY TRUST | APRIL 2016
P O R T F O L I O D I V E R S I F I C AT I O N

Four Corners’ portfolio is diversified by brand and region across the United States
                              Average rent PSF (by brand) (1)                                                                        Rental Revenue by Brand (1)

 $40            $38                  $38                  $37
 $35                                                                            $32                                                                       0.7%
 $30                                                                                                 $27                                           4.7%             0.3%
 $25
 $20
 $15
                                                                                                                                   19.9%
 $10
   $5
   $0                                                                                                                                                                        74.3%

Average
annual rent    $406k                $349k                 $318k                $180k                 $234k
/ unit                                                                                                                                  Total Rental Revenue: $94.4mm

                            Average rent PSF (by region) (1)(2)                                                                  Rental Revenue by Geography (1)
                                                                                                                                                                       FL
 $35
                $31                  $31                  $30                                                                                                         14%
 $30                                                                            $28
                                                                                                     $25
 $25                                                                                                                                                                              TX
 $20                                                                                                                                                                             12%
 $15
                                                                                                                                        Other
 $10                                                                                                                                    59%                                    GA
                                                                                                                                                                               8%
   $5
                                                                                                                                                                            OH
   $0                                                                                                                                                                       7%
               West               Southeast            Northeast               South               Midwest
Average
annual rent      $269k                $226k                  $231k                 $238k               $203k                                Total Rental Revenue: $94.4mm
/ unit
___________________________
1.     Excludes six owned or ground leased properties that comprise the LongHorn San Antonio Business, which will be operated by a taxable REIT subsidiary (“TRS”) after FCPT becomes a REIT.
2.     West includes AK, AZ, CA, CO, HI, ID, MT, NV, NM, OR, UT, WA, WY; Southeast includes AL, FL, GA, KY, MS, NC, SC, WV, VA, TN; Northeast includes VT, RI, PA, NY, NJ, NH, MA, MD, ME,
       DC, DE, CT; South includes AR, LA, OK, TX; Midwest includes IL, IN, IA, KS, MI, MN, MO, OH, NE, ND, SD, WI.

 7 | FOUR CORNERS PROPERTY TRUST | APRIL 2016
P O R T F O L I O O P E R AT I N G P E R F O R M AN C E

       Four Corners’ portfolio is comprised of high-quality restaurant properties that
       demonstrate strong operating performance
                                                                                         EBITDAR Coverage (1)
                                                                                                                                                                                        5.9x
              6.0x

Four Corners Avg: 4.2x                                                                                                                   4.2x
            4.0x
                                          3.1x                                           3.6x
Peer Avg: 2.7x   (1)

              2.0x

              0.0x
                                      4th Quartile                                   3rd Quartile                                   2nd Quartile                                    Top Quartile

                                                                                       Average Unit Volumes (2)
         (In thousands)
                                                                                                                                                                                      $5,934
           $6,000

Four Corners Avg:                                                                                                                      $4,574
$4,397                                                                                 $3,935
          $4,000
Major Casual Dining                       $3,151
Avg: $3,009 (2)

           $2,000

                 $0
       ___________________________
                                      4th Quartile                                   3rd Quartile                                   2nd Quartile                                    Top Quartile
       1. Peer average includes Agree Realty Corporation (ADC), National Retail Properties (NNN), Realty Income (O), Spirit Realty Capital (SRC) and Store Capital (STOR).
       2. Source: National Restaurant News Top 100; Note: Includes major casual dining peers with 200 units or above other than Darden concepts; comprised of Texas Roadhouse, PF Chang, Red Lobster, TGI
          Friday, Cracker Barrel, Outback Steakhouse, Buffalo Wild Wing, California Pizza Kitchen, Carrabba’s Italian Grill, Red Robin, Chili’s Grill & Bar, Logan’s Roadhouse, Applebee’s, O’Charley’s, Bob Evans,
          and Ruby Tuesday.

         8 | FOUR CORNERS PROPERTY TRUST | APRIL 2016
H I S T O R I C AL E B I T D AR R E N T C O V E R AG E

    Four Corners’ properties have proven to be resilient and performed well through
    various market cycles
                                                              Rent Coverage – Portfolio Average    (1) (2)

           5.3x               5.1x               5.2x
                                                                          4.8x        5.0x
                                                               4.8x                               4.8x                            Average:
                                                                                                             4.4x          4.2x     4.8x
                                                                                                                    4.0x

          2006               2007               2008          2009        2010        2011        2012       2013   2014   2015

                                                               Rent Coverage – Fourth Quartile (1) (2)

           3.5x                                                                       3.4x
                              3.3x               3.3x                                             3.3x
                                                                          3.0x                               3.0x          3.1x   Average:
                                                               2.8x                                                 2.8x            3.2x

          2006               2007               2008          2009        2010        2011        2012       2013   2014   2015
  Memo:
   Total   257                267                277           359         367        376         393        406    414    418
properties
    ___________________________
    Source: Management provided information.
    1. Weighted by rent.
    2. Backward-looking rent assumes 1.5% annual escalator.

      9 | FOUR CORNERS PROPERTY TRUST | APRIL 2016
C O M P E L L I N G D E M O G R AP H I C S

Four Corners has well-located properties with superior demographics; two important
indicators of asset quality
                                                    Average Population and Household Income (Three-Mile Radius)

                            $70,000                                               = $98k median household income and ~63,000 average population

                            $65,000
 Average Household Income

                            $60,000

                            $55,000
                                                                                                           +6%

                                                                                           +12%
                            $50,000                                     NNN REIT
                                                                          Avg.

                            $45,000

                            $40,000
                                  40,000   45,000       50,000            55,000             60,000              65,000             70,000   75,000   80,000   85,000
                                                                                       Average Population
___________________________
Source: Green Street Advisors.
Note: Peer average includes National Retail Properties (NNN), Realty Income (O), Spirit Realty Capital (SRC) and Store Capital (STOR).

 10 | F O U R C O R N E R S P R O P E R T Y T R U S T | A P R I L 2 0 1 6
D AR D E N : I N V E S T M E N T G R AD E W I T H
S T R O N G F I N AN C I AL P E R F O R M AN C E
Darden is rated Ba1/BBB-/BBB- (Moody’s/S&P/Fitch), representing an investment grade tenant profile
Following the spin-off, Darden only has $450mm of debt outstanding and no debt maturing until 2035
Recent strategic initiatives have driven strong operating and financial performance at Darden, enhancing its tenant appeal
18% of U.S. adults visited an Olive Garden in the last six months according to Morgan Stanley Research
Positive Sales Growth and Profit Growth Across All Segments (FY 15 Q2 vs. FY 16 Q2)
(Sales in millions) Fine Dining Other
1.2% (1)
(1)
5.6%
$882 $892
$365 8.1%
$346
2.4% $228
$211
$120 $123
FY15 Q2 FY16 Q2 FY15 Q2 FY16 Q2 FY15 Q2 FY16 Q2 FY15 Q2 FY16 Q2
Segment Profitability (2)
Profit $140.5 $157.1 $42.8 $54.8 $21.1 $22.4 $23.0 $32.3
Margin 15.9% 17.6% 12.4% 15.0% 17.5% 18.2% 10.9% 14.2%
Growth 11.8% 28.0% 6.2% 40.4%
___________________________
Source: Company filings as of 11/29/2015.
Note: Yard House and Capital Grill properties will not be part of the initial spin-off of Four Corners Property Trust.
1. Same-restaurant sales for Olive Garden and LongHorn Steakhouse on a comparable calendar basis were 2.8% and 3.6%, respectively.
2. Segment profitability is defined as sales less restaurant and marketing expenses.
11 | F O U R C O R N E R S P R O P E R T Y T R U S T | A P R I L 2 0 1 6S U M M AR Y L E AS E T E R M S AN D
STRUCTURE
Summary of Key Terms
Average Initial Term: ~15 years, none less than 12
Initial annual cash rent: $94,388,553
Individual property triple-net leases: Tenant responsible for repair and maintenance
costs, property tax, insurance and restoration
Structure:
Form of lease included as exhibit in Four Corners 10-K
Duration of Renewal Options: Typically five years; however, duration varies by property based on initial lease term (1)
Number of Renewal Options: No more than five
1.5%, every December 1st starting 12/1/2016, plus a FMV adjustment at the start of the
Annual Rent Escalation:
fourth and fifth renewal options (if applicable)
Financial Performance Reporting: Tenant required to report sales per property on a go forward basis
___________________________
1. 34 year max lease term in CA; 29 year max lease term in PA.
12 | F O U R C O R N E R S P R O P E R T Y T R U S T | A P R I L 2 0 1 6L E AS E M AT U R I T Y S C H E D U L E
Lease Maturity Schedule (% of Rental Revenue)
20%
17.1%
16.6% 16.4%
15.4%
15%
13.8%
Weighted average lease
term of ~15 years
10.6%
10.2%
10%
5%
0.0% 0.0% 0.0% 0.0% 0.0% 0.0% 0.0% 0.0% 0.0% 0.0% 0.0%
0%
Lease Term: 1 2 3 4 5 6 7 8 9 10 11 12 13 14 15 16 17 18
(Years)
2016 2017 2018 2019 2020 2021 2022 2023 2024 2025 2026 2027 2028 2029 2030 2031 2032 2033
___________________________
Note: Excludes renewal options.
13 | F O U R C O R N E R S P R O P E R T Y T R U S T | A P R I L 2 0 1 6P O S I T I O N I N G R E L AT I V E T O N E T L E AS E
PEERS
Four Corners compares favorably to its retail net lease REIT peer group
EBITDAR Coverage (1) % Investment Grade Tenants (2)
100%
5.0x 100%
4.2x
Peer Average: 2.7x Peer Average: 46%
4.0x 80%
3.0x
3.0x 2.7x 2.8x
2.5x 2.6x 60%
44% 47%
2.0x 40%
1.0x 20%
N/A N/A N/A
0.0x 0%
% Retail Properties Weighted Average Lease Term (2)
100% 100% (In years)
Peer Average: 78%
100% 92% 20
79%
80% Peer Average: 12 yrs
62% 15 15
(3)
59% 15
60%
12 12
11
40% 10
10
20%
0% 5
___________________________
Source: Company filings as of 09/30/2015.
1. STOR and VER EBITDAR coverage represents a unit’s fixed charge coverage ratio before taking into account standardized corporate overhead expense. Fixed charge coverage is defined as the
ratio of (i) the unit’s EBITDAR, less corporate overhead expense based on industry standards, to (ii) the unit’s total fixed charges, which are its lease expense, interest expense and scheduled
principal payments on indebtedness.
2. Based on annualized base rent. Four Corners classifies investment grade tenants as a tenant with at least one investment grade rating from Moody’s, S&P or Fitch, in line with industry practices.
3. Includes retail, restaurant, healthcare, and movie theatre properties.
14 | F O U R C O R N E R S P R O P E R T Y T R U S T | A P R I L 2 0 1 6B U S I N E S S P L AN AN D D I V E R S I F I C AT I O N
S T R AT E G Y
Four Corners has a core portfolio that provides stable cash flow, as well as a strong
balance sheet to support diversification through external growth
Harvest organic cash flow growth from initial portfolio of triple-net leases
− Individual leases allow for maximum flexibility in resetting rent levels and laddering expiration dates
− Built-in 1.5% rent escalators and fair market value adjustments provide organic growth
Capitalize on robust market opportunity in the highly-fragmented restaurant real estate industry with a trend
towards “asset-light” business model for operators
− “Sharpshooter” advantage as the only REIT specializing in restaurant real estate with in-house operations team
Acquire additional complementary real estate assets to diversify tenant base
− Develop new tenant relationships
− Finance franchisee expansion
Maintain conservative and flexible balance sheet
− Low leveraged balance sheet with substantial liquidity to support growth and diversification strategy
− Unencumbered properties allows for efficient purchases and sales
− Conservative payout ratio
− UPREIT structure provides opportunity to use OP units as acquisition currency
Achieve accretive growth and diversification through active capital recycling
15 | F O U R C O R N E R S P R O P E R T Y T R U S T | A P R I L 2 0 1 6N U M E R O U S P AT H S T O D I V E R S I F I C AT I O N
Four Corners is committed to diversification by capitalizing on the numerous entry
points within the highly fragmented restaurant real estate industry
Sale-leasebacks with
other third-party Acquisitions or asset
restaurant operators swaps in the 1031
including ability to issue exchange market
OP units to sellers
Complementary
Acquisitions of triple-net
acquisitions of properties
lease properties or
in related “food service”
portfolios from other real
industries, leased on a
estate owners
triple-net basis
Strategic partner and Capital investment
financing for
capital provider to
development or
facilitate consolidation
redevelopment projects
in highly fragmented for existing and future
restaurant industry tenants
16 | F O U R C O R N E R S P R O P E R T Y T R U S T | A P R I L 2 0 1 6S U M M AR Y P R O F O R M A F I N AN C I AL
METRICS
Summary Pro Forma Financial Metrics
Annualized Value per Fully
($mm, except percentage and per share figures) Current Portfolio (1) Diluted Share (2)
Rental income (cash) $94.4
General & administrative expenses (3) (10.3)
Real estate operating costs 0.0
Cash EBITDA $84.1
Interest expense (4) (15.1)
Straight-line rental revenue 10.4
FFO $79.4 $1.32
Less Straight-line rental revenue (10.4)
Plus non-cash amortization of deferred financing costs 1.6
Less capital expenditures 0.0
AFFO $70.6 $1.18
Dividend $58.2 $0.97
Payout 82%
Memo: After-tax impact of Kerrow Holdings (5) $0.6 $0.01
___________________________
1. Annualized metrics are used for illustrative purposes only, are not forecasts and may not reflect actual results, which may vary to a material extent.
2. Based on 59.8 million shares outstanding plus 0.1 million of restricted stock unit and restricted stock grants made to the Company’s directors and management.
3. Non-cash stock-based compensation and acquisition costs are not included in these estimated amounts.
4. Includes non-cash interest.
5. Not included in the real estate financial metrics above.
17 | F O U R C O R N E R S P R O P E R T Y T R U S T | A P R I L 2 0 1 6F L E X I B L E C AP I T AL S T R U C T U R E
POISED FOR GROWTH
Four Corners has low leverage and substantial liquidity to support its growth and
diversification strategy
Capitalization Leverage Relative to Net Lease Peers (2)
(In millions)
10.0x
Fully Diluted Shares Outstanding (1) 60.0
Share Price as of March 30, 2016 $18.25
8.0x
Equity Market Capitalization $1,095 8.0x
0.9x
Debt 6.8x
$350 Million Revolver, due 2019 $0 6.1x
5.9x
6.0x
$400 Million Term Loan A, due 2020 400 5.5x
0.4x 1.3x
Total Debt $400 4.6x
Less: Operating cash and equivalents (10)
4.0x
Net Debt $390 6.8x 7.1x
6.1x
Enterprise Value $1,485
5.0x
4.6x 4.6x
Liquidity / Leverage / Coverage 2.0x
Liquidity (Operating Cash + Undrawn Capacity) $360
Net Debt / Enterprise Value 24.2%
0.0x
Net Debt / Cash EBITDA 4.6x
FCPT O NNN STOR SRC VER
Fixed Charge Coverage 6.2x
Net Debt/EBITDA Net Debt + Pfd./EBITDA
___________________________
1. Based on 59.8 million shares outstanding plus 0.1 million of restricted stock unit and restricted stock grants made to the Four Corners’ directors and management.
2. Based on Company filings as of 9/30/2015 pro forma for subsequent financing events.
18 | F O U R C O R N E R S P R O P E R T Y T R U S T | A P R I L 2 0 1 6S U M M AR Y C R E D I T S T R E N G T H S
High Quality Well-located assets diversified geographically across 44 states in the U.S.
Portfolio
Property-level revenue approximately 50% above casual dining peers
Diversified by
Geography and Success in recent one-off sale leasebacks of Olive Garden and LongHorn-
brand stores at strong valuations; properties are valuable and liquid
Brand
Individual long-term, triple-net lease structure with corporate guarantee
Average lease structure
Strong and 15-year average initial lease term with no lease less than 12 years
Stable Annual escalators of 1.5%
Cash Flow
Stable tenant with 100% occupancy
Best-in-class EBITDAR coverage and appropriate market rents
Darden is rated Ba1/BBB-/BBB-, representing an investment grade profile
Investment Grade
Darden has low indebtedness with no debt maturities until 2035
Tenant
EBITDAR coverage above 4.2x on leases with no single property below 2.7x
Leverage of approximately 4.6x Net Debt / Cash EBITDA
Attractive 100% unencumbered asset base
Financial Substantial liquidity with cash on balance sheet and a $350mm fully undrawn
Profile revolver
Strong dividend coverage with conservative CAD payout ratio of ~80%
Highly regarded leadership with extensive retail net lease and public market
Experienced REIT experience
Management Board with significant relevant experience and a strong track record
Team
Best-in-class corporate governance
19 | F O U R C O R N E R S P R O P E R T Y T R U S T | A P R I L 2 0 1 6S T R O N G C O R P O R AT E G O V E R N AN C E
The Company has an experienced, independent board and corporate governance
practices in line with best-in-class REIT standards
Majority independent directors “Four Corners has implemented good governance practices, i.e., opting of out of MUTA,
and would likely show well using Green Street’s scoring methodology.” – Green Street
Advisors, December 2015
Annual elections of all board members
No stockholder rights plan (1) “From a governance perspective, the company is clean as a whistle: no poison pill, opted
out of all Maryland anti-takeover provisions, and a declassified board of directors that is
Opt out of Maryland anti-takeover provisions predominantly independent.” – FCPT shareholder letter to its investors, January 2016
Board of Directors
John Moody, Chairman Marran Ogilvie, Director, Governance committee chair
Lead Independent Director of Potlatch Corporation Advisor to the Creditors Committee for the Lehman Brothers
(NASDAQ: PCH) International (Europe) Administration since 2008
Director of Huron Consulting Group (NASDAQ: HURN) Director of Seventy Seven Energy Inc. (NYSE: SSE),
President and CEO of Cornerstone Properties, 1991 – 2000 2014 – Present
President of Marsh & McLennan Real Estate Advisors, Inc, Director of Zais Financial Corporation (NYSE: ZFS),
2001 – 2004 2013 – Present
William Lenehan, Director Paul Szurek, Director, Audit committee chair
President and CEO of Four Corners Lead Independent Director of CoreSite Realty Corp. (NYSE:
Former CEO of Granite REIT COR), 2010 – Present
Investment professional at Farallon Management from CFO of Biltmore Farms LLC., 2003 - Present
2001 – 2011
Doug Hansen, Director, Investment committee chair
Founder and President of Redwood Trust, Inc. (NYSE:
RWT), 1994 – 2008
Vice Chairman of Redwood Trust, 2008 – Present
___________________________
1. Four Corners’ charter will contain certain restrictions relating to the ownership and transfer of its stock, including a provision generally restricting shareholders from owning more than 9.8% in value or in
number of the outstanding shares of Four Corners’ common stock (whichever is more restrictive).
20 | F O U R C O R N E R S P R O P E R T Y T R U S T | A P R I L 2 0 1 6KEY INVESTMENT HIGHLIGHTS
Well-located high-quality assets, diversified by geography and brand
Long-term, triple-net lease structure provides stable cash flow with embedded
rent growth
Investment grade tenant with best in class EBITDAR coverage and appropriate
rents
Significant external growth potential in fragmented restaurant real estate sector
Strong balance sheet with low leverage and capacity to support growth and
diversification strategy
Highly regarded leadership with extensive retail net lease and public REIT
experience
2016 announced annual dividend of $0.97 per share, a CAD payout of ~80%
21 | F O U R C O R N E R S P R O P E R T Y T R U S T | A P R I L 2 0 1 6QC
UOEM
S TPAN
I O NY AN
O VDE AN
RV S
I EW
WE RCO AP MNPAN PE D I XY O V E RV I E W
C AS E S T U D Y : O L I V E G AR D E N
( O N T AR I O , C A)

                                                                                          Property Highlights
                                                                           • Located within the Los Angeles MSA
                                                                           • Immediate proximity to the Interstate 15 and
                                                                             Interstate 10 Interchange (463,000 VPD)
                                                                           • Outparcel to the Ontario Mills, a 1.4 million SF outlet
                                                                             mall that features AMC Theatres, Burlington Coat
                                                                             Factory, Dave & Busters, Sports Authority, Q Outlet
                                                                             and Marshalls
                                                                             • Ontario Mills is jointly owned and managed by
                                                                               Simon Property Group
                                                                             • GSA Mall Quality Rating: “A”
                                                                             • Mall Sales / S.F of $590 vs. MSA Average of $531
                                                                           • Approximately three miles from the LA/Ontario
                                                                             International Airport
                                                                           • Strong rent-to-sales ratio
                                                                           • Attractive demographics with 270K people living
                                                                             within a 5-mile radius

                                                                                               Key Statistics
                                                                           Restaurant Brand                           Olive Garden
                                                                           Location                                    Ontario, CA
                                                                           MSA                                        Los Angeles
                                                                           SF                                                8,027
                                                                           Year Built                                         2003
                                                                           Annual Escalators                                  1.5%
                                                                           Demographics (3-mile)
                                                                           Total Population                                     58K
                                                                           Median Household Income                             $63K

24 | F O U R C O R N E R S P R O P E R T Y T R U S T | A P R I L 2 0 1 6
C AS E S T U D Y : L O N G H O R N S T E AK H O U S E
( H AN O V E R , M D )
Property Highlights
• Trophy property located within the Baltimore-
Washington MSA
• Outparcel to the Arundel Mills Outlet Mall, Maryland
Live! Casino, a Walmart and a Costco
• Arundel Mills is majority owned and managed by
Simon Property Group
• GSA Mall Quality Rating: “A”
• Mall Sales / S.F of $605 vs. MSA Average of $403
• ~5 miles from the Baltimore/Washington International
Thurgood Marshall Airport
• Recently constructed building (2011)
• Strong rent-to-sales ratio
• Attractive demographics with 121K people living
within a 5-mile radius
• Olive Garden next door with similar lease terms
recently sold at attractive levels
Key Statistics
Restaurant Brand LongHorn Steakhouse
Location Hanover, MD
MSA Baltimore
SF 5,695
Year Built 2011
Annual Escalators 1.5%
Demographics (3-mile)
Total Population 49K
Median Household Income $88K
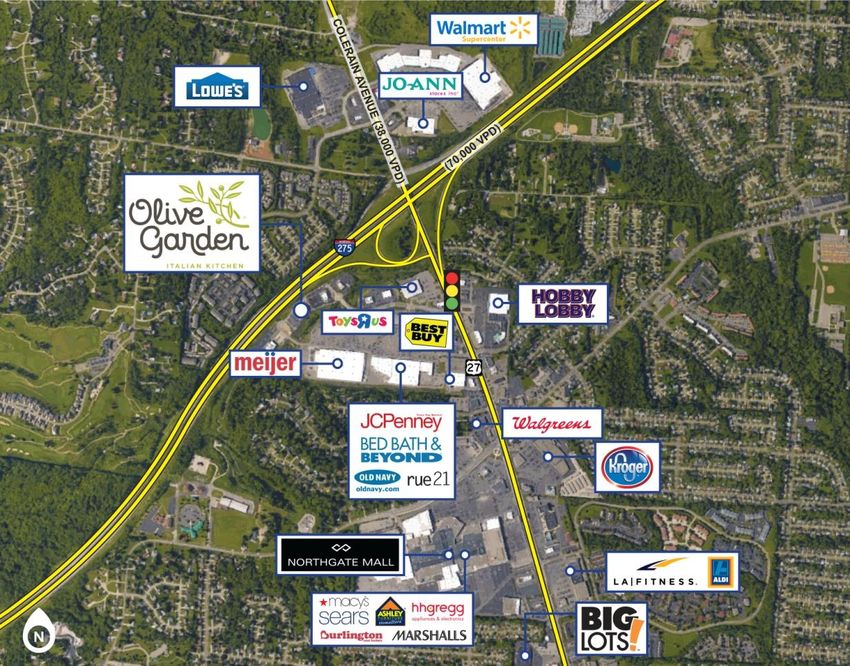
25 | F O U R C O R N E R S P R O P E R T Y T R U S T | A P R I L 2 0 1 6C AS E S T U D Y : O L I V E G AR D E N
(STONE CREEK, OH)
Property Highlights
• Located within the Cincinnati MSA
• Immediate proximity to Interstate 275 (70,000 VPD)
and Colerain Avenue exchange (38,000 VPD)
• Proximity to Bed Bath & Beyond, Regal Cinemas
Target and TJ Maxx
• Strong rent-to-sales ratio
• Attractive demographics with 48K people living within
a 3-mile radius
Key Statistics
Restaurant Brand Olive Garden
Location Stone Creek, OH
MSA Cincinnati
SF 7,441
Year Built 2008
Annual Escalators 1.5%
Demographics (3-mile)
Total Population 48K
Median Household Income $55K
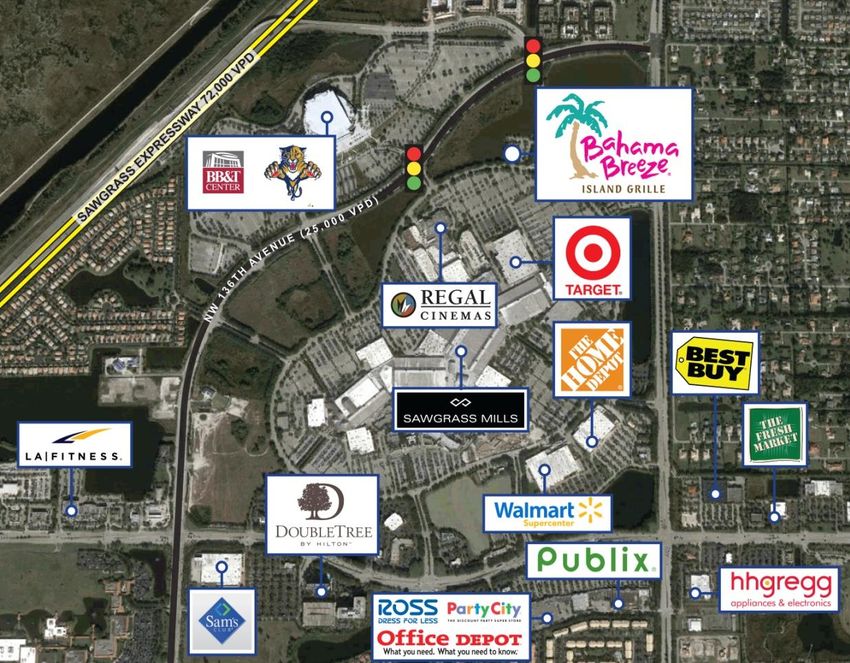
26 | F O U R C O R N E R S P R O P E R T Y T R U S T | A P R I L 2 0 1 6C AS E S T U D Y : B AH AM A B R E E Z E
(SUNRISE, FL)
Property Highlights
• Trophy property located within the Miami / Ft.
Lauderdale MSA
• Immediate proximity to the Sawgrass Expressway
(72,000 VPD)
• Outparcel to Sawgrass Mills, a 2.2 million SF outlet
mall owned by Simon Property Group featuring
Bloomingdales, Nordstrom Rack, Regal Cinemas,
Saks Off 5th and Target
• Proximity to BB&T Center, home of the Florida
Panthers
• Strong rent-to-sales ratio
• Attractive demographics with 863K people living
within a 10-mile radius
• Median household income within a 10-mile radius of
$71K
Key Statistics
Restaurant Brand Bahama Breeze
Location Sunrise, FL
MSA Miami / Ft. Lauderdale
SF 7,000
Year Built 2002
Annual Escalators 1.5%
Demographics (3-mile)
Total Population 71K
Median Household Income $66K
27 | F O U R C O R N E R S P R O P E R T Y T R U S T | A P R I L 2 0 1 6C AS E S T U D Y : S T . J O H N S T O W N C E N T E R
( J AC K S O N V I L L E , F L )
Key Highlights
• Trophy properties located within the
Jacksonville MSA
• Immediate proximity to the Interstate 295
(77,000 VPD) and J Turner Butler Boulevard
(95,000 VPD)
• Outparcel to St. Johns Town Center, a 1.4
million SF open air lifestyle center partially
owned and managed by Simon Property
Group
• Anchor tenants including: Dick’s Sporting
Goods, Dillard’s, DSW, Nordstrom, Ross
Dress for Less, Staples and Target
• Luxury tenants include Apple, Lacoste,
Louis Vutton, Michael Kors and Tiffany &
Company
• Strong rent-to-sales ratio
• Attractive demographics with 515K people
living within a 10-mile radius
• Median household income within a 10-mile
Bahama Breeze Key Statistics Season 52 Key Statistics radius of $73K
Restaurant Brand Bahama Breeze Restaurant Brand Seasons 52
Location Jacksonville, FL Location Jacksonville, FL
MSA Jacksonville MSA Jacksonville
SF 7,260 SF 9,356
Year Built 2010 Year Built 2011
Annual Escalators 1.5% Annual Escalators 1.5%
Demographics (3-mile) Demographics (3-mile)
Total Population 39K Total Population 56K
Median Household Income $60K Median Household Income $58K
28 | F O U R C O R N E R S P R O P E R T Y T R U S T | A P R I L 2 0 1 6C AS E S T U D Y : L O N G H O R N S T E AK H O U S E
( O R L AN D O , F L )
Property Highlights
• Located within Greater Orlando MSA
• Immediate proximity to Florida State Route 408
(78,000 VPD) and North Alafaya Road (51,000 VPD)
• Recently remodeled structure (2009)
• Strong rent-to-sales ratio
• Proximity to Bed Bath & Beyond, Regal Cinemas
Target and TJ Maxx
• Attractive demographics with 93K people living within
a 3-mile radius
Key Statistics
Restaurant Brand LongHorn Steakhouse
Location Orlando, FL
MSA Orlando
SF 4,993
Year Built / Remodeled 2000 / 2009
Annual Escalators 1.5%
Demographics (3-mile)
Total Population 93K
Median Household Income $49K
29 | F O U R C O R N E R S P R O P E R T Y T R U S T | A P R I L 2 0 1 6You can also read