INVESTOR PRESENTATION - March 2021 - mavicompany.com

Page created by Yolanda Richards
 
CONTINUE READING
INVESTOR PRESENTATION - March 2021 - mavicompany.com
INVESTOR PRESENTATION
       March 2021
INVESTOR PRESENTATION - March 2021 - mavicompany.com
Disclaimer
This document does not constitute or form part of any offer to sell or issue or invitation to purchase or subscribe for, or any solicitation of any offer to purchase
or subscribe for, any securities of the Company. The information, statements and opinions contained in this presentation do not constitute any advice or
recommendation regarding the securities of the Company, nor shall it or any part of it nor the fact of its distribution form the basis of, or be relied on in
connection with, any contract or investment decision.

To the extent available, the industry, market and competitive position data contained in this presentation come from official or third party sources. We have
not, however, independently verified the information in industry publications, market research or other publicly available information provided by third
parties, although we believe the information contained therein to be from reliable sources. In addition, certain of the industry, market and competitive
position data contained in this presentation come from our own internal research and estimates based on the knowledge and experience of the Company's
management in the markets in which we operate. Although we believe our internal estimates to be reasonable, these estimates have not been verified by
any independent sources. We cannot, therefore, assure you of their accuracy, or that a third party using different methods would obtain the same results.
Accordingly, you should not place undue reliance on any of the industry, market or competitive position data contained in this presentation. We do not
intend, and do not assume any obligation, to update industry, market or competitive position data set forth in this presentation. As a result, you should be
aware that data in this presentation and estimates based on those data may not be reliable indicators of future market performance or our future results.

This presentation includes forward-looking statements. Forward-looking statements provide current expectations of future events based on certain
assumptions and include any statement that does not directly relate to any historical or current fact. You can identify forward looking statements by their use
of words such as "anticipate", "estimate", "believe", "intend", "plan", "predict", "may", "will", "would", "should", "continue", "expect" and similar expressions,
although these expressions are not the exclusive means of identifying forward-looking statements. Forward looking statements involve risks, uncertainties and
other important factors over which we may have limited or no control. These factors could cause our actual results, performance or achievements to differ
materially from any future circumstances, results, performance or achievements expressed or implied by such statements. As a result, you should not place
undue reliance on such statements. Changes in customer tastes and spending patterns; changes in customer traffic; ability to accurately predict customer
preferences and demands; ability to successfully implement new store rollout and retail strategy; effectiveness of brand awareness and marketing
programmes; difficulties that can be observed in retail fashion and fragility that can be observed in customer loyalty; competitive factors in retail fashion;
impact of extreme unseasonal weather conditions on retail fashion; ability to retain key management and personnel; circumstances affecting relationships
with major suppliers and distributors; currency and interest rate risks and fluctuations and other changes in financial markets and macro economic
conditions; changes in tax rates, applicable laws and government policies and operational disruptions, natural disasters, wars, terrorist activities, work
stoppages, slowdowns or strikes are, without any limitation of the foregoing, among these risks, uuncertainties and other important factors. You can find
further details of the principal risks and uncertainties affecting the Company in the explanatory notes of financial statements and in the “Risk Management
and Internal Control System” section of the Annual Report. The forward-looking statements included in this presentation represent the Company's views as of
the date of this presentation. These views could change. In consequence, you should not rely on these forward-looking statements as representing the
Company's views as of any date after the date of this presentation.

The information and opinions contained in this presentation, including the forward-looking statements described above, are provided as at the date of this
presentation. They are subject to change without notice. The Company expressly disclaims any obligation to update any such information or opinions except
any obligation arising from applicable capital markets regulations. By reading this presentation or attending or listening to any relevant meeting, conference
call or podcast organized by the Company, you represent and warrant that you are a person to whom this presentation may lawfully be distributed, and you
agree to be bound by the provisions above.

                                                                                                                                                                   11
INVESTOR PRESENTATION - March 2021 - mavicompany.com
MAVI BUSINESS
OVERVIEW
INVESTOR PRESENTATION - March 2021 - mavicompany.com
Why We Believe Mavi is Exciting
Aspirational denim-centric lifestyle brand positioning, inspiring
the customer, employees and business partners.

Managing the quality and efficiency strategy with a focus on
sustainability and innovation as a priority. Effective supply chain and
flexible product planning, leveraging proximity to local manufacturers.

Strong retail network in Turkey, international presence, and global e-
commerce and omnichannel sales operations. Online experience in
Turkey and international markets, digital strategy to drive growth.

Effective and leading communication strategy and best-in-class
loyalty card management enhancing brand awareness.

Experienced management team, fast and result-oriented organizational
structure. Corporate culture, focused on reaching common goals,
embracing diversity, and responding to change while earning the trust of
the customers and business partners.

Strong and sustainable financial performance.

Mavi’s All Blue strategy, built on ‘sustainable growth through quality’ and
incorporated into the global brand culture, product structure and
company goals.
INVESTOR PRESENTATION - March 2021 - mavicompany.com
Highly Successful Lifestyle Brand…
                            Business Overview                                                          Key Metrics (2020)                  (inc.IFRS16)                        Brand & Product (2020)

◼ Started operations in Istanbul in 1991, Mavi today is globally
   recognized as a highly successful casual lifestyle brand
                                                                                                        TRY                               TRY
                                                                                                                                                                        #1                             c.58%
◼ With strong denim roots, Mavi has evolved into an                                                   2,402m                             392m                                                                  Lifestyle
                                                                                                                                                                            Brand

                                                                                                                                                                                                       c.42%
   international apparel and accessories brand, building its
                                                                                                          Revenue                           EBITDA                       Awareness with
   success on products of superior quality and perfect fit, with
                                                                                                                                                                          Top of Mind
   9.8m denim items sold globally in 2019 via c.5,500 POS                                             (16% Decline)                   (39% Decline)
                                                                                                                                                                             60+%2                            Denim All
◼ In Turkey, Mavi started its retailization in 2008 and recorded an
   exceptional growth track record since then, reaching 384
   mono-brand stores1 within Turkey
                                                                                                      (11%)                            110%                                                                  80%
◼ Internationally, Mavi has built a world class reputation for
   quality denim, leveraging an international distribution                                             Turkey Retail                        Online                                                             Local
   platform of 55 mono-brand               stores1   and strong wholesale and                          Same Stores                          Sales                                                             Sourcing
   online partners.
                                                                                                         Growth*                            Growth

◼ Extensive, best-in-class loyalty program (Kartus) with c.5.1m                                                                                                         33%            67%
   active loyalty cardholders
◼ 4,060 talented and dedicated employees with Mavi regarded                                                439                           0.2x                                                            5.1 M
   as employer of choice                                                                                Monobrand                       Net Debt /                                                 Active Loyalty
                                                                                                          Stores1                        EBITDA
                                                                                                                                                                                                  Card Members1

 Note: (*) Throughout the presentation, LFL represents directly operated retail stores in Turkey that have been opened for at least 12 months excluding revenues attributable to stores that were closed during any period within 12
 months. Same stores sales growth in 2020 include only open days . Points of Sales (POS) include the retail, franchise and wholesale channels. Gender and c.ategory mix Turkey retail only 1Includes retail stores and franchised stores
 as of 31 January 2021. 2 In Turkey; Mavi Brand Perception Report prepared by Future Bright, 2019; All participants were asked to answer the questions: “What is the first brand that comes into your mind for jeans?”

                                                                                                                                                                                                                                44
INVESTOR PRESENTATION - March 2021 - mavicompany.com
…With Strong International Presence

               Canada
  # Retail Stores: 4
  # Wholesale Doors: c.1,000
                                                               Europe
                                              # Retail Stores: 1
                                                                                                           Russia
                                                                                             # Retail Stores: 17
                                                                                                                                                 384
                                                                                                                                                Mono-Brand
                                              # Wholesale Doors: c.1,100                     # Franchised Stores: 15
  # FTEs: 66                                  # FTEs: 59                                                                                     Stores in Turkey
                                                                                             # Wholesale Doors: c.139
                                                                                             # FTEs: 142

                                                                                                                                                     55
                                                                                                                                         International Mono-
                                                                                                                                                Brand Stores

                                    US                                             Turkey                            Rest of the World
                                                                                                                                         c.4,500
                                                                                                                                               Points of Sale
                       # Wholesale Doors: c.1,200                  # Retail Stores: 320                        # Franchised Stores: 17
                       # FTEs: 65                                  # Franchised Stores: 64                     # Wholesale Doors: 37

                                                                                                                                              4,060
                                                                   # Wholesale Doors: c.500
                                                                   # FTEs: 3,729

                                                                                                                                                  Employees

                Note: As of 31 January 2021
                                                                                                                                                          55
INVESTOR PRESENTATION - March 2021 - mavicompany.com
RETAIL EXPERTISE
IN TURKEY
INVESTOR PRESENTATION - March 2021 - mavicompany.com
Multi Pillar Growth Strategy in Turkey Retail
•   Physical Space Growth                               Expansion of store space                                          LFL Growth*
    New Store Openings                                  Average Selling Space 500 sqm                                     Above 20% (Last 3 years)
    384 Stores in 80 Cities                             New Stores 600-800 sqm

                                                                                                                    •   New customer acquisition*
                                                                                                                        1mn+ every year
                           •     Online Sales Growth
                                 mavi.com & Marketplace

            (*): Excluding 2020 results impacted significantly by the extraordinary conditions caused by Covid19.
                                                                                                                                                     77
INVESTOR PRESENTATION - March 2021 - mavicompany.com
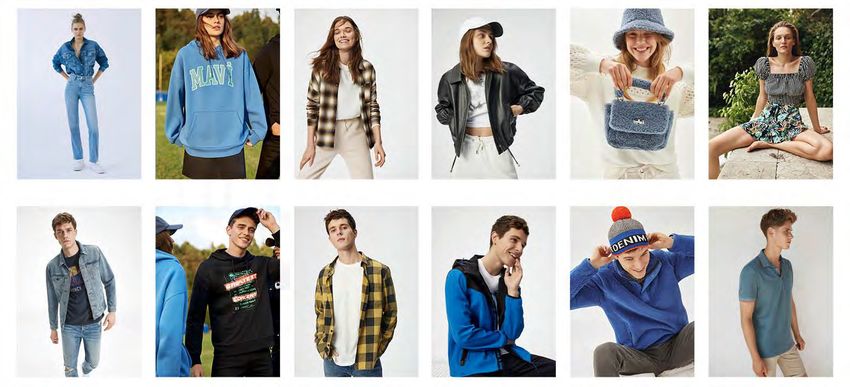
Offering a Lifestyle Product Portfolio Across Women and Men…
                                                                    Key Product Categories

         42%                     25%                       11%               11%             6%         5%

         Denim                    Knits                    Shirts           Jackets      Accessories   Others

                                                                                                                   33%
 WOMEN

                                                                                                                  Women

                                                                                                                   67%
                                                                                                                    Men
                                                                                                                   (share)

                                                                                                                  42%
                                                                                                                  Denim
 MEN

                                                                                                                  58%
                                                                                                                  Lifestyle
                                                                                                                  (share)

                  Minimising Fashion Risk and Seasonality With Various Styles Across Lifestyle Product Offering

                 % of 2020 Turkey Retail Net Sales

             Others include kids,non-denim bottoms, skirts, dresses.                                                          88
INVESTOR PRESENTATION - March 2021 - mavicompany.com
…And Growing Significantly in Each Category (disrupted in 2020 by Covid19)
            Denim Products (TRYm)                                                                Lifestyle Products (TRYm)

                                                                              Knits                                                 Shirts
                                             42%                                                       25%                                                   11%

                                                                                              (18%)
                                                                                      413                                                           (37%)
                                                                                                                                             233
                                                                        320                      338                         199
                                                                  235                                             147                                 146
                          806      (30%)

                 651
                                       568
   526                                                                                                           2017        2018            2019    2020
                                                              2017      2018          2019      2020

                                                                          Jackets                                                  Accessories
                                                                                                       11%                                                   6%

                                                                                               (16%)
                                                                                       172                                                          (26%)
                                                                         135                          144                                     115
   2017          2018    2019         2020                                                                                    98
                                                                  97                                               74                                   85

                                                              2017      2018           2019       2020           2017        2018            2019     2020

2017-2019 CAGR          % Share in 2020 Turkey Retail Net Sales

                                                                                                                                                               99
Strong Track Record of Retailization in Turkey…
                       # of Retail Stores Evolution in Turkey                                                         Turkey Retail Sales Evolution (TRYm)
  Net
  New            26               13          14                    6
 Stores                                                                                                                                                           (26%)
                                                                                                                                                     1,829
                                                                                                                                 1,471                                      1,356
                                                                                                             1,133
                                              314                 320
                                 300
                287

                2017             2018         2019               2020
                                                                                                              2017                2018                2019                  2020
                Gross Selling Space Evolution in Turkey (Sqm k)                                               Significant LFL Upside Potential of Existing Stores1
Avg.      447m2                  484m2              498m2                    500m2
Sqm/
                                                                                                                                     Further Potential Upside
Retail
Store
                                                                                                                  Potential Revenue Catch-Up From                             16,294
                                         10                         5    2                                        younger LFL Stores and New Stores
                       22                                                                                                                                                     TRY/sqm
                                               2                         5                                                                                    13,668
                            5                  8                                                                                               12,704
                            17                                                                                                                                TRY/sqm
                                                                                                                                              TRY/sqm
                                                     149                      156               Sales/                          9,576
          117                    139                                                             Sqm             7,702         TRY/sqm
                                                                                                                TRY/sqm

          2016                   2017               2018                     2019               Age of
                                                                                                               1-3 years      3-5 years       5-7 years      7-9 years       10+ years
                                                                                                Stores
                                          Expansion of existing stores   New store openings
         CAGR                                                                                 1 Based   on 2019 LfL figures as 2020 data is disrupted by Covid19 Pandemic

                                                                                                                                                                                       10
                                                                                                                                                                                        10
Significantly Impacted by Covid19 Pandemic Restrictions in 2020

  Turkey Retail
  Revenue
  2020/2019                                                 141%
                     126%

              100%                                                                 108%
                                                                                          98%
                                                                           87%
                                                                   80%
                                                    75%
                                                                                                   62%    64%
                             54%

                                            10%

                     FEB    MAR       0%
                                      APR   MAY     JUN     JUL    AUG     SEP     OCT    NOV     DEC     JAN

   2020/2019                Q1 2020               Q2 2020                Q3 2020                Q4 2020

 Trading Hours              (47%)                 (53%)                  (25%)                  (35%)

 Traffic on
                             (4%)                 (33%)                   (35%)                 (28%)
 Trading Days
 Turkey Retail
                            (48%)                 (30%)                   (8%)                  (25%)
 Revenue

                                                                                                                11
                                                                                                                 11
Like-for-like Growth Figures

       22.5%         20.9%
                                                                                                                12.0%
                                                                 17.3%                                                   1.1%                         2.1%

                                                                                                 Transaction1
                                                                                                   # Growth
                                                                                                      (%)
                                                                                                                                           -20.8%
                                                 -11.0%                                                                           -36.0%
                                                                                                                2018     2019      2020    2020*    Q4* 2020
                                  -27.3%
       2018          2019          2020           2020*        Q4* 2020

                                                                                                                          19.6%
 • 2020* and Q4* 2020 values are same store                                                                                        13.6%             14.9%
                                                                                                                                           12.4%
   sales performance including only open days in                                                                  9.4%
                                                                                                 Basket Size
   the given period.                                                                               Growth
                                                                                                     (%)

 • On the open days of 2020, overall traffic was
   down 40% and was largely compensated by                                                                        2018    2019      2020   2020* Q4* 2020
   high conversion and unit per transaction.
                                                                                                                                            25-34
                                                                                                                                             42%

              Turkey retail only, 1Number of transactions refers to number of issued invoices.
                                                                                                                                                               12
                                                                                                                                                                12
Diversified and Reliable Sourcing Model
Quality Driven Efficient Sourcing Structure with a focus on sustainability

        42% Denim                               c.80% Made in                                                           120+ Responsible
                                                                                     c.20% Imported                         Suppliers
      58% Non-Denim                                 Turkey

•    Turkey Retail Net Sales Split        •   Quality textile ecosystem         •   Mainly outerwear and            •   Well-established, long term
•    Denim-lifestyle balance of           •   Proximity improving speed             accessories                         relationships
     sales                                    and RFT                           •   36 suppliers in 9 countries     •   Internal audit team ensuring
                                                                                                                        social compliance

 Mavi Denim Business
                                     50% of Product Cost

           Owned by Mavi                                  Controlled by Mavi                                       Outsourced

                                                                                                                  Manufacturing
      Design & Development                             Fabric & Raw Materials
                                                                                                                     (CM)

 •   Multinational denim design &                  •   Direct relationship with denim               •   Cutting, Sewing &       ERAK
     development team                                  fabric mills                                     Washing               •  Best in-class
 •   Fit blocks are created and owned              •   Working with top-quality mills in            •   c.70% from ERAK          production facility
     by Mavi                                           Turkey that manufacture for                  •   Four manufacturers    • Sourcing to top global
 •   Wash recipes and development                      premium global denim brands                      tendered for best        brands.
     managed by Mavi                               •   Fabric R&D, exclusive                            price / quality       • Lead time & capacity
                                                       development and innovation                                             • Enabling energy &
                                                                                                                                 water efficiency
                                                                                                                                                     13
                                                                                                                                                      13
Best-in-Class Loyalty Program (“Kartuş”) Since 2007
                                                                Strong Appeal to Under 35 Across                                              Majority of New Loyalty Card Holders
                                                                Both Genders                                                                  are Under 35
     8.1M                       5.1M                                                                                % of Turkey’s Total
  Loyalty Card                  Active                          Active Loyalty Card Members per Age Group (%)       Population (2019)         New Loyalty Card Members per Age Group (%)
    Members                    Members1
                                                                                                                     0-14       23%
                                                                       15                             16
                                                                                    15-24                                                            34         15-24            29
                                                                                                                     15-24     16%
      75%                     Female     Male                          33
                                                                                    25-34             36
                                                                                                                     25-34
% of Retail Sales             44% 56%                                                                                          15%
                                                                                                                                                     36         25-34            38
  with Kartus                                                          29
                                                                                    35-44             29             35-44      15%                             35-44
                                                                                                                                                     21                          22
                                                                       24            45+              20             45+       29%
                                                                                                                               30%                    9           45+            11

                                                                    Women                            Men                                            Women                        Men

                                                                                  48-52% of current                                                           70-67% of new
                   1.2Mn                                                         customers under 35                                                         customers under 35

                New Members
                    in 2019
                (370K in 2020)
                                                                            “Mavi Kartuş, no. 1 in the apparel industry for the Most Successful
                                                                            Loyalty Cards Survey.”                                     (Mediacat, Nov 2019)

Note : Data for Kartuş customers as of January 2021   1Active   means that the member has made a purchase of Mavi product over the last two years

                                                                                                                                                                                           14
                                                                                                                                                                                            14
SUCCESSFUL
BRAND STRATEGY
Best-in-Class Communication
  Aspirational denim centric lifestyle brand with celebrity endorsements

     Turkey’s Most
   Loved Brand and           3,3 M
      #1 in brand          Social Media
      awareness.             Followers
                                                                                                                                Bronze Effie in the
                                                                                                                                fashion category for the
                                                                                                                                “Mavi Benim” campaign
                                                                                                                                with Serenay Sarıkaya at the
                                                                                                                                prestigious Effie Awards

                                               Kıvanç Tatlıtuğ         Serenay Sarıkaya            Merih Demiral                of the advertising world

  Global Campaigns                             Mavi Black Pro          Mavi Icon                   M28

                                                                                                                   The Rivet Awards, which recognize
                                                                                                                   the most innovative and creative
                                                                                                                   denim brands, honored Mavi with
  Adriana Lima                                                                                                     the “Best Sustainable Collection” title
                     Lucky Blue Smith     Elsa Hosk, Jordan Barrett,                      Romee Strijd,
                                                                                          Jordan Barrett           for the two new lines introduced for
                                          Francisco Lachowski
                                                                                                                   the Spring – Summer 2020 season.

                                                                                                                                                             16
                                                                                                                                                              16
Celebrities
 “Mavi is a brand
 of superior
 quality, which is the
 foremost attribute I
 look for when I, as
 an entrepreneur,
 invest because
 quality is always
 appreciated.”
 Richard Branson
 (Istanbultalks, 2016)

                         Richard Branson           Katherine Heigl         Heidi Klum       Kate Hudson            Colin Farrell

        Kendall Jenner   Liam Hemsworth    Jessica Alba              Lady Gaga          Matthew           Fergie
                                                                                        McConaughey

                                                                                                                                   17
                                                                                                                                    17
INTERNATIONAL &
E-COM MARKETS
Growing Global Footprint (2020)
                                                 c.4,500 doors in       55 monobrand            Online channels
                                                 33 countries           stores                  share in global
                                                                                                44.2% (inc.
                                                                        (23 own-                Wholesale
                                                                        opearated,              e-com)
                                                                        32 franchise

         USA
                                                                                   EUROPE            1%
                                                                                                     Retail
                                                                                        21%
 25%                         c.1200        Wholesale:        Online wholesale                                          -1,100        Wholesale:             Mono-brand
                                                                                        E-com
 E-com                       wholesale     Nordstrom,        partners:                                                 wholesale     Galeria Kaufhof-
                                                                                                                                                            retail stores: 1
                                                                                                                                     Karstadt,
                             multi-brand   Bloomingdale’s,   Stitchfix, Amazon,                                        multi-brand   Breuninger, Modepark
                             doors         Von Maur,         Zappos,                                                   doors         Zöther,                Germany
                                           Patrik James      Nordstrom            17%                                                Sinn Leffers           mavi.com
                                                                                                                                     Online wholesale
                                                                                  Wholesale                                          partners:
                                                             US mavi.com,         E-com                                              Amazon, Zalando,
                                                             34heritage.com                                                          About You, Otto
                 42%
    33%          Wholesale                                                                            61%
    Wholesale    E-com                                                                                Wholesale

      CANADA                                                                           RUSSIA
      7%        15%                                                                    12%
      E-com     Retail       c.1,000       Wholesale:        Mono-brand retail                                         139           Franchise              Mono-brand
                                                                                       E-com
                             wholesale     Nordstrom,        stores: 4                                                 wholesale     retail stores:         retail stores:
                             multi-brand   Harry Rosen,                                                                multi-brand   15                     18
                             doors         Simons, Ernest,   Canada                                                    doors
                                           Mark’s,           mavi.com and
                                                             34heritage.com
                                                                                   25%
78%                                                                                Wholesale
Wholesale                                                                                                     63%
                                                                                                              Retail

                                                                                                                                                                        19
                                                                                                                                                                         19
E-Commerce Platform to Deliver Future Growth
                     Global E-Commerce Revenue                                                           Turkey E-Commerce Revenue

 % Sales      8.3%                                      17.2%                                % Sales    3.8%                   10.7%

                                                          412                                                     132.0%
                                                                                                                               207
                                 73.2%                   107
                                                                                                                   (100%)
              238                                                                                                                99
                                    15%                  125                                            89
                93                                                                                       7         270%

                42                 201%                                                                  27
                                                                                                                                107
                                                         180                                             55         94%
               104                  74%

                                                                                                        2019                   2020
           2019                                      2020
     mavi.com   Marketplace                       Wholesale E-com
                                                                                                         International E-Commerce Revenue
                         Mavi.com Turkey - Key Statistics 2
                                                                                              % Sales   29.9%                   44.2%

           11% of total sales in Turkey
                                                     74%           Revenue from Mobile                              38.0%
                                                                                                                                206
                                                                                                         149         25%

 2.6m        # pieces sold                           15.0%            Return Rate1
                                                                                                                     75%
                                                                                                                                 107
                                                                                                          86
                                                                                                                                  26
                                                                                                          15         50%
  33%                 Denim as
                      % of Sales                      55m           # of Sessions per year                49                      73

                                                                                                         2019                    2020

                 1   Returned transactions/(net transactions+return transactions.) 22020                                                    20
                                                                                                                                             20
E-Commerce Potential in Turkey
                                                                                                                   Turkey Has a Strong E-Commerce Potential3

                                                                                                                                       E-Commerce Penetration

    Turkey Share of Online Sales Still Below Overall Comparable
                               Markets
                                                                                                                                                  5.3%
% Share of E-Commerce in Apparel & Footwear (2019)1                                                                 E-Commerce penetration in Turkey (China 24%, USA
                                                                                                                    14%, UK 17%, Germany 11%)
                                                                                                                                     Internet Penetration
              27          26
                                       24
                                                    20
                                                                                                                                                  72%
                                                                                                                    Turkey is among the top countries with largest
                                                                 14                                                 internet penetration, 59 mn internet users (world
     13                                                                       13                                    average 57%)
                                                                                            9                                      Per Capita Spent Online

5
                                                                                                                                               Eur160
          2
                                                                                                                    Per Capita spent online in Turkey (world average 735
Mavi           UK           USA      Germany         World      Canada        Russia       Turkey                   Euros)
                                                                                                                                 Mobile Share in E-commerce

                                                                                                                                                   75%
                                                                                                                    Mobile share in e-commerce in Turkey. 60 mn people
                                                                                                                    own smartphones. 77% of transactions in Mavi.com
                                                                                                                    Turkey in 2019 is mobile with the introduction of smart
                                                                                                                    phone application

                    1   Euromonitor (2019), except for Mavi data (2019 vs 2020). 2 Mavi operated e-Commerce, including 3rd Party Platforms Marketplace (2019)
                    3   Tubisad (2019),Nielsen(2018)                                                                                                                          21
                                                                                                                                                                               21
STRONG
FINANCIAL
PERFORMANCE
Operational Results Impacted by Covid-19 Pandemic in 2020
                            Revenue Evolution (TRYm)                                                    Gross Profit Evolution (TRYm)
                                                                                  Gross         50.9%      51.3%          49.1%              48.3%
                                                                                  Margin (%)

                                                               (16%)
                                                 2,863                                                                                (17%)
                                 2,353                             2,402                                                  1,405
               1,782                                                                                        1,208                             1,160
                                                                                                 907

                2017             2018            2019              2020                         2017        2018              2019            2020

                             EBITDA Evolution (TRYm)                                                         Net Profit (TRYm)
EBITDA                                                                            Profit
Margin (%)   14.1%       15.6%           14.0%       22.5%             16.3%      Margin (%)   5.1%       4.3%         4.7%           3.8%             0.3%

                                                                  (39%)
                                                         644                                                                                    (93%)

                                          401                                                                          134
                          367                                            392                              101                          108
             252                                                                                90

                                                                                                                                                         8

             2017        2018            2019         2019               2020                  2017       2018        2019             2019             2019
                                                    (IFRS16)           (IFRS16)                                                      (IFRS16)         (IFRS16)

                       2017-2019 CAGR
                                                                                                                                                                 23
                                                                                                                                                                  23
Effective Working Capital and Inventory Management
             Cash Conversion1 (exc. IFRS 16)                                                                                               Main Working Capital Items

                         111%                                                                         TRYm                                                  2017          2018            2019    2020
                                             88%               90%                83%
                                                                                                      Trade & Other Receivables3                           140.2          188.1           251.6   247.9

                                                                                                           % Sales                                          7.9%           8.0%            8.8%   10.3%

                                                                                                      Inventories                                          320.4          457.2           496.1   560.1
                          2017              2018               2019              2020
                                                                                                           % COGS                                         36.6%          39.9%            34.0%   45.1%

  TRYm                           2017             2018             2019             2020              Trade & Other Payables4                              372.7          516.5           604.1   642.1

  EBITDA                        252.1            367.1            400.7             210.5                  % COGS                                         42.6%          45.1%            41.4%   51.7%

  Δ in NWC                        27.9           (48.1)           (38.3)           (34.8)             Main Net Working Capital                               87.9         128.8           143.5   165.9
  Operating Cash                                                                                                                                                           5.5%            5.0%    6.9%
                                279.9            319.0            362.4             175.7                  % Sales                                          4.9%
  Flow2

   •     Efficient planning and successful sell-through led to healthy inventory levels that is largely flat in
         number of pieces compared to 2019-year end
   •     Year-end inventory includes mainly fresh new season products
   •     Positive cash generation resulting with favorable cash conversion level at 83%
              1 Defined as Operating Cash Flow / EBITDA. 2 Operating Cash Flow calculated as EBITDA – Change in Working Capital. Working Capital as per the cash flow statement and

             including main working capital items as well as Deferred revenues and Employee benefits paid among others. 3 Trade & Other Receivables includes Current Trade Receivables,
             Current Other Receivables and Non-Current Other Receivables. 4 Trade & Other Payables includes Current Trade Payables, and Current Payables to Third Parties.                          24
                                                                                                                                                                                                     24
Efficient Capex Management and Healthy Leverage Ratios

                                   CAPEX                                   Debt Breakdown (31 January 2021)

% Sales      4.1%           2.8%           3.1%        4.2%
                                                                            7%                 Average Cost of Debt
                                           100.6       101.3          5% 9%             EUR    TRY                    11.5%
                                                                                 7%     USD
             72.8           66.1                                                               EUR                     0.9%
                                                                                   2%
                                                                                        CAD
                                                                                               USD                     3.3%
                                                                                        TRY
                                                                                               RUB                    12.5%
                                                                                        RUB
                                                                     77%                       CAD                     3.0%
             2017           2018           2019        2020          93%
                                                                                               Blended                 9.9%

               Net Debt / LTM EBITDA (exc. IFRS 16)

                                                               • 16% of total consolidated debt is carried by
ND/LTM
EBITDA              0.02x                     0.17x              Mavi US, Mavi EU, Mavi CA and Mavi RU - all
(exIFRS16)                                                       denominated in their local currencies. Only 7%
                                                  37             of total debt is in foreign currency and is
                                                                 naturally hedged
                      9
                                                               • Keeping no FX position is management priority
             31 January 2020          31 January 2021

                                                                                                                         25
                                                                                                                          25
2020: A YEAR
MARKED BY
COVID19
2020 Business Overview
A Year Marked by Covid19 Pandemic

• Throughout 2020, our priority as a leading and responsible brand was to protect the health
   of our employees, customers, business partners, and the public. As the Mavi management,
   we would like to thank the entire Mavi team for standing in unity and working with great
   energy and dynamism in this challenging period

• Covid19 related lockdowns were imposed across the countries we operate in. Turkey
   operations experienced 92 days of store closures, which meant a 40% decline in trading
   hours. In the face of closures consolidated sales declined only 16% versus 2019

• Online sales remained strong with 110% growth globally compared to 2019 (152% growth in
   Turkey )

• Through rigorous supply chain management and product planning gross margin levels were
   preserved

• With rapid measures opex decreased by 6%. Turkey rent/revenue ratio kept stable at 16%
• Agile inventory and sell-through management capabilities enabled us to maintain year-end
   inventory levels flat in pieces (value increasing only 13% versus 2019)

• We closed the year with a commendable strong balance sheet position with a leverage
   ratio close to zero
                                                                                                27
                                                                                               27
Future Ready Company
Towards a more digital future

• Digitalization and CRM investments on the core of our strategy of winning
• SAP transformation project continues on-time, planned to go live June 2021
• Mavi.com platform globally attracts new customers with world class capabilities
Mavi : Love Brand

• Continued product expansion with Mavi Black Pro, Mavi Icon, Sporty, and Sweat categories
• Celebrity campaigns and diversified usage of influencers to increase customer engagement
• Collaborations that create excitement and drive new and young customers
Sustainable growth through quality

• First Turkish apparel brand to disclose carbon footprint transparently to CDP (Carbon
    Disclosure Project) receiving a score of B in environmental performance

• Signed UN Global Compact, the world's largest voluntary corporate sustainability initiative
• The sustainable collection All Blue (launched in 2019) more than doubled in product offering
• First eco-store opened in Istanbul Zorlu Shopping Mall
•                                                                                                 28
                                                                                                 28
THANK YOU

Contact :   investorrelations@mavi.com
            duygu.inceoz@mavi.com
Financial Statements
Income Statement (inc. IFRS 16)

TRYm                                       Q4 2019    Q4 2020    Change (%)       2019        2020    Change (%)
Revenue                                      714.6      649.9          (9%)    2,862.9     2,401.8         (16%)
Cost of Sales                               (379.1)    (349.2)         (8%)   (1,458.3)   (1,241.7)        (15%)
Gross Profit                                 335.5      300.7         (10%)    1,404.6     1,160.1         (17%)
  Gross Margin                              47.0%      46.3%                    49.1%       48.3%
Administrative Expenses                      (44.6)     (52.2)         17%      (162.0)     (173.3)          7%
Selling and Marketing Expenses              (224.1)    (232.3)          4%      (857.2)     (880.1)          3%
R&D Expenses                                  (7.6)      (9.1)         20%       (25.9)      (33.7)         30%
Other Income / (Expenses), net                 0.1       (2.3)         n.m.        2.4        17.6         640%
Operating Profit                              59.3        4.8         (92%)      362.0        90.6         (75%)
Profit/(Loss) from Investment Activities      (0.1)      (0.2)         n.m.       (0.8)       (1.4)         n.m.
Operating Profit before Financial Income      59.3        4.6         (92%)     361.2        89.2          (75%)
  Operating Margin                            8.3%      0.7%                    12.6%        3.7%
Financial Expenses, Net                      (44.4)     (23.5)        (47%)    (223.7)       (76.8)        (66%)
Profit Before Tax                             14.9      (19.0)         n.m.     137.5         12.5         (91%)
Income Tax Expense                            (1.9)       1.5          n.m.     (29.6)        (4.4)        (85%)
Profit                                        12.9      (17.5)         n.m.     107.9          8.0         (93%)
  Profit Margin                               1.8%     (2.7%)                    3.8%        0.3%
EBITDA                                      134.2        91.7         (32%)     644.4       392.1          (39%)
  EBITDA Margin                             18.8%      14.1%                   22.5%        16.3%

                                                                                                                    30
                                                                                                                   30
Financial Statements
Balance Sheet (inc. IFRS 16)

               TRYm                                       31 January 2020   31 January 2021 Change (%)
               Assets
               Current Assets
               Cash and Cash Equivalents                           310.8             889.9      186%
               Trade Receivables                                   231.1             231.4        0%
               Inventories                                         496.1             560.1       13%
               Other Current Assets                                 80.7             105.4       31%
               Total Current Assets                              1,118.7           1,786.7       60%
               Property and Equipment                              180.7             197.7        9%
               Right of Use Assets                                 406.7             435.0        7%
               Intangible Assets                                   222.4             262.7       18%
               Other Non-Current Assets                              8.9              25.6      187%
               Total Non-Current Assets                            818.8             921.0       12%
               Total Assets                                      1,937.4           2,707.8       40%
               Short-Term Financial Liabilities                    235.7             821.0      248%
               Short-Term Contractual Lease Liabilities            198.0             218.6       10%
               Trade Payables                                      597.3             638.2        7%
               Other Current Liabilities                            92.1             108.3       18%
               Total Current Liabilities                         1,123.0           1,786.0       59%
               Long-Term Financial Liabilities                      84.1             105.6       26%
               Long-Term Contractual Lease Liabilities             240.8             260.0        8%
               Other non-current Liabilities                        11.9              22.1       86%
               Total Non-Current Liabilities                       336.7             387.7       15%
               Total Liabilities                                 1,459.8           2,173.7       49%
               Total Equity                                         477.7             534.0       12%
               Total Equity & Liabilities                         1,937.4           2,707.8       40%

                                                                                                          31
                                                                                                         31
Financial Statements
Cash Flow Statement (inc. IFRS 16)

   TRYm                                                                                                           2019                        2020
   Profit¹                                                                                                       107.9                         8.0
   Adjustments                                                                                                   565.6                       441.4
   Cash Flow from Operating Activities                                                                           673.5                       449.4
   Δ in Net Working Capital²                                                                                     (38.3)                      (34.8)
   Income Tax Paid                                                                                               (32.0)                      (25.2)
   Net Cash from Operating Activities                                                                            603.2                       389.4
   Capex                                                                                                        (100.6)                     (101.3)
   Other Investing Cash Flow³                                                                                     (4.8)                       57.1
   Net Cash Flow Used in Investing Activities                                                                   (105.4)                      (44.3)
   Debt Issued / (Repaid)                                                                                        (47.2)                      564.0
   Payment of Contractual Lease Liabilities                                                                     (243.5)                     (180.6)
   Other Financial Payments⁴                                                                                     (79.1)                      (66.9)
   Interest Paid                                                                                                 (79.3)                      (82.6)
   Net Cash Flows Used in Financing Activities                                                                  (449.0)                      233.9
   Net Cash Flow                                                                                                  48.8                       579.0
   Cash and Cash Equivalents at the Beginning of the Period 5                                                    262.0                       310.8
                                                      5
   Cash and Cash Equivalents at the End of the Period                                                            310.8                       889.9
   1Prenon-controlling interest. 2 Working Capital includes main working capital items and employee benefits paid as well as deferred revenues. 3 Other
   Investing Cash Flow includes proceeds from sale of tangible assets and interest received. 4 Other Financial Payments include proceeds from derivatives,
   imputed interest and financial commissions. 5Cash and Cash Equivalents in the Cash Flow Statement includes Bank Overdraft as negative cash. Excluding
   Bank Overdraft, net cash at the end of the period is equal to Cash and Cash Equivalents on the Balance Sheet for the same fiscal year.

                                                                                                                                                              32
                                                                                                                                                             32
Highly Experienced Board of Directors

                   Ersin Akarlılar                      Ahmet Ashaboglu                      Cüneyt Yavuz
                   Chairperson                          Independent Non-                     CEO
                                                        Executive Director

      ◼ With Mavi since 1991               ◼ CFO of Koc Holding since 2006      ◼ Mavi’s Chief Executive Officer
      ◼ Primarily responsible for Mavi’s   ◼ Previously worked at McKinsey        since 2008
        international strategy               & Co and UBS Warburg               ◼ Previously worked at Procter &
      ◼ Chairman of Mavi US                                                       Gamble

                    Elif Akarlılar                      Nevzat Aydin                         Seymur Tari
                    Executive                           Independent                          Vice-
                    Director                            Non-Executive                        Chairperson
                                                        Director                             Non-Executive
                                                                                             Director
      ◼ With Mavi since 1991. Mavi’s
        Global Brand Director since        ◼ Founder and CEO of                 ◼ Founder and CEO of Turkish
        2008                                 Yemeksepeti, a pioneering            Private Equity
      ◼ Previously held various Product      online food delivery business in
                                                                                ◼ Previously worked at McKinsey
        and Brand Management                 Turkey
                                                                                  & Co and Caterpillar Inc.
        positions within Mavi Istanbul     ◼ Seasoned e-commerce
        and NY.                              investor

                                                                                                                   33
                                                                                                                    33
You can also read