Prediction of Size of the COVID-19 Pandemic Using Wavelength Models: Cases of Turkey and World
←
→
Page content transcription
If your browser does not render page correctly, please read the page content below
Prediction of Size of the COVID-19 Pandemic Using
Wavelength Models: Cases of Turkey and World
Tev k Bulut ( buluttev k@gmail.com )
Republic of Turkey Ministry of Industry and Technology https://orcid.org/0000-0002-3668-7436
Mustafa Çağrı Yıldız
Konya Training and Research Hospital
Keywords: Pandemic, COVID-19, Net Wavelength, Case Wavelength, Death Wavelength, Recovered Case
Wavelength, Epidemic, Prevelance, Incidence, CDR, CFR
DOI: https://doi.org/10.21203/rs.3.rs-34521/v1
License: This work is licensed under a Creative Commons Attribution 4.0 International License.
Read Full License
Page 1/19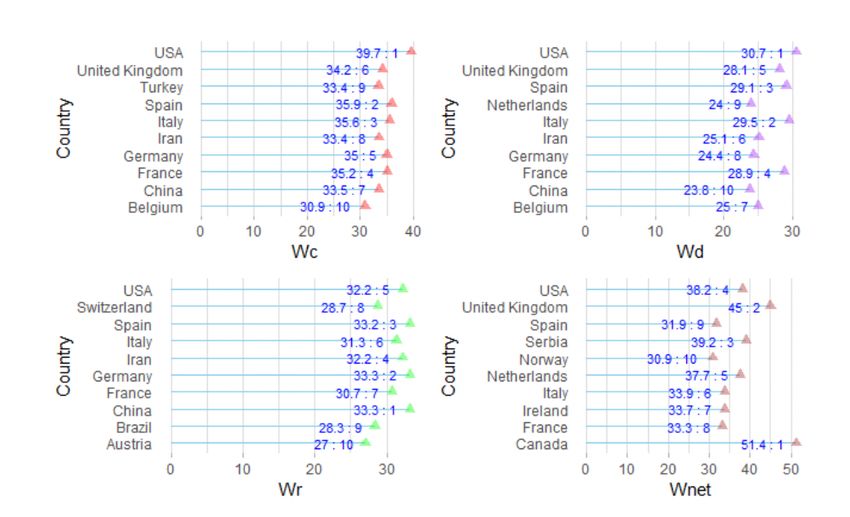
Abstract
The main purpose of the study is to predict the magnitude of the Covid-19 pandemic by using
epidemiological wavelength models in Turkey and at international level. Therefore, rstly, the rst 36 days
of wavelengths based on the number of daily coronavirus cases in Turkey were calculated. In addition,
114 countries were compared in terms of Covid-19 wavelengths considering the cumulative number of
the pandemic cases occured at the end of the rst 36 days for evaluation on an equal plane. In the last
part of the study, the wavelengths of 185 countries were examined comparatively based on the
cumulative number of cases at the end of the time frame from the rst epidemic case until 2020-04-16
(including that date). According to the ndings of wavelength obtained in Turkey, it was observed that
case wavelength on 2020-04-11, death and recovered case wavelength on 2020-04-16, and net
wavelength on 2020-03-26 reached its peak. China was the country having the highest wavelength of
case, death, and recovered case wavelengths in 114 countries at the end of the rst 36 days since the rst
case occurred. In that country, wavelengths of case, death and recovered case were 33.6, 23.5 and 30.7,
respectively. The rst three countries with the highest net wavelength at the end of the rst 36 days were
Serbia (36.5), Netherlands (33.5) and Portugal (30.3), respectively. On the other hand, the country having
the highest case and death wavelengths among 185 countries in the time interval from the rst case until
the date of 2020-04-16 (including that date) was the USA, and case and death wavelengths were 39.7 and
30.7, respectively. The country with the highest recovered case wavelength was China (33.3). The rst 3
countries with the highest wavelengths are Canada (51.4), England (45.0) and Serbia (39.2), respectively.

1. Introduction
SARS-CoV-2, which causes coronavirus disease (Covid-19), was rst seen in Wuhan city of China in
December 2019, and then spread to at least 187 countries and regions worldwide, causing an already
ongoing pandemic [9, 10, 11]. While symptoms such as cough, fever and shortness of breath are
frequently observed in Covid-19 infection, these symptoms may be accompanied by symptoms such as
abdominal pain, fatigue, diarrhea, loss of taste and smell, abdominal pain [12]. The rst symptoms after
contact appear between 2 and 14 days, with an average of 5 days. Covid-19 spreads from person to
person through coughing, sneezing, and speech. However, crowded areas increase this spreading
process. Although many patients easily recovered, the infection rapidly progressed to viral pneumonia
and multiple organ failure in patients with comorbidity [13, 34]. Also, the coronavirus, which can survive
for about 72 hours on surfaces, can be taken into the human body by touching these contaminated
surfaces [14].

For the diagnosis rstly nasopharyngeal swab must be taken as a sample and the standard method
of diagnosis is by real-time reverse transcription polymerase chain reaction (rRT-PCR) must be applied to
the sample. If there is a high suspicion about Covid-19 infection and patient has some symptoms and
risk factors Chest CT imaging may be helpful for diagnosis, but guidelines do not recommend using
Chest CT for routine screening of patients [15,16]. To prevent Covid-19 infection, we must take some
meaures like hand washing almost 20 seconds, maintaining physical distance from others (especially
                                                 Page 2/19
from those with symptoms) and not touching to the face with unwashed hands. Since a vaccine suitable
for covid-19 and a speci c antiviral therapy cannot be developed, parameters such as symptomatic
therapy, supportive therapy and isolation are included in the management of the disease [17]. The
supportive treatment offered to patients includes liquid electrolyte therapy, oxygen supplementation and
supporting other vital organs and treatment mechanisms are used according to the severity of the
disease [18,19,20]. Extracorporeal membrane oxygenation (ECMO) has been used in the treatment of
respiratory failure and its effectiveness is not yet fully understood. It is known that personal hygiene and
wellness habits affect immunity positively. Supportive treatments are thought to be effective in the early
stages of the infection and mild symptoms [21,22].

There is no speci c treatment method for coronavirus disease as of April 2020. Also, it is not enough
information about angiotensin converting enzyme inhibitors and low-molecular-weight heparin is
recommended as a treatment that prevents blood clotting. Treatment appears to be effective in patients
with severe coronavirus showing signs of coagulopathy [23]. Like the symptoms of Covid-19, the
prognosis of the disease differs from person to person. While patients with mild symptoms improve
within 2 weeks, the duration of hospitalization and treatment of patients with moderate to severe
symptoms varies between 3-6 weeks [24].

Children are sensitive to the disease, but they experience the infection with milder symptoms than adults.
That is, the risk of death is less than 0.5% in those younger than 50 years, while it is more than 8% in
those older than 70 years [25]. Many patients who died due to Covid-19 have hypertension, diabetes
mellitus and cardiovascular disease. It was reported by the Istituto Superiore di Sanità that out of 8.8% of
deaths where medical charts were available for review, 97.2% of sampled patients had at least one
comorbidity which had the average patient with 2.7 diseases [26].

The availability of medical resources can also affect mortality in the socioeconomic situation. Therefore,
estimates of mortality from disease differ due to both regional differences and methodological
di culties [27]. The measurement of mortality generally varies by region and time. Mortality is in uenced
by many factors such as the quality of healthcare and ease of access to healthcare, age, sex and time
since the onset of the disease [28]. Statistical parameters such as infection-induced death (IFR), which
re ects the percentage of infected individuals who have been diagnosed or undiagnosed, and the case-
death rate (CFR), representing the percentage of those who die from a disease diagnosed, are used in
mortality calculations because they are independent of time [29].

In the study, in rst place, epidemiological descriptive statistics of Covid-19 pandemic in Turkey were
examined. In addition, it was predicted the rst 36-day epidemiological wavelengths to measure the
magnitude of the epidemic in Turkey. Furthermore, in order to make evaluations on the same plane, the
wavelengths of countries at the end of the rst 36 days in which coronavirus cases emerged were
analyzed comparatively at the international level. At the same time, the wavelengths of countries have
been handled comparatively at the international level at the end of the time interval in which passed from
the date in which the rst coronavirus case was observed until 2020-04-16 (including that date).

                                                  Page 3/19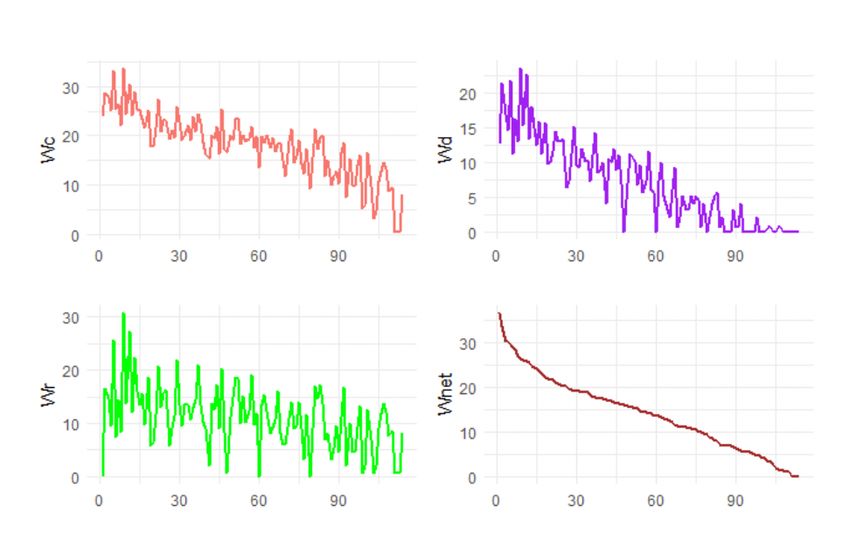
2. Methodology
In the study, it was aimed to estimate comparatively the magnitude of the Covid-19 pandemic using the
wavelength models in Turkey as well as at the international level. For this reason, in this section, the
sources of data sets used in the research, the presentation of the ndings, epidemiological rates, and the
theoretical framework of the wavelength models are included.

Two different data sets were used in the research. The rst data set includes Covid-19 cases in Turkey.
The number of cases in this data set was obtained from web site https://Covid19.saglik.gov.tr. This web
site, which is one of the web sites of Republic of Turkey Ministry of Health, was established to provide
information to the public about Covid-19 cases [4]. The reason for getting data from this site is that the
data set contains the number of daily Covid-19 tests and cases. That is to say, the number of Covid-19
cases and tests is available both cumulatively and daily on the web site.

The other data set covers international Covid-19 cases. The data set was obtained from the Human Data
Exchange (HDX), one of the web sites belonging to United Nations O ce for the Coordination of
Humanitarian Affairs [3]. On this website, coronavirus data sets are independent from each other, and
there are three different data sets, which are con rmed, death and recovered case data set. These data
sets received from this web site have csv extension. Datasets were combined using data mining
techniques. Microsoft Excel 2016 and mainly R programming language were used in data mining and
analysis phase [1,2]. Since there are duplicate records in time series in data sets, these records are
reduced to unique time series within each country. The number of cases in the data set follows a
cumulative course as in the source site, and the data set covers the coronavirus cases of 185 countries.

In rst place, the rst 36 days of epidemiological wavelengths were estimated for Turkey, depending on
the number of daily coronavirus cases until the date of 2020-04-16 (including that date). Later,
wavelengths were calculated based on cumulative case numbers in each of the world countries at the
end of the rst 36 days in order to be evaluated on the same plane with Turkey. To this purpose, the
number of cumulative cases at the end of the rst 36 days at which passed from the rst coronavirus
case until the date 2020-04-16 (including that date) were taken as data.

On the other hand, the mentioned 36-day time limit were not sought to see the current wavelengths at
international level and to make comparisons. In other words, since the dates when the coronavirus
pandemic appeared vary between countries, the number of days from the date of the rst case to the date
of 2020-04-16 (including that date) may decrease below 36 or exceed 36. Here, the cumulative case
numbers of world countries were taken as data on 2020-04-16 (including that date).

2.1 Epidemiological Rates

In this section, epidemiological rates used in the study are discussed. One of the epidemiological rates
utilized to measure rate of emergence of the disease is prevalence. Prevalence is expressed as proportion
of a given population in uenced by a risk factor or a disease at a given time. It is obtained by comparing

                                                  Page 4/19
the number of people having the condition with the total number of people studied, and is often stated as
a percentage, number of cases per 10,000 people, or a fraction [30]. Within the scope of the study, the
number of approved cumulative cases and cumulative Covid-19 tests were used to calculate prevalence.
Prevalence was calculated with the help of equation (1). The number of cumulative cases was included
in numerator of the equation, and the number of cumulative tests was included in its denominator. The
product coe cient was taken as 100.
The other of the epidemiological rates utilized to measure rate of emergence of the disease is incidence.
Incidence is desribed as the probability of new cases occurring in a population having a speci c medical
condition in a given time period [31]. In calculating incidence, the number of daily Covid-19 tests and
cases were used. Incidence was calculated using equation (2). The number of daily cases was included
in numerator of the equality, and the number of daily Covid-19 tests was included in denominator of the
equality.
The rst of the epidemiological death measures is crude death rate (CDR). CDR is the number of deaths
observed in populaton of a certain geographic area in a speci c time. It can be multiplied by 1,000 or
100,000 [32, 37]. CDR was calculated with the help of equation (3) in the study. The reason for the
multiplication coe cient to be taken as 1,000,000 in the equation is that the ease of interpretation is
desired.
The other of the epidemiological death measures is a case fatality rate (CFR), which is sometimes
described as case fatality risk. CFR is de ned as the proportion of deaths among those diagnosed with a
particular disease in a certain time interval. The multiplication coe cient of CFR is usually 100, and is
often used to measure disease severity [33]. CFR, which is a more sensitive measure compared to CDR,
was calculated with the help of equation (4).
2.2 Theoretical Framework of Wavelength Models
In this section, theoretical framework of epidemiological wavelength models that predict magnitude of
outbreaks developed by Tev k Bulut in 2020 is discussed [5]. Wavelength models focus on output
Page 5/19variables that are easy to understand and apply. Wavelength models consist of 4 similar equations based
on the number of cases and which must be calculated respectively:
1. Case wavelength
2. Death wavelength
3. Recovered case wavelength
4. Net wavelength
In order to calculate the said net wavelength, case wavelength, death wavelength and recovered case
wavelength must rst be calculated, and then recovered case wavelength must be subtracted from the
sum of case wavelength and death wavelength. The parameters used in wavelength model equations are
given in Table 1.
Table 1: Parameters of Wavelength Models
Parameters Symbol Parameters Symbol
Approved cumulative total Cc Wavelength W
number of cases
Approved cumulative total dc Case wavelength Wc
death number of cases
Approved cumulative total rc Death wavelength Wd
recovered number of
cases
Number of days since the tc Recovered case Wr
first case was announced wavelength
The ratio of within the Net wavelength Wnet
total day of the year of the
number of days passed
since the first case
announced
Natural logarithm ln = loge
While calculating the wavelengths in the models, a path could be drawn as follows: A wavelength could
also be calculated from the active case numbers obtained after subtracting deaths and recovered cases
from the number of cases. However, this has not been done because the aim is to seek and monitor
individual wavelengths of coronavirus cases in the context of con rmed cases, deaths, and recovered
cases.
On the other hand, population data could be included in the equations used in the wavelength models.
However, this has not been done done. The reason for this is that population data is not a realized output
variable and the developed models aim to present the current situation in a valid, reliable and easy-to-
apply manner.
Page 6/19The equations used in the wavelength models are as follows: Case wavelength in equal (5), death
wavelength in equality (6), recovered case wavelength in equality (7), and lastly in net wavelength
equation (8).
In order to reveal the magnitude of the epidemic, Wc is calculated with the help of equation (5) in the rst
place. The higher the Wc, the greater the magnitude and the effect level of the epidemic in the population.
The high Wd shows that the epidemic has a lethal effect on the population. On the other hand, Wrs rising
trend is a situation that should be interpreted positively. As a result, Wnet consists of Wc, Wd, Wr equations.
As Wnet rises, the level of negative impact of the epidemic in the population means so high.
3. Findings
In this section, it was rstly given to epidemiological descriptive statistics derived from coronavirus cases
in Turkey. After descriptive statistics, the rst 36 days of epidemiological wavelengths of Covidien-19
outbreak in Turkey were evaluated. Besides, the wavelengths were analyzed comparatively at the
international level based on the cumulative case numbers at the end of the rst 36 days. In the end, the
wavelengths were examined comparatively at the international level based on the cumulative case
numbers at the end of the time period until 2020-04-16 (including that date) without the rst 36-day limit.
The way followed in the presentation of the ndings at the international level is as follows: According to
the wavelength models, the rst 10 countries with the highest wavelength are included in gures.
3.1 Epidemiological Descriptive Statistics
Under this title, the course of coronavirus cases in Turkey were initially examined. The epidemiological
descriptive statistics obtained are given in Figure 1. The ndings show that there were sharp increases in
the number of con rmed cases, deaths, and recovered cases in general until 2020-04-11, there was a
rapid decline the day after that date, and then entered an upward trend. Another striking nding here was
that the number of recovered cases started to be well above the number of deaths and con rmed cases.
Incidence, prevalence, CFR and CDR values of Covid-19 cases in Turkey are given in Figure 2. The
population of Turkey in 2019, released by Turkish Statistical Institute on 2020-02-04, was 83,154,997 [36].
That data was used to calculate CDR. Since there was no recorded test information for the time series
before 2020-03-21, the number of cases in the time series before that date is not included in Figure 2.
From the ndings obtained, it was observed that an upward trend in prevalence continued until 2020-03-
29, followed by a stable course. It was seen that prevalence started to lose momentum similar to
Page 7/19incidence on 2020-04-11. In Figure 2, a sharp decrease was observed in incidence after peaking. It was
seen that incidence fell below prevalence after 2020-04-11. On the other hand, it was observed that CFR
reached its peak on 2020-03-21, followed by a uctuating downtrend. However, it was observed that CDR
displayed a steady rise in general, and peaked on 2020-04-16.
3.2 Epidemiological Wavelengths
In the presentation of ndings obtained from the wavelength (W) models, rstly, daily wavelengths of
coronavirus cases in Turkey were examined. The ndings are given in Figure 3. In calculating of daily
wavelengths, it was taken as tc = 1, cc: the number of daily con rmed cases, dc: the number of daily
deaths, and rc: the number of daily recovered cases.
It was observed that daily case wavelengths (Wcs) in Turkey indicated an upward trend, but an increase in
decreasing direction according to Figure 3. The increase trend in death wavelengths (Wds) was generally
below case (Wc), recovered case (Wr) and net wavelength (Wnet) trend. It was observed that Wr increased
sharply after 2020-03-26, and rose steadily. On the other hand, it was observed that Wnet reached its peak
on 2020-03-26, and followed a generally declining trend after that date.
Wavelengths in the world at the end of the rst 36-day time frame until 2020-04-16 (including that date)
in Turkey has been shown in Figure 4. Wavelength (W) ndings consist of case (Wc), death (Wd),
recovered case (Wr) and net wavelength (Wnet) ndings of 114 countries in Figure 4. In the gure, y axis
shows the wavelengths (Ws), and x axis shows the number of countries. It was seen from the ndings
that Wcs had a higher trend than other wavelengths in general. It was observed that the highest
wavelength was derived from Wnet.
Wavelengths of countries in the world at the end of the rst 36-day time frame until 2020-04-16 (including
that date) in Turkey has been given in Figure 5. The rst 10 countries with the highest wavelengths
among 114 countries are presented in Figure 5. The ndings show that the country having the highest Wc
was China with 33.6 points, followed by Turkey (33.2) and Iran (30.4), respectively. The country with the
highest Wc was observed to be China with 23.5 points as in Wc. China was followed by Iran and Turkey,
respectively. On the other hand, the country with the highest Wr, as in previous wavelengths, was China
with 30.7 points. China was followed by Iran and Turkey, respectively. Finally, it was observed that the
country with the highest Wnet was Serbia with 36.5 points, followed by Netherlands (33.5) and Portugal
(30.3), respectively.
Wavelengths in the period from rst epidemic case observed in the world until 2020-04-16 (including that
date) have been given in Figure 6. Wavelength ndings cover the ones of 185 countries. In the gure, y
axis shows wavelengths (W), and x axis shows the number of countries. The ndings show that the
highest W values in general was in Wnet, followed by Wc and Wr, respectively. This means that the
magnitude of the epidemic gained width and depth when compared to the rst 36-day wavelength.
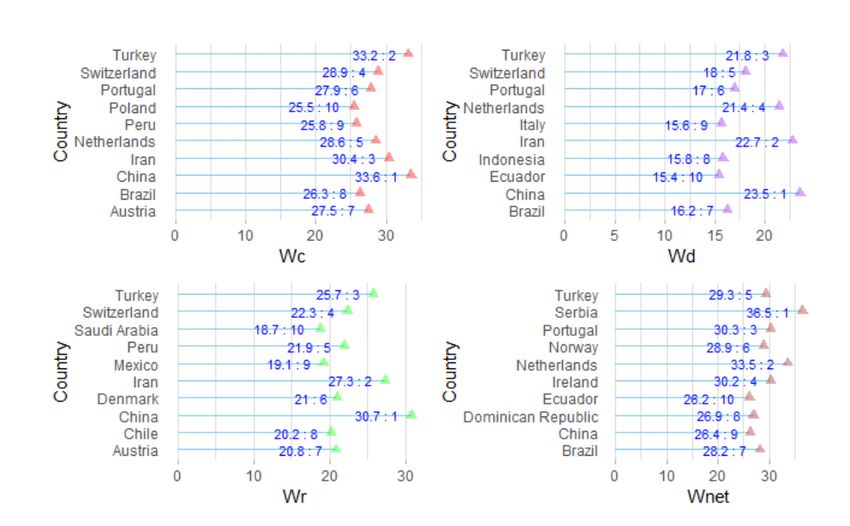
Page 8/19The rst 10 countries with the highest wavelengths in 185 countries in the period from rst epidemic case
seen in the world until 2020-04-16 (including that date) have been given in Figure 7. Findings point out
that the country having the highest Wc was the USA with 39.7 points, followed by Spain (35.9) and Italy
(35.6), respectively. The country with the highest Wd was the USA with 30.7 points, as in Wc, followed by
Italy and Spain, respectively. On the other hand, the country having the highest Wr is China with 33.3
points, followed by Germany and Spain, respectively. However, it was observed that the country having
the highest Wnet is Canada with 51.4 points, followed by England (45.0) and Serbia (39.2), respectively.
4. Conclusion And Discussion
In this study, It is aimed to be predicted the magnitude of the Covid-19 outbreak by using epidemiological
wavelength models in Turkey and at international level. In this way, it is intended to contribute to decision-
makers to make more reliable decisions and to follow the epidemic process more easily.
To begin with, the rst 36 days of wavelengths were predicted in Turkey until 2020-04-16 (including that
date). It was observed that daily case wavelengths in Turkey demonstrated an upward trend, but an
increase in decreasing direction. The increase trend in death wavelengths was below case, recovered case
and net wavelength trend in general. It was monitored that recovered case wavelength increased sharply
after 2020-03-26, and rose steadily. On the other hand, net wavelength reached its peak on 2020-03-26,
and lost momentum after that date in general. It can be argued that measures such as social distancing,
self-isolation and quarantine taken to prevent spread of the epidemic were effective on that decrease in
Wnet. Some of these measures are as follows: It is believed that the curfew imposed on individuals aged
65 and over and individuals with chronic illnesses, which was taken by Ministry of Interior on 2020-03-21,
is considered to be effective [6]. Besides, a curfew was imposed on 2020-04-03 by Ministry of Interior for
individuals aged 20 and under, who are seen as the carriers of the Covid-19 virus in the high-risk group.
Another measure is the inter-provincial travel restrictions, which are thought to be effective in this decline
[7]. In addition, as a result of the decision taken jointly by Ministry of Health and Ministry of Transport
and Infrastructure, measures taken for free distribution of mask distribution across the country through
an online platform are also thought to play an important role in the decrease in net wavelength [8].
Furthermore, With the decision of the Ministry of Health, citizens coming from abroad were quarantined
for 14 days in hospitals or other designated places [35].
The rst 3 countries having the highest case wavelength are China (33.6), Turkey (33.2), Iran (30.4) in 114
countries at the end of the rst 36-day period. The country with the highest death wavelength was
observed to be China with 23.5 points as in case wavelength. That country was followed by Iran and
Turkey, respectively. On the other hand, the highest country in recovered case wavelength is China (30.7),
as in previous wavelengths, followed by Iran and Turkey, respectively. Lastly, the country having the
highest net wavelength was Serbia (36.5), followed by Netherlands (33.5) and Portugal (30.3),
respectively.
Page 9/19It was observed that the country having the highest wavelength in 185 countries was USA (39.7) in the
time period until 2020-04-16 (including that date) regardless of the rst 36 days. That country was
followed by Spain (35.9) and Italy (35.6), respectively. The country with the highest death wavelength is
the USA (30.7), as in case wavelength, followed by Italy and Spain, respectively. On the other hand, the
country with the highest recovered case wavelength was China (33.3), followed by Germany and Spain,
respectively. However, the rst 3 countries with the highest net wavelength are Canada (51.4), England
(45) and Serbia (39.2), respectively.
In the study, the epidemic process can be monitored more closely by revealing both daily and cumulative
wavelengths from the day when the rst case of Covid-19 was observed in each country. Thus, decision
makers can make faster and more reliable decisions by managing the epidemic's development process
better.
Limitations
The wavelength study is a study to reveal the current situation. Therefore, the wavelength ndings
obtained are not forecastable for the future. However, it is always possible to make a forecast study with
different methods by accepting the ndings obtained as input. On the other hand, the measures taken by
countries against the coronavirus pandemic except Turkey is not known exactly. Therefore, the
wavelength ndings of these countries could not be handled in depth in the study. If the measures taken
by countries against the disease are known, wavelength ndings will be thoroughly evaluated.
Declarations
Competing interests: The authors declare no competing interests
References
1. Microsoft Corporation. (2018). Microsoft Excel. Retrieved from https://o ce.microsoft.com/excel
2. R Core Team. (2018). “R: A language and environment for statistical computing. R Foundation for
Statistical Computing”. Vienna, Austria. URL: https://www.r-project.org.
3. United Nations O ce for the Coordination of Humanitarian Affairs (OCHA), The Humanitarian Data
Exchange (HDX). URL: https://data.humdata.org. Access Date: April 17, 2020.
4. Republic of Turkey Ministry of Health. COVID-19 Information Platform. URL:
https://Covid19.saglik.gov.tr. Access Date: April 17, 2020.
5. Bulut, T. “New Epidemiological Model Suggestions Revealing Size of Epidemics Based on the COVID-
19 Pandemic Example: Wavelength Models”. medRxiv; 2020. DOI: 10.1101/2020.04.07.20056432.
6. Republic of Turkey Ministry of Interior. “Curfew Circular on Those 65 and Over and Chronic Diseases
Dated 2020-03-21”. URL: https://www.icisleri.gov.tr/65-yas-ve-ustu-ile-kronik-rahatsizligi-olanlara-
sokaga-cikma-yasagi-genelgesi. Access Date: April 20, 2020.
Page 10/197. Republic of Turkey Ministry of Interior. “City Entry / Exit Notices and Age Restriction Circular (Annex
Circular) Dated 2020-04-13”. URL: https://www.icisleri.gov.tr/sehir-giriscikis-tebirleri-ve-yas-
sinirlamasi. Access Date: April 20, 2020.
8. Republic of Turkey Ministry of Health and Republic of Turkey Ministry of Transport and
Infrastructure. “Free Mask Distribution”. URL: https://basvuru.turkiye.gov.tr. Access Date: April 20,
2020.
9. Mayo Clinic. "Coronavirus disease 2019 (COVID-19)—Symptoms and causes". Access Date: April 14,
2020.
10. Hui, D. S., I Azhar, E., Madani, T. A., Ntoumi, F., Kock, R., Dar, O., Ippolito, G., Mchugh, T. D., Memish, Z.
A., Drosten, C., Zumla, A., & Petersen, E. (2020). The continuing 2019-nCoV epidemic threat of novel
coronaviruses to global health - The latest 2019 novel coronavirus outbreak in Wuhan, China.
International journal of infectious diseases: IJID: o cial publication of the International Society for
Infectious Diseases, 91, 264-266. https://doi.org/10.1016/j.ijid.2020.01.009. PMID: 31953166.
11. World Health Organization (WHO). Press Release."WHO Director-General's opening remarks at the
media brie ng on COVID-19". Access Date: March 12, 2020.
12. Hopkins, Claire. "Loss of sense of smell as marker of COVID-19 infection". Ear, Nose and Throat
surgery body of United Kingdom. URL: https://www.entuk.org/loss-sense-smell-marker-Covid-19-
infection. Access Date: March 28, 2020.
13. Velavan, T. P.; Meyer, C. G. (March 2020). "The COVID-19 epidemic". Tropical Medicine & International
Health. n/a(n/a): 278–80. DOI:1111/tmi.13383. PMID 32052514.
14. National Institutes of Health (NIH). "New coronavirus stable for hours on surfaces". URL:
https://www.nih.gov/news-events/news-releases/new-coronavirus-stable-hours-surfaces. Access
Date: March 23, 2020.
15. Centers for Disease Control and Prevention (CDC). "Interim Guidelines for Collecting, Handling, and
Testing Clinical Specimens from Persons for Coronavirus Disease 2019 (COVID-19)". Access Date:
March 26, 2020.
16. American College of Radiology. "ACR Recommendations for the use of Chest Radiography and
Computed Tomography (CT) for Suspected COVID-19 Infection". Access Date: March 22, 2020.
17. Centers for Disease Control and Prevention (CDC). "How to Protect Yourself & Others". Access Date:
April 8, 2020.
18. Fisher D, Heymann D (February 2020). "Q&A: The novel coronavirus outbreak causing COVID-19".
BMC Medicine. 18 (1): 57. DOI:10.1186/s12916-020-01533-w. PMC 7047369. PMID 32106852.
19. Kui L, Fang YY, Deng Y, Liu W, Wang MF, Ma JP, et al. (February 2020). "Clinical characteristics of
novel coronavirus cases in tertiary hospitals in Hubei Province". Chinese Medical Journal: 1. DOI:
10.1097/CM9.0000000000000744. PMID 32044814.
20. Wang T, Du Z, Zhu F, Cao Z, An Y, Gao Y, Jiang B (March 2020). "Comorbidities and multi-organ
injuries in the treatment of COVID-19". Lancet. Elsevier BV. 395 (10228): e52. DOI:10.1016/s0140-
6736(20)30558-4. PMID 32171074.
Page 11/1921. Wang, Yixuan; Wang, Yuyi; Chen, Yan; Qin, Qingsong. "Unique epidemiological and clinical features of
the emerging 2019 novel coronavirus pneumonia (COVID-19) implicate special control measures".
Journal of Medical Virology. n/a (n/a). DOI:10.1002/jmv.25748. ISSN 1096-9071.
22. Wang T, Du Z, Zhu F, Cao Z, An Y, Gao Y, Jiang B (March 2020). "Comorbidities and multi-organ
injuries in the treatment of COVID-19". Lancet. Elsevier BV. 395 (10228): e52. DOI: 10.1016/s0140-
6736(20)30558-4. PMID 32171074.
23. Tang, Ning; Bai, Huan; Chen, Xing; Gong, Jiale; Li, Dengju; Sun, Ziyong. "Anticoagulant treatment is
associated with decreased mortality in severe coronavirus disease 2019 patients with coagulopathy".
Journal of Thrombosis and Haemostasis. n/a (n/a). DOI:10.1111/jth.14817. ISSN 1538-7836.
24. World Health Organization (WHO). “Report of the WHO-China Joint Mission on Coronavirus Disease
2019 (COVID-19)”. Access Date: February 29 , 2020.
25. Castagnoli, R; Votto, M; Licari, A (April 2020). "Severe Acute Respiratory Syndrome Coronavirus 2
(SARS-CoV-2) Infection in Children and Adolescents A Systematic Review". JAMA Pediatrics. DOI:
10.1001/jamapediatrics.2020.1467.
26. Palmieri L, Andrianou X, Barbariol P, Bella A, Bellino S, Benelli E, et al. (3 April 2020). Characteristics
of COVID-19 patients dying in Italy. Report. Istituto Superiore di Sanità. Access Date: April 3, 2020.
27. Ji Y, Ma Z, Peppelenbosch MP, Pan Q (February 2020). "Potential association between COVID-19
mortality and health-care resource availability". Lancet Global Health. 8 (4): e480.
DOI:10.1016/S2214-109X(20)30068-1. PMID 32109372.
28. Ritchie, Hannah and Roser, Max (25 March 2020). Chivers, Tom (ed.). "What do we know about the
risk of dying from COVID-19?". URL: https://ourworldindata.org/Covid-mortality-risk. Access Date:
March 28, 2020.
29. "What do we know about the risk of dying from COVID-19?". Our World in Data. URL:
https://ourworldindata.org/Covid-mortality-risk. Access Date: March 8, 2020.
30. William C. Shiel Jr., MD, FACP, FACR. "Medical De nition of Prevalence". URL:
https://www.medicinenet.com/script/main/art.asp?articlekey=11697. Access Date: December 3,
2019.
31. Louise-Anne McNutt and Allison Krug. "Incidence”. Epidemiology. Encyclopaedia Britannica. URL:
https://www.britannica.com/science/incidence-epidemiology. Access Date: April 3, 2020.
32. Statistical Notes for Health Planners. No: 3. Mortality. Kleinman, J. C. February 1977. 16 pp. (HRA)
77-1237.
33. Rebecca A. Harrington. “Case fatality rate”. Encyclopedia Britannica. URL:
https://www.britannica.com/science/case-fatality-rate. Access Date: April 4, 2020.
34. World Health Organization (WHO). “How does COVID-19 spread”. URL: https://www.who.int/news-
room/q-a-detail/q-a-coronaviruses. Access Date: April 26, 2020.
35. Republic of Turkey Ministry of Health. “Monitoring (Quarantine) Rules For New Coronavirus Virus at
Home”. URL: https://acilafet.saglik.gov.tr/TR,64512/korona.html. Access Date: April 17, 2020.
Page 12/1936. Turkish Statistical Institute. URL: http://www.tuik.gov.tr/PreHaberBultenleri.do?id=33705. Access
Date: April 26, 2020.
37. Handbook of Vital Statistics Systems and Methods, Volume 1: Legal, Organisational and Technical
Aspects, United Nations Studies in Methods, Glossary, Series F, No. 35, United Nations, New York
1991.
Figures
Figure 1
Number of Covid-19 Cases and Tests by Day in Turkey. Data Source: Republic of Turkey Ministry of
Health
Page 13/19Figure 2
Epidemiological Rates of COVID-19 Cases by Day in Turkey. Data Source: Republic of Turkey Ministry of
Health
Page 14/19Figure 3
Daily Wavelengths in Turkey. Data Source: Republic of Turkey Ministry of Health
Page 15/19Figure 4
The First 36-Day Wavelengths in the World. Data Source: The Humanitarian Data Exchange (HDX)
Page 16/19Figure 5
The First 36-Day Wavelengths by Countries. Data Source: The Humanitarian Data Exchange (HDX)
Page 17/19Figure 6
Wavelengths in the World on April 16, 2020. Data Source: The Humanitarian Data Exchange (HDX)
Page 18/19Figure 7
Wavelengths by Countries on April 16, 2020. Data Source: The Humanitarian Data Exchange (HDX)
Supplementary Files
This is a list of supplementary les associated with this preprint. Click to download.
datasetday36countries.xlsx
datasetfullofcountries.xlsx
Turkeydata.xlsx
Page 19/19You can also read