EEG representing on brain surface using volume rendering
←
→
Page content transcription
If your browser does not render page correctly, please read the page content below
Embedded Self Organizing Systems (Vol 8. No 1. 2021) (pp.10-15)

                                        Issue Topic: “Intelligent Approaches for Smart Cities“

           EEG representing on brain surface using volume
                             rendering
           Klementev Dmitrii                                                                                   Wolfram Hardt
                                                             Guzhov Vladimir                            Technische Universität Chemnitz
    Novosibirsk State Technical University
      Department of Computer Science                Novosibirsk State Technical University              Department of Computer Science
      KlementevDmitryRu@gmail.com                    Department of data collection and
                                                             processing systems

    Abstract 1—Brain research is challenging. One of the                     with neuronal degeneration, for example, their
standard research methods is electroencephalography (EEG).                   demyelination [3]. This poses the purpose of introducing
As a rule, this study is presented in the form of graphs. This               new methods for studying the behavior of neurons.
article describes an approach in which this data is mapped
onto a brain model generated from an magnetic resonance                          A long-standing goal of researchers has been to map the
imaging (MRI) scan. This allows you to look at the EEG study                 electrical activity of neurons in the brain in an awake, active
from a different point of view. An MRI scan will also allow you              person. Electroencephalography is one such technique,
to take into account some of the features of the brain. This is              examining electrical activity on the surface of the cerebral
an advantage over mapping just to a brain template. This non-
                                                                             cortex. It is non-invasive and allows research to be carried
invasive system can be implemented to monitor the patient in
real time, for example, during space flight.
                                                                             out while awake and active, because does not require a
                                                                             rigidly fixed position of the patient. As part of a traditional
    Keywords—medical IT; magnetic resonance imaging (MRI);                   electroencephalographic study, the current method allows
electroencephalogram (EEG); volume rendering; gradient                       the electrical activity of the brain to be displayed on its
calculation; medical image processing; rendering; brain.                     volumetric model. This method can be important from the
                                                                             point of view of studying the behavior of the propagation of
                        I.      INTRODUCTION                                 waves of activity over the surface of the brain in the context
    Nowadays, there is a set of medical methods that can                     of various defects: gross disorders, degradation of
improve the quality and duration of life. One of the most                    convolutions (a decrease in their severity), local damage due
modern and promising techniques is a broad direction aimed                   to hypertension, etc. Potentially, a local reduction of blood
at the artificial growth of organs [1] that can be transplanted              flow in the cerebral arteries can be diagnosed, since blood is
to humans. This approach solves many problems at once:                       a supplier of glucose consumed by neurons during its
                                                                             working cycle, and in the case of its lack, the activity of
      1.   The risk of unsuccessful organ transplantation to a
                                                                             neurons should decrease [4], which can probably be
           person decreases because there is an opportunity to
                                                                             displayed by the proposed method. Usually, such a
           grow organs for a specific person based on his stem
                                                                             reduction is detected after conducting magnetic resonance
           cells [2].
                                                                             imaging, but the latter method is costly and not always
      2.   The problem of the lack             of   organs    for            available and requires sophisticated equipment. The
           transplantation is being solved.                                  electroencephalograph is a simpler and easier-to-transport
                                                                             device. The diagnosis of blood flow reduction is an
    However, the brain is a special organ because it cannot
                                                                             important diagnosis because it can result from narrowing of
be transplanted. This presents scientists and medical
                                                                             the artery, which increases the chance of thrombosis.
professionals with the challenge of preventing and treating
brain disease. All of this requires a deep understanding of                     In brain research work, as a rule, to show the signal of
how the brain works. As a rule, such diseases are associated                 an electroencephalograph or its interpretation, they use
                                                                             graphs or display the result on a template two-dimensional
1
    Copyright © 2021 by ESS Journal                                          model of the head, shown above [5, 6]. Charts do not

                                                                    ~ 10 ~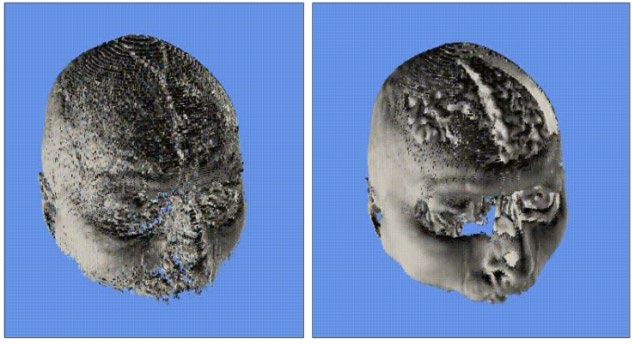
Klementev Dmitrii, et. al. ESS (Vol 8. No 1. 2021) (pp.10-15)
provide spatial representation of data, and the template does A. Direct Volume Rendering method
not allow to take into account the individual characteristics In this MRI technique, the texture is scanned by rays.
of a particular brain, although it facilitates data averaging. Each ray is emitted from a screen pixel (output texture),
The use of a three-dimensional model of the brain obtained where the screen is a rectangle in an arbitrary region of
from an MRI image allows a more accurate display of the space, and its pixels are represented by a set of points in this
result for each specific individual. rectangle. The direction of the ray depends on the type of
The goal of this work is to extract voxels corresponding camera used for rendering. In the case of orthography, the
to the brain and display EEG data on it, given the spatial rays are directed straight. In the case of perspective - at a
location of the sensors on the surface of the head relative to variable angle. The MRI texture is a unit cube. In the cycle,
the surface of the brain. the ray makes a constant step from its origin in its direction
until it leaves the unit cube of the MRI texture. Each step it
II. RESEARCH QUESTIONS AND OBJECTIVES samples data from the MRI texture and, using the formulas
MRI data is a three-dimensional texture, each voxel of (1, 2), accumulates the final color. C is the color, A is the
which stores a radio frequency response from an elementary opacity. Since the rectangle representing the screen is
volume around a point. Such information is not an optical located at an arbitrary point in space, for a faster calculation
property; therefore, working with an MRI texture requires it is recommended to additionally calculate the first point of
calculating various characteristics, as well as mapping the intersection of the ray with the unit cube and define it as the
voxel space into the optical property space in one way or starting point of the ray. When changing the position of a
another, i.e. informing each voxel about its color, cube or screen rectangle, it is necessary to recalculate the
transparency and shading depending on its scalar value, its first intersection of the ray with the unit cube.
absolute or relative position.
(1)
It should also be taken into account that MRI textures
often have different dimensions along one of the axes,
which can complicate the visual representation of the (2)
processed data. Isolation of the brain is challenging due to
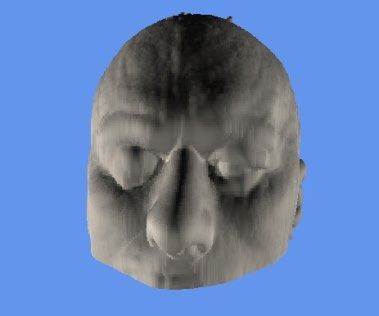
B. Tissue surface rendering method.
the great variability in the quality of MRI data. You need to
try different methods that will be associated with the render This method is similar to direct volume rendering. The
method. only difference is that the ray stops immediately upon
collision with the target tissue, and the tissue opacity is 1,
The article outlined the features of various methods of i.e. maximum. This makes it easy to render the surface. This
MRI rendering and brain isolation, which were encountered makes it easy to display the surface. This method also needs
in the course of work. This is an integral part of it, since, to compute the shading that requires surface normal. The
depending on the available data and the desired result, surface normal of a 3D texture can be computed as minus
different approaches can have a dynamic assessment of the the gradient of the scalar data. An example of how this
effectiveness of the application. Thus, the two-dimensional method works is shown in the figure 1.
transfer function described below can have a relatively
increased accuracy in the brain of animals or a brain that has
topological features. Specifically, we address the following
research question: How exactly should the MRI texture be
processed and what methods should be used to isolate the
brain, as well as what methods of working with the EEG
should be used to display the EEG data of high quality?
III. PROPOSED SOLUTION APPROACH
Our approach uses an EEG device connected through a
set of sensors to the surface of the head and broadcasting a Fig. 1. Example of Tissue surface rendering method.
stream of data about the electrical activity recorded by each
sensor. The brain is rendered using GPUs and compute V. BRAIN EXTRACTION
shaders, which allows real-time data processing due to high To display the data on the brain, it must be extracted from
performance on a specific task. The rendering algorithm will the MRI data. The task of isolating the brain is difficult, as it
be based on the Direct Volume Rendering method. Different is based on the input MRI data, which varies over a wide
methods of brain extraction will be considered, using range. We distinguish the following approaches to this task:
LOOK-UP-TABLE and one of the automatic algorithms.
A. One-dimensional transfer function.
IV. MRI TEXTURE RENDERING METHODS It is the most common way to isolate various tissues,
There are many methods for rendering MRI textures. We including the brain. Often, the developers of MRI devices
will highlight two in this paper: provide a set of ranges of values corresponding to a
1. Direct volume rendering method particular tissue, which allows you to immediately fill a
2. Tissue surface rendering method one-dimensional transfer function according to already
known conditions. If the developers do not provide ranges
of values or they are not enough, you must select them
~ 11 ~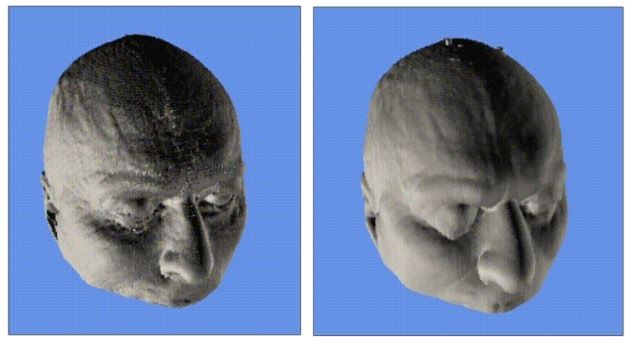
Klementev Dmitrii, et. al.                                                                ESS (Vol 8. No 1. 2021) (pp.10-15)

manually. For this, a one-dimensional histogram is                          method of two-dimensional transfer function is
calculated, where each bin stores the value of the number of                characterized by the selection of boundaries between
voxels with a certain scalar value, and then peaks                          tissues, and not the tissues themselves, which have a single
corresponding to scalar data are selected on this histogram.                or small depth and at the same time do not describe the
At the same time, to increase the severity of peaks, it is                  volume of the tissue in the direction of the ray. Greater
recommended to use a logarithmic scale, rather than a linear                depth has the advantage that the ray, passing through it,
one.                                                                        accumulates its constant optical properties and changes the
                                                                            color it stores accordingly. This allows you to visually
B. Two-dimensional transfer function.
                                                                            perceive relative color changes and interpret through this
   The use of a two-dimensional transfer function is an                     distance to another tissue (fig. 3 (c)) shows an example of
extension of the one-dimensional transfer function                          using the one-dimensional transfer function method, which
approach. To construct the transfer function in this method,                retains the depth effect, since the transfer function highlights
a two-dimensional histogram is used, where the values of                    the entire tissue, including its interior. Figure 3 (d) shows an
the derivative along the gradient are located along the                     enlarged segment of this example. As you can see, with the
second axis, which is simply the magnitude of the gradient.                 expansion, the pixel color is shifted to red. Thanks to this,
The advantage of this method is that it allows you to select                the human brain can perceive volume.
those tissues that are indistinguishable when using a one-                     To solve the problem of the effect of depth, it is
dimensional histogram [7]. It should be remembered that                     necessary to perceive the boundaries as smooth surfaces and
this method is not an ultimatum. It does improve quality, but               use the shading method. Figure 3 (b) shows an example of
it may not be enough.                                                       the impact of this approach. In this example, we used Phong
   The 2D transfer function allows you to highlight the                     shading. As you can see, this improves the perception of the
boundaries, which are expressed by arches on the 2D                         geometry.
histogram. (fig. 2)

                                                                                              (a)                               (b)

                Fig. 2. Two-dimensional histogram.

C. Ready-made automatic algorithms.
   The set of these methods consists of off-the-shelf brain
extraction tools such as ROBEX, BET, AFNI and others.
They are well described in article [8]. This approach has the
advantage of being quick and easy to work with, and it often
allows you to isolate data that cannot be extracted using
transfer function methods. However, despite the fact that
these methods are called automatic, sometimes they still
require manual processing. For example, BSE has problems                                      (c)                             (d)
with the separation of the brain and neck. However, the                       Fig. 3. (a) Example of depth loss effect on border rendering (b) border
greatest disadvantage of these methods is that they are black                rendering with shading. (c) Example of rendering with one-dimensional
                                                                            transfer function. Depth loss effect is not observed. (d) Enlarged C image.
boxes and may return incorrect results for brains with any                     The blue arrow shows the direction of muscle depth increasing. Rays
physical disabilities or not suitable for working with the                              become redder in areas with a high depth of muscle.
brain of an animal. Although the same problems are
observed with transfer function methods, they are less                      B. Calculation of the normal.
pronounced.                                                                    To apply shading to an image, you need to know the
                                                                            surface normal. The surface normal in volume data can be
             VI.     RENDERING IMPROVEMENTS                                 calculated as minus the normalized gradient. Therefore, the
A. Depth loss effect                                                        task is to calculate the gradient. The most popular method
                                                                            for calculating gradient in volume data is the center-
   The term “depth” refers to the distance that the ray travels             weighted gradient method. It is calculated as the sum of the
within a selected area, for example, inside a tissue. The                   products of the scalar values of neighbouring voxels by the
smaller the width of the tissue in the direction of the ray, the            vector direction to these voxels. You can take into account
less depth this tissue has in relation to the ray.                          only 6 neighbours, which are located on the axes of 3D
   This is manifested by the loss of perception of the                      texture coordinates, or 26 neighbours, adding those located
geometry of the object. An example of this is shown in                      on the diagonal. Figure 6 (a) shows an example of shading
figure 3 (а). This is a consequence of the fact that the

                                                                   ~ 12 ~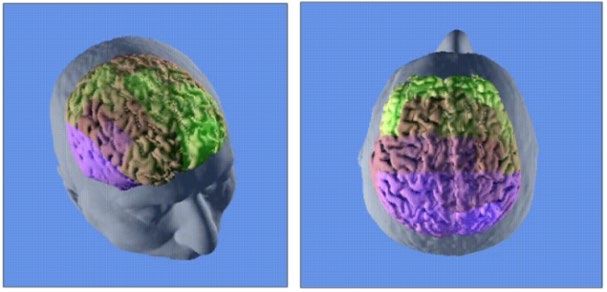
Klementev Dmitrii, et. al. ESS (Vol 8. No 1. 2021) (pp.10-15)
using a 6-point center weighted gradient, Figure 6 (b) shows such a height map by the center-weighted method, the
an example of 26 points. gradient texture will be obtained, shown in the figure 5 (c).
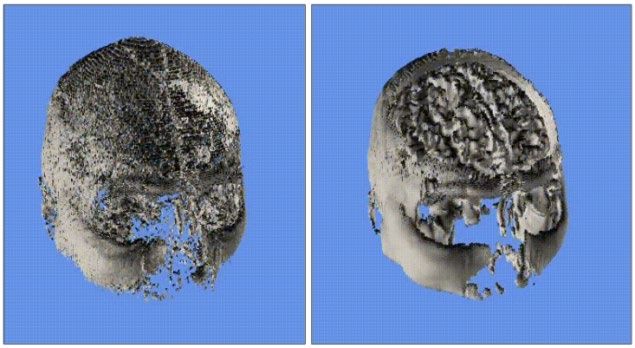
When calculating the gradient, there is a problem of On it, high values of the gradient magnitude enclose the
anisotropy, since often in MRI data voxels along one of the peak in a ring, however, referring to the original data in
axes have a different physical length from the rest. This continuous space, the gradient is equal to zero around the
leads to the fact that a discrete step along this axis leads to a peak. The problem is that the gradient exists between
larger or smaller step in physical space with respect to other discrete elements, but not within them. This is a
axes. There are two approaches to this problem: consequence of the physical limitation of the mapping of
1. Linear data interpolation. continuous space to discrete one.
2. Allow the same spatial resolution.
Figure 4 shows an example of how these two approaches
D. Node gradient calculation method
work. The difference between them is insignificant and is
expressed only in the intensity of shading, so any approach To solve this problem, we propose to calculate the
is allowed. gradient at the nodes between pixels (or voxels for 3D data).
This will allow you to more accurately calculate the
gradient. A natural problem with this approach is that no
scalar value is defined for the nodes. We propose to
calculate it as an average between data items. surrounding
the node. Figure 6 shows an example of rendering a head
surface using three different methods. As you can see, the
26-point center-weighted method gives the smoothest result.
Node gradient calculation method is good at highlighting
slices of the MRI texture.
Based on the nature of these methods, we can distinguish
the following approaches to calculating the gradient,
(a) (b) highlighted by the importance of the data:
Fig. 4. Tissue surface rendering method (a) with linear interpolation (b) 1. scalar > gradient important approach
without linear interpolation. 2. gradient > scalar important approach
C. Problem of the center-weighted gradient method The choice of a specific method is determined by the
There is a center-weighted gradient calculation method formulation of the problem. This paper uses a 26-point
problem. Imagine a certain region of heights in continuous center-weighted gradient method.
space, where the entire surface is flat, excluding a single
peak, and the area of the upper part of this peak tends to
zero (Figure 5 (a)). Let us describe this region of heights
with a two-dimensional discrete texture, and such that the
physical length and width of each pixel is less than the
length and width of the change in the height of the peak.
(a) (b)
(a)
(c)
Fig. 6. Tissue surface rendering method (a) using 6 point central weighted
method (b) using 26 point central weighted method (c) using node gradient
calculation method
(b) (c)
Fig. 5. (a) The peak in continuous space (b) The heightmap (c) The E. Convolution in removing noises
gradient magnitude calculated from the height map.
The presence of noise in the MRI image is one of the
In this case, the pixel describing the peak will store the rendering problems. One way to solve this problem is to use
average height. An example of such a height map is shown convolution. To use this method, you need to create a
in Figure 5 (b). When calculating the gradient magnitude of convolution kernel. For the three-dimensional case, the
kernel is specified as a symmetrical three-dimensional cubic
~ 13 ~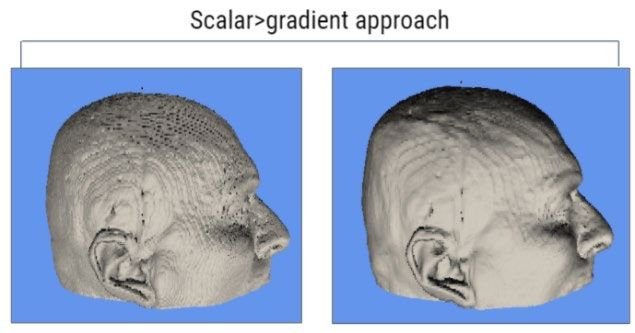
Klementev Dmitrii, et. al.                                                                      ESS (Vol 8. No 1. 2021) (pp.10-15)

texture. For filling the kernel, the most popular distribution                     threshold values of the MRI, the texture after convolution
is Gaussian distribution (3).                                                      shows less noise. The disadvantage of this approach is that
                                                                                   it smoothes the sharpened surface, which leads to a decrease
                                                                    (3)            in the visibility of convolutions, etc.
                                                                                       The kernel does not have to be limited to a Gaussian
                                                                                   distribution. You can try using different distributions, filters
   A kernel is applied to each element of the texture. The                         or breaking symmetry. This provides opportunities for
central value in the kernel is multiplied by the value of the                      further research.
element to which the convolution is applied. The rest of the
elements in the core are multiplied by their neighbours in                                               VII.       EEG MAPPING
accordance with the spatial arrangement of the core and                               EEG is a non-invasive method for studying the electrical
texture elements. The return value is the sum of all these                         activity of the surface of the brain. To display EEG data, it
products. It is important to remember that for the current                         is necessary to set the position of these sensors relative to
task the sum of the elements of the convolution kernel must                        the brain.
be equal to one, i.e. the kernel must be normalized. In this
case, it is not necessary to use a large core, as practice                         A. Installation of EEG sensors.
shows, a core from 3x3 to 7x7 is sufficient. The sigma in the                         It is proposed to set them manually on the MRI image
Gaussian equation determines the degree of smoothing.                              render. It is convenient to do this by some implementation
                                                                                   of the casting algorithm. Since the full MRI texture is
                                                                                   available, it is convenient to position the sensors not relative
                                                                                   to the brain, but relative to the surface of the head. This
                                                                                   gives a better idea of their location.:
                                                                                      The user selects one of the sensors and clicks on the
                                                                                   head's render.
                                                                                      Knowing the initial position of the ray, calculated from
                                                                                   the cursor position, and the direction of the ray, the collision
                                                                                   point can be calculated.
                                                                                      To calculate the collision point, you can use Bresenham's
                                                                                   algorithm for the three-dimensional case, or iterate with a
                                                                                   constant step in the MRI texture space. Figure 8 shows an
                                                                                   example of installed sensors on the head surface.

                                                                                            Fig. 8. Head surface with a set of sensors (red points).

                                                                                   B. Display of instant EEG data
                                                                                      To present EEG data, it is proposed to use an approach in
                                                                                   which an element of the brain surface corresponds to
                                                                                   electrical activity, which is the closest sensor, but with
                                                                                   distances no more than sigma, where sigma is a constant
                                                                                   that depends on the EEG device. An example of such a
                                                                                   display is shown in Figure 9. The color determines the sign,
                                                                                   and the magnitude of the value recorded by the sensor is
                 (a)                              (b)                              displayed as color intensity. This approach allows you to see
                                                                                   the formation of domains on the surface of the brain and
   Fig. 7. Rendering with dynamic threshold value (a) before gaussian
               convolution (b) after gaussian convolution.                         assess the propagation of waves.
                                                                                      An approach was also considered in which the intensity
   If the kernel is based on a Gaussian distribution, then                         depended also on the distance to the sensor, decaying at a
such a convolution results in smoothing of data outliers,                          distance from it. However, this approach gives a poorly
which are noise. Figure 7 shows examples of such a                                 understood image and is characterized by signal mixing.
convolution, where (a) textures without convolution, (b)                              An approach was also considered in which the signal
textures with convolution. For clarity, a different set of                         intensity was linearly interpolated between the nearest
threshold values was used, where the threshold value                               sensors, but the problem with this approach is that for
determined the minimum scalar value in the MRI texture                             correct interpolation, the distance between the sensors on
that was not ignored by the ray. As you can see, at all three                      the surface of the brain, and not in volume, is necessary.

                                                                          ~ 14 ~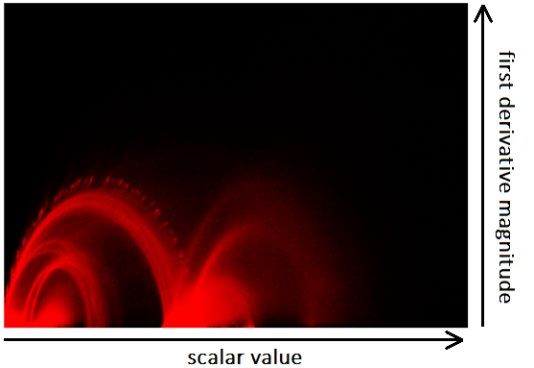
Klementev Dmitrii, et. al. ESS (Vol 8. No 1. 2021) (pp.10-15)
REFERENCES
[1] Wang X. Bioartificial Organ Manufacturing Technologies. Cell
Transplantation. January 2019:5-17. doi:10.1177/0963689718809918
[2] Stegall, M., Chedid, M. & Cornell, L. The role of complement in
antibody-mediated rejection in kidney transplantation. Nat Rev
Nephrol 8, 670–678 (2012). https://doi.org/10.1038/nrneph.2012.212
[3] Lucchinetti, C., Brück, W., Parisi, J., Scheithauer, B., Rodriguez, M.
and Lassmann, H. (2000), Heterogeneity of multiple sclerosis lesions:
Implications for the pathogenesis of demyelination. Ann Neurol., 47:
707-717.
[4] Attwell, D., Buchan, A., Charpak, S. et al. Glial and neuronal control
of brain blood flow. Nature 468, 232–243 (2010).
https://doi.org/10.1038/nature09613
Fig. 9. Displaying of instant EEG data. Green is a positive value, blue is a [5] Article Source: Fractal Dimension of EEG Activity Senses Neuronal
negative value. Impairment in Acute Stroke Zappasodi F, Olejarczyk E, Marzetti L,
Assenza G, Pizzella V, et al. (2014) Fractal Dimension of EEG
Activity Senses Neuronal Impairment in Acute Stroke. PLOS ONE
VI. RESULTS AND CONCLUSIONS 9(6): e100199. https://doi.org/10.1371/journal.pone.0100199
In this paper, a method for displaying EEG data on the [6] Ginatempo F, Fois C, De Carli F, Todesco S, Mercante B, Sechi G,
Deriu F. Effect of short-term transcutaneous trigeminal nerve
surface of the brain was considered. The brain was extracted stimulation on EEG activity in drug-resistant epilepsy. J Neurol Sci.
2019 May 15;400:90-96. doi: 10.1016/j.jns.2019.03.004. Epub 2019
with an automatic algorithm that provided a voxel mask of Mar 14. PMID: 30904691.
the corresponding tissues. Depending on the quality of the [7] Joe Kniss and Gordon Kindlman. Multidimensional Transfer
Function for Volume Rendering. In IEEE Transaction on
data, one-dimensional or two-dimensional transfer function Visualization and Computer Graphics, August 2002..
methods can be used for this task. The render shows that [8] Iglesias, J. E., Cheng-Yi Liu, Thompson, P. M., Zhuowen Tu. Robust
Brain Extraction Across Datasets and Comparison With Publicly
domains are formed on the surface of the brain - areas of Available Methods. IEEE Transactions on Medical Imaging, 30(9).
electroactivity with a similar sign and value.This study can [9] Klementev D. MRI rendering with EEG sensors projection.
International symposium on computer science, computer engineering
be improved by adding a display of the total energy that was and educational technologies (ISCSET-2020), Mongolia,
recorded by each sensor over the last few ticks. This will Ulaanbaatar, 21–23 Oct. 2020
[10] Milan Ikits, Joe Kniss, Aaron Lefohn, Charles Hansen. GPU Gems.
improve the perception of active areas of the brain. An 2007.
overview of the effect of Gaussian convolution, which [11] Yumchmaa Ayush, Uranchimeg Tudevdagva. Medical Diagnostic
Expert System for Training and Decision Support of Early Stage
reduces noise, was also presented. There is a way for further Diagnoses. IN Creativity in Intelligent Technologies and Data
work in this direction. You can study the effect of different Science. CIT&DS 2019. Communications in Computer and
Information Science, page 393 - 407, Springer International
convolution kernels on noise smoothing, brain selection, Publishing, August 2019. ISBN: 978-3-030-29749-7
and more. [12] Gordon Kindlman and James W. Durkin. Semi-Automatic Generation
of Transfer Functions for Direct Volume Rendering. In IEEE
Node gradient calculation method was presented. This is Symposium On Volume Visualization, pages 79-86, 1998.
an interpretation of the center-weighted gradient calculation [13] Uranchimeg Tudevdagva, Wolfram Hardt, Galina V. Troshina. Image
Processing Based Insulator Fault Detection Method TUC OPAC. IN
method. This method can be applied in various areas of 2018 XIV International Scientific-Technical Conference on Actual
Problems of Electronics Instrument Engineering (APEIE), page 579 -
modeling. It has the advantage of a more accurate gradient 583, Technische Hochschule Ingolstadt Zentrum für Angewandte
calculation, but it has the disadvantage of losing the Forschung (ZAF), Esplanade 10, 85049 Ingolstadt, November 2018.
ISBN: 978-1-5386-7054-5, ISSN: 2473-8573.
originality of the original data. [14] Ljung P., Krueger J., Groeller E., Hadwiger M., Hansen C.,
Increasing the density of the sensors can show a more Ynnerman A.. State of the Art in Transfer Function for Direct
Volume Rendering. Computer graphic forum, 35(3), 669-691, June
accurate picture. Of particular interest is the improvement of 2016
resolution near the arteries. This improvement could show [15] Jia-Wan Zhang and Ji-Zhou Sun, Adaptive transfer function design
for volume rendering by using a general regression neural network.
the effect of blood flow on the electrical activity of the Proceedings of the 2003 International Conference on Machine
Learning and Cybernetics, 2003.
cerebral cortex. [16] Uranchimeg Tudevdagva, Batbayar Battseren. Application of image
processing algorithm: Fault detection of insulators for HVTL TUC
OPAC. IN Proceedings on Information and Media Technology, IMT
2018 conference, page 139 - 142, MUST, Ulaanbaatar, Mongolia,
Mongolian University of Science and Technology, Mongolia, May
2018. ISBN: 999737160-7
[17] J. Hesser, R. Männer, D. F. Braus, G. Ende & F. A. Henn. Real-time
direct volume rendering in functional magnetic resonance imaging.
Magnetic Resonance Materials in Physics, Biology and Medicine
volume 5, 1997.
~ 15 ~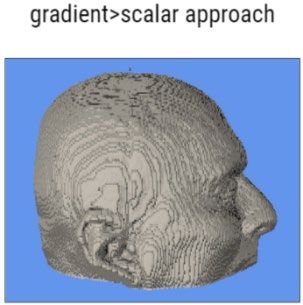

You can also read