Integrated Structural Health Monitoring Systems for Buildings - Memscon
←
→
Page content transcription
If your browser does not render page correctly, please read the page content below
Integrated Structural Health Monitoring Systems for Buildings

                                            D. Inaudia,b,.R. Waldera
                             a
                             SMARTEC SA, Via Pobiette 11, 6928 Manno, Switzerland
                     b
                         ROCTEST Ltd., 665 Pine Avenue, Saint-Lambert, Quebec, Canada J4P 2P4

Abstract

     When designing a Structural Health Monitoring system, one should always focus on the specific requirements of the
structure under exam. The first step in the design process consists in identifying the probable degradation mechanism and
the associated risks, in cooperation with the structure’s owner and designer. Next, the expected responses to these
degradations are established and an appropriate Structural Health Monitoring Systems is designed to detect such
conditions. Only at this stage, the appropriate sensors are selected. Once the sensors are installed and verified, data
collection can start. If these logical steps are followed and the monitoring data is correctly acquired and managed, data
analysis and interpretation will be greatly simplified. On the other hand, if one designs an SHM system starting from a
specific sensor system, it often ends up with a large quantity of data, but no plans on how to analyze it.
     When selecting the best sensors for the specific risks associated with a given structure, it is often necessary to
combine different measurement technologies. As an example, a high-rise building could require fiber optic sensors for strain
monitoring, a corrosion monitoring system for the concrete pylon, vibrating wire pressure cells for measuring the pile loads
in the foundations and a laser distance meter to observe the global deformations. To insure that the data from these
systems is correctly fused and correlations between the measurements can be found, an integrated data acquisition and
management system is required. Our experience has shown that the use of relational database structures can greatly
simplify the handling of this large and heterogeneous data-flow. With an appropriate data structure, the measurement data
and other related information on the monitoring network, the structure and its environment can be organized in a single
repository that will follow the structure's life in the years.

Keywords: Structural Health Monitoring, monitoring strategies, instrumentation, damage detection

1. Integrated Structural Health Monitoring systems              resulting from the monitoring program are used to improve
for buildings                                                   the operation, the maintenance, the repair and the
                                                                replacement of the structure based on reliable and objective
     High-rise buildings and arena/stadium are complex          data. Detection of ongoing damages can be used to
structures. They are made of multiple elements and              discriminate deviations from the design performance.
components that are stressed and interact with one              Monitoring data can be integrated in structural management
another when exposed to external actions. Buildings             systems and increase the quality of decisions by providing
vary widely in size, geometry, structural system,               reliable and unbiased information.
construction material, and foundation characteristics.               The malfunctioning of residential, high-rise buildings and
These attributes influence how a building performs              arena/stadiums can often have serious consequences. The
when overcharged or when under stress of natural                most severe are failures involving human victims. Even when
events.                                                         there is no loss of life, populations suffer if the structure is
     Structural Health Monitoring allows rapid                  partially or completely out of service. The economic impact
assessment of a building’s state of health and such             of structural deficiency is reflected by costs of reconstruction
approach is becoming recognized as a proper mean to             as well as losses in the other branches of the economy.
increase the safety and optimize operational and                     Learning how a building performs in real conditions will
maintenance activities of complex buildings. The data           help to design better structures for the future. This can lead

                                                           65
                     Fig. 1: Integration of sensing technologies into a single database / user interface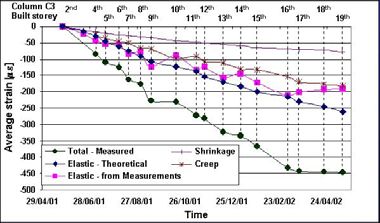
to cheaper, safer and more durable structures with Data collection: None, Manual, Off-line, On-line, Real-
increased reliability, performance and safety. time.
The life of each structure is far from being All these types of monitoring can be mixed and
monotonous and predictable. Much like our own combined according to the specific need of the bridge under
existence, its evolution depends on many uncertain exam. This freedom requires a rigorous design approach to
events, both internal and external. Some uncertainties select the appropriate approach.
arise right during construction, creating structural
behaviors that are not predictable by design and 1.2. System integration
simulations. Once in use, each structure is subject to
evolving patterns of loads and other actions. Often the It is of fundamental importance that a monitoring system
intensity and type of solicitation are very different from is designed as an integrated system, with all data flowing to
the ones taken into account during its design and in a single database and presented through a single user
many cases they are mostly unknown in both nature interface. The integration between the different sensing
and magnitude. The sum of these uncertainties created technologies that can be simultaneously installed on the
during design, construction and use, poses a great structure, e.g. fiber optic sensors [5, 1], vibrating wire
challenge to the engineers and institutions in charge of sensors, tilt meters, weather stations and corrosion sensors
building safety, maintenance and operation. Defining can be achieved at several levels. Different sensors can be
service levels and prioritizing maintenance budgets connected to the same data logger; otherwise several data
relying only on models and superficial observation can loggers can report to a single data management system,
lead to dangerous mistakes and inefficient use of typically a PC, which can be installed either on site or at a
resources. Regular inspection can certainly reduce the remote location. The data management system must
level of uncertainty, but still presents important interface to all types of data loggers and translate the
limitations being limited to the observation of the incoming data into a single format that is forwarded to the
structure's surface during short times spaced by long database system as shown in figure 1.
periods of inactivity. Although many vendors of sensors and data acquisition
Structural Health Monitoring aims to provide more systems provide their own software for data management
reliable and up-to-date information on the real and presentation, these tend to be a closed system that can
conditions of a structure, observe its evolution and only handle data from their specific sensors. Since a
detect the appearance of new degradations. By monitoring project often requires the integration of several
permanently installing a number of sensors, technologies, it is important to provide the end-user with a
continuously measuring parameters relevant to the single integrated interface that does not require him to learn
structural conditions and other important environmental and interact with several different user interfaces.
parameters, it is possible to obtain a real-time picture of
the structure's state and evolution [1]. 1.3. Benefits of SHM
Instrumental Monitoring is a new safety and
management tool that ideally complements traditional The benefits of having a Structural Health
methods like visual inspection and modeling. Monitoring system installed on a building or any significant
Monitoring even allows a better planning of the structure are many and depend on the specific application.
inspection and maintenance activities, shifting from Here are the more common ones:
scheduled interventions to on-demand inspection and Monitoring reduces uncertainty
maintenance [2]. Monitoring discovers hidden structural reserves
Monitoring discovers deficiencies in time and
1.1. Monitoring strategies increases safety
Monitoring insures long-term quality
Each monitoring project presents its peculiarities
Monitoring allows structural management
and although it is possible to standardize most
Monitoring increases knowledge.
elements of a monitoring system, each application is
unique in the way they are combined.
2. Designing and implementing an SHM system
It is however possible to classify the monitoring
components according to several categories [3,4],
Designing and implementing an effective Structural
Scale: Local scale, Member scale, Global scale,
Health Monitoring System is a process that must be carried
Network scale.
out following a logical sequence of analysis steps and
Parameter: Mechanical, Physical, Chemical, decisions. Too often SHM systems have been installed
Environmental, Actions. without a real analysis of the owner needs, often based on
Periodicity: Periodic, Semi-continuous, the desire to implement a new technology or follow a trend.
Continuous. These monitoring systems, although perfectly working from a
Response: Static or Dynamic.
Figure 2: Building Figure 3: Recorded deformation after each stage
under monitoring 66
of construction and separation of contributing
components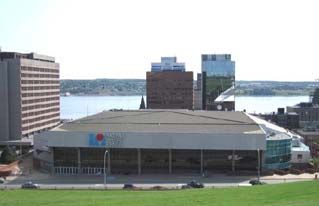
Table 2. typical expected responses and the candidate types of sensors to measure risks
Risk / uncertainty Response / consequence Candidate sensors
Correspondence between Finite Strain distribution and magnitude Local strain sensors, including strain
Element Model and real behavior different from model gauges, vibrating wire gauges and
fiber optic sensors
Dynamic strain due to traffic, wind, Large strains, fatigue, cracks Local strain sensors, including strain
earthquake, explosion,… gauges, vibrating wire gauges and
fiber optic sensors, with dynamic
data acquisition systems. Distributed
fiber optic crack sensors. Crack-
meters
Creep, relaxation of pre-stress Global deformations, bending Long-gauge fiber optic strain
sensors, settlement gauges, laser
distance meters, topography
Correspondence between Mode shapes and frequencies different Accelerometers, long-gauge fiber
calculated and real vibration from model optic strain sensors
modes
Cracking of concrete or steel Crack opening Crack-meters: potentiometers,
vibrating wire or fiber optics
Temperature changes and Strain redistribution, cracking Temperature sensors: electrical,
temperature gradients in load fiber optics point sensors or
bearing elements distributed sensors
Differential settlement between Global movements, tilting, strain Laser distance meters, topography,
foundations redistribution settlement gauges, tilt-meters
Change in water table or pore Change in pore water pressure Piezometers: vibrating wire or fiber
water pressure around optics
foundations
Change in the concrete chemical Corrosion of rebars Concrete corrosion and humidity
environment: carbonation, alkali- sensors
silica reaction, chlorine
penetration
Environmental conditions Actions on building Weather station, wind speed
t
technical point of view, often provide data that is difficult can be used as a starting point for a specific analysis
to analyze or cannot be used by the owner to support pertaining to a given building.
management decisions.
The 7-step procedure that is detailed in [6] and 3. Application example: High-Rise Buildings in
summarized next, has proven over the years to deliver Singapore
integrated Structural Health Monitoring systems that
respond to the needs of all parties involved in the Singapore is a cosmopolitan city-state often
design, construction and operation of structures of all described as a gateway to Asia with a city landscape of tall
kinds. buildings. The Housing and Development Board (HDB), as
Step 1: Identify structures needing monitoring Singapore's public housing authority, has an impressive
Step 2: Risk analysis record of providing a high standard of public housing for
Step 3: Responses to degradations Singaporeans through a comprehensive building program.
Step 4: Design SHM system and select As part of quality assurance of new HDB tall buildings, it was
appropriate sensors decided to perform long-term structural monitoring of a large
Step 5: Installation and Calibration number of new buildings.
Step 6: Data Acquisition and Management Currently more than 200 buildings, such as the one
Step 7: Data Assessment. in Figure 2, have been instrumented and are regularly
Unfortunately, this process is not yet monitored [7]. This monitoring project is considered as a
formalized in the same way as, for example, the pioneering project with two aims: to develop a global
construction process, where codes, laws and monitoring strategy for column-supported structures such as
regulations reduce the uncertainty and improve the buildings, and to collect data related to the behavior of this
interaction between the different actors involved in the buildings providing rich information concerning their behavior
process. Recommendations and drafts codes for the and health conditions. The monitoring is performed during
implementation of SHM system are however starting to the whole lifespan of the building, from construction to the
appear; certainly an important step towards a mature use. Thus, for the first time the sensors are used in a large
SHM industry. scale life cycle monitoring of high-rise buildings.
The aims of monitoring are (1) increase of
2. Buildings SHM knowledge concerning the real structural behavior, (2) verify
the construction process, (3) increase of safety during the
To put the previous methodology in practice, service, (4) enhance maintenance activities and (5)
we will now consider how it can be applied to design evaluation of structural condition after risky events such as
integrated Structural Health Monitoring systems for earthquake, strong wind or terrorist attack. The monitoring is
buildings. performed at (1) local, column level and (2) global, structural
Table 1 discusses the typical expected level.
responses and the candidate types of sensors to The ground columns have been selected for monitoring,
measure risks that are typically found on buildings and being the most critical elements in the building. A total of ten
67long-gauge fiber optic sensors were installed by defined strain thresholds in the beams or deflection
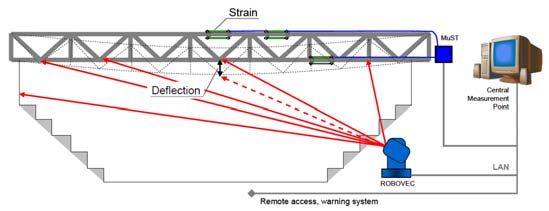
Figure 4: Metro Center Figure 5: Setup with strain and deflection sensors
embedding in each construction block. thresholds of the trusses are measured.
The monitoring program has yielded actionable
results from the insights gained from enlarged 5. Application example: Royal Villa Monza, Italy
knowledge concerning the real column behavior during
construction, including detection of columns with The Royal Villa in Monza, close to Milan, Northern Italy,
abnormal behavior. The detailed analysis of column was built in 1777 – 1779 by architect Piermarini for Maria-
behavior is performed semi-automatically using the Therese of Austria. It was modified by the Italian King
SDB Pro software and notably Concrete Analyzer Umberto I. After the king was killed in 1900, the villa was not
macro-sensor. It was possible to separate different used by the Royal family any more, and it was practically
parts of measured total strain such as elastic strain, abandoned during last decades of the XX century. Cracks
creep and shrinkage as shown in Figure 3. The and degradation of wooden structures are the main issues
monitoring strategy has shown high performance in found in this building prior to restoration. Italian government
spite limitations imposed by design criteria and the and authorities of Milan and Monza decided to renew the
limited number of equipped columns. villa and to transform it into a museum. Due to complex static
system and uncertainties related to structural behavior it was
4. Application example: Halifax Metro Center, decided to monitor the villa before, during and after the work
Canada [8]. Monitoring data was practically used to “govern” renewal
works. Both conventional and optical fiber sensors were
Halifax Metro Centre (Figure 4) has become a first used. The view to Royal villa is shown in Figure 5. Optical
class multi-entertainment, sports facility and exhibition fiber sensors were mainly used as extensometers installed
centre connected to the World Trade and Convention between the walls, orthogonal to the corridor axes, but
Centre, in a strategic downtown location at the centre of shorter sensors were also used for crack monitoring. The
metro business activity. It is the largest arena in Halifax sensors installed between the walls are shown in Figure 6.
and is host to a range of entertainment and sporting The data interpretation and analysis has been
events in the city. The main aim of the project is to statistically carried out, due to the complexity of the structure
measure and monitor in the real-time the strain and and uncertainty related to its static system and structural
deflection of the roof's structure caused by behavior. The monitoring systems installed in the Royal Villa
extraordinary events such as heavy snowfalls or of Monza have allowed the monitoring-based rehabilitation
punctual events happening inside the arena (e.g. process.
concerts) and requiring heavy equipment to be hanged
on the roof's trusses. Since the arena's construction in 6. Conclusions
the late 1970s, the design loads have increased
substantially and there is an ever increasing use of Structural Health Monitoring is not a new technology or
suspended equipment for lights and sound for special trend. Since ancient times, engineers, architects and artisans
events, increasing the loads. The owners therefore have been keen on observing the behaviour of built
decided to conduct a structural investigation of the roof structures to discover any sign of degradation and to extend
structure and provide means to effectively monitor the their knowledge and improve the design of future structures.
actual snow loads and manage the entertainment loads Higher buildings and larger domes were constructed and
suspended from the roof. Based on the research, a sometimes failed during construction or after a short time.
complete Structural Health Monitoring System Those failures and their analysis have led to new insight and
combining MuST fiber-optics strain sensors and a improved design of future structures. As for any engineering
ROBOVEC robotic laser distance meter unit was problem, obtaining reliable data is always the first and
installed and provides real time information on the fundamental step towards finding a solution. Monitoring
status of the roof structure (Figure 5). Both Reading structures is our way to get quantitative data about our
Unit for the fiber optic sensors and Laser instrument are buildings and help us in taking informed decisions about their
connected to the existing LAN and a dedicated PC health and destiny. This paper has presented the
manages the sensors, the data acquisitions and the advantages and challenges related to the implementation of
measurements. The strain data of the fiber optic an integrated Structural Health Monitoring system, guiding
sensors are automatically compensated using the the reader in the process of analyzing the risks associated
corresponding temperature sensors, while the laser with the construction and operation of a specific building and
angle and distance measurements are automatically the design of a matching monitoring system and data
transformed in a deflection value. Warning and alarms analysis strategy.
are dynamically generated and notified when pre-
68Figure 6. Royal Villa in Monza Figure 7. Sensor installation
References
[1] Glisic, B. and Inaudi, D. (2007), Fibre Optic
Methods for Structural Health Monitoring,
Wiley.
[2] Del Grosso, A. and Inaudi, D. (2004) European
perspective on monitoring-based maintenance,
IABMAS 2004, International Association for
Bridge Maintenance and Safety, Kyoto, Japan
(on conference CD).
[3] Glisic, B. and Inaudi, D. (2003) Components of
structural monitoring process and selection of
monitoring system, PT 6th International
Symposium on Field Measurements in
GeoMechanics (FMGM 2003), Oslo, Norway,
755–761.
[4] Glisic, B., Inaudi, D. and Vurpillot, S. (2002)
Whole lifespan monitoring of concrete bridges,
IABMAS’02, First International Conference on
Building Maintenance, Safety and Management,
Abstract on conference CD, Barcelona, Spain,
487–488.
[5] Kersey, A. (1997) Optical fiber sensors, S.
Rastogi P. K. Optical Measurement Techniques
and Applications, Artech House, 217–254.
[6] Inaudi, D., Manetti, L., Glisic, B., “Integrated
Systems for Structural Health Monitoring”, 4th
International Conference on Structural Health
Monitoring on Intelligent Infrastructure (SHMII-
4) July 2009, Zurich, Switzerland.
[7] Glisic, B., at al., Monitoring of building
columns during construction, 5th Asia Pacific
Structural Engineering & Construction
Conference (APSEC), 26-28 August 2003, Johor
Bahru, Malaysia, pages 593-606, 2003.
[8] A. Del Grosso, A. Torre, M. Rosa, B. Lattuada,
Application of SHM techniques in the
restoration of historical buildings: the Royal
Villa of Monza, 2nd European Conference on
Health Monitoring, July 7-9, Munich, Germany,
2004.
69You can also read


