COVID-19 vaccine surveillance report - Week 36 - GOV.UK
←
→
Page content transcription
If your browser does not render page correctly, please read the page content below

COVID-19 vaccine surveillance report
Week 36

1
COVID-19 vaccine surveillance report – week 36

Contents
Contents....................................................................................................................................... 2
Summary...................................................................................................................................... 3
   Vaccine effectiveness ............................................................................................................... 3
   Population impact ..................................................................................................................... 3
Vaccine effectiveness .................................................................................................................. 5
   Effectiveness against symptomatic disease ............................................................................. 5
   Effectiveness against hospitalisation ........................................................................................ 6
   Effectiveness against mortality ................................................................................................. 6
   Effectiveness against infection ................................................................................................. 6
   Effectiveness against transmission .......................................................................................... 7
   Vaccine effectiveness against the Delta variant ....................................................................... 8
Population impact ........................................................................................................................ 9
   Vaccine coverage ..................................................................................................................... 9
   Vaccination status .................................................................................................................. 12
   Vaccine impact on proportion of population with antibodies to COVID-19.............................. 20
   Direct impact on hospitalisations ............................................................................................ 25
   Direct and indirect impact on infection and mortality .............................................................. 27
References................................................................................................................................. 31

                                                                 2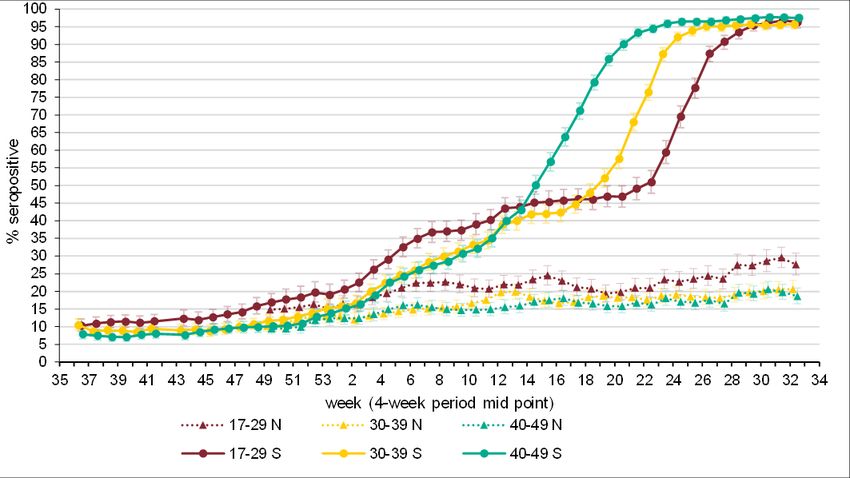
COVID-19 vaccine surveillance report – week 36

Summary
Four coronavirus (COVID-19) vaccines have now been approved for use in the UK.
Rigorous clinical trials have been undertaken to understand the immune response,
safety profile and efficacy of these vaccines as part of the regulatory process. Ongoing
monitoring of the vaccines as they are rolled out in the population is important to
continually ensure that clinical and public health guidance on the vaccination programme
is built upon the best available evidence.

Public Health England (PHE) works closely with the Medicines and Healthcare
Regulatory Agency (MHRA), NHS England, and other government, devolved
administration and academic partners to monitor the COVID-19 vaccination programme.
Details of the vaccine surveillance strategy are set on the Public Health England page
COVID-19: vaccine surveillance strategy (1). As with all vaccines, the safety of COVID-
19 vaccines is continuously being monitored by the MHRA. They conclude that overall,
the benefits of COVID-19 vaccines outweigh any potential risks (2).

Vaccine effectiveness
Several studies of vaccine effectiveness have been conducted in the UK which indicate
that a single dose of either vaccine is between 55 and 70% effective against
symptomatic disease, with higher levels of protection against severe disease including
hospitalisation and death. Additional protection is seen after a second dose. There is
now also evidence from a number of studies that the vaccines are effective at protecting
against infection and transmission.

Population impact
The impact of the vaccination programme on the population is assessed by taking into
account vaccine coverage, evidence on vaccine effectiveness and the latest COVID-19
disease surveillance indicators. Vaccine coverage tells us about the proportion of the
population that have received 1 and 2 doses of COVID-19 vaccines. By 5 September
2021, the overall vaccine uptake in England for dose 1 was 64.6% and 58.1% for dose
2. In line with the programme rollout, coverage is highest in the oldest age groups.

This week, for the first time we present data on COVID-19 cases, hospitalisations and
deaths by vaccination status.

Based on antibody testing of blood donors, 97.7% of the adult population now have
antibodies to COVID-19 from either infection or vaccination compared to 18.1% that
have antibodies from infection alone. Over 95% of adults aged 17 or older have
antibodies from either infection or vaccination.

                                            3
COVID-19 vaccine surveillance report – week 36
The latest estimates indicate that the vaccination programme has directly averted over
143,600 hospitalisations. Analysis on the direct and indirect impact of the vaccination
programme on infections and mortality, suggests the vaccination programme has
prevented between 24.4 and 24.9 million infections and between 108,600 and 116,200
deaths.
4COVID-19 vaccine surveillance report – week 36
Vaccine effectiveness
Large clinical trials have been undertaken for each of the COVID-19 vaccines approved
in the UK which found that they are highly efficacious at preventing symptomatic disease
in the populations that were studied. It is important to continue to evaluate the
effectiveness of vaccines in the 'real world', as this may differ to clinical trial efficacy. The
clinical trials are also performed in order to be able to assess the efficacy of the vaccine
against laboratory confirmed symptomatic disease with a relatively short follow up period
so that effective vaccines can be introduced as rapidly as possible. Nevertheless,
understanding the effectiveness against different outcomes (such as severe disease and
onwards transmission), effectiveness in different subgroups of the population and
understanding the duration of protection are equally important in decision making around
which vaccines should be implemented as the programme evolves, who they should be
offered to and whether booster doses are required.
Vaccine effectiveness is estimated by comparing rates of disease in vaccinated
individuals to rates in unvaccinated individuals. Below we outline the latest real-world
evidence on vaccine effectiveness from studies in UK populations. The majority of this
data relates to a period when the main circulating virus was the Alpha variant, emerging
data on effectiveness against symptomatic disease with the Delta variant is also
summarised below. The findings are also summarised in Tables 1 to 3.
Effectiveness against symptomatic disease
Vaccine effectiveness against symptomatic COVID-19 has been assessed in England
based on community testing data linked to vaccination data from the NIMS and from the
COVID Infection Survey. Current evidence is primarily from older adults, who were
among the earliest group vaccinated. Estimates of vaccine effectiveness range from
around 55 to 70% after 1 dose, with little evidence of variation by vaccine or age group
(3, 4, 5). Data on 2 doses is indicates effectiveness of around 65 to 90% (3, 6).
Offer of the Pfizer and Moderna mRNA vaccines to adults aged under 40 years began
on 10 May 2021. Early estimates of effectiveness of a single dose of either vaccine
indicate a vaccine effectiveness of around 60% after 1 dose of the Pfizer vaccine and
around 70% (95% CI: 46 to 86%) after 1 dose of the Moderna vaccine (week 26 Vaccine
Surveillance Report).
Data suggest that in most clinical risk groups, immune response to vaccination is
maintained and high levels of VE are seen with both the Pfizer and AstraZeneca
vaccines. Reduced antibody response and vaccine effectiveness were seen after 1 dose
of vaccine among the immunosuppressed group, however, after a second dose the
reduction in vaccine effectiveness is smaller (7).
5COVID-19 vaccine surveillance report – week 36
Analyses by dosing interval suggest that immune response to vaccination and vaccine
effectiveness against symptomatic disease improves with a longer (greater than 6 week
interval) compared to a shorter interval of 3 to 4 weeks (8).
Effectiveness against hospitalisation
Several studies have estimated the effectiveness against hospitalisation in older adults,
all of which indicate higher levels of protection against hospitalisation after a single dose
than that seen against symptomatic disease, around 75 to 85% after 1 dose of the
Pfizer-BioNTech or Oxford-AstraZeneca vaccine (3, 9, 10, 11). Data on VE against
hospitalisation with 2 doses for all ages with the Alpha variant is shown in the week 26
Vaccine Surveillance Report.
Effectiveness against mortality
Data is also emerging which suggests high levels of protection against mortality. Studies
linking community COVID-19 testing data, vaccination data and mortality data indicate
that both the Pfizer-BioNTech and Oxford-AstraZeneca vaccines are around 70 to 85%
effective at preventing death with COVID-19 after a single dose (3, 12). Vaccine
effectiveness against mortality with 2 doses of the Pfizer vaccine is around 95 to 99%
and with 2 doses of the AstraZeneca vaccine around 75 to 99% (week 26 Vaccine
Surveillance Report).
Effectiveness against infection
Although individuals may not develop symptoms of COVID-19 after vaccination, it is
possible that they could still be infected with the virus and could transmit to others.
Understanding how effective vaccines are at preventing infection is therefore important
to predict the likely impact of the vaccination programme on the wider population. In
order to estimate vaccine effectiveness against infection, repeat asymptomatic testing of
a defined cohort of individuals is required. Studies have now reported on vaccine
effectiveness against infection in healthcare workers, care home residents and the
general population. With the Pfizer-BioNTech, estimates of effectiveness against
infection range from around 55 to 70%, with the Oxford-AstraZeneca vaccine they range
from around 60 to 70% (5, 13, 14, 15). With 2 of 2 doses of either vaccine effectiveness
against infection is estimated at around 65 to 90% (5, 13).
6COVID-19 vaccine surveillance report – week 36
Effectiveness against transmission
As described above, several studies have provided evidence that vaccines are effective
at preventing infection. Uninfected individuals cannot transmit; therefore, the vaccines
are also effective at preventing transmission. Data from Scotland has also shown that
household contacts of vaccinated healthcare workers are at reduced risk of becoming a
case, which is in line with the studies on infection (16). There may be additional benefit,
beyond that due to prevention of infection, if some of those individuals who become
infected despite vaccination are also at a reduced risk of transmitting (for example,
because of reduced duration or level of viral shedding). A household transmission study
in England found that household contacts of cases vaccinated with a single dose had
approximately 35 to 50% reduced risk of becoming a confirmed case of COVID-19. This
study used routine testing data so would only include household contacts that developed
symptoms and went on to request a test via pillar 2. It cannot exclude asymptomatic
secondary cases or mildly symptomatic cases who chose not to request a COVID-19
test (17).
Table 1. Summary of evidence on vaccine effectiveness against different outcomes
(data relate to period when the Alpha variant dominated)
Vaccine effectiveness
Outcome Pfizer-BioNTech Oxford-AstraZeneca
1 dose 2 doses 1 dose 2 doses
Symptomatic disease 55 to 70% 85 to 95% 55 to 70% 70 to 85%
Hospitalisation 75 to 85% 90 to 99% 75 to 85% 80 to 99%
Mortality 70 to 85% 95 to 99% 75 to 85% 75 to 99%
Infection 55 to 70% 70 to 90% 55 to 70% 65 to 90%
Transmission 45 to 50% No data 35 to 50% No data
(secondary cases)*
High Evidence from multiple studies which is consistent
Confidence and comprehensive
Medium Evidence is emerging from a limited number of
Confidence studies or with a moderately level of uncertainty
Low Little evidence is available at present and results are
Confidence inconclusive
* effectiveness in reducing symptomatic secondary cases in households of a
symptomatic index case
7COVID-19 vaccine surveillance report – week 36
Vaccine effectiveness against the Delta variant
Analysis of routine testing data up to 13 June 2021, linked to sequencing and S-gene
target status has been used to estimate vaccine effectiveness against symptomatic
disease using a test negative case control design. Methods and detailed results are
available in Effectiveness of COVID-19 vaccines against the B.1.617.2 (Delta) variant
(18). After a single dose there was an 14% absolute reduction in vaccine effectiveness
against symptomatic disease with Delta compared to Alpha, and a smaller 10%
reduction in effectiveness after 2 doses (Table 2).
Table 2. Vaccine effectiveness against symptomatic disease for Alpha and Delta variants
Vaccine Status Vaccine Effectiveness
Alpha Delta
Dose 1 49 (46 to 52) 35 (32 to 38)
Dose 2 89 (87 to 90) 79 (78 to 80)
Vaccine effectiveness against hospitalisation was estimated by evaluating
hospitalisation rates via emergency care among symptomatic confirmed cases using
survival analysis. This analysis used available data from linkage of symptomatic cases,
12 April to the 10 June 2021 (updated from the previous analysis to 4 June 2021).
Hazard ratios for hospitalisation are combined with odds ratios against symptomatic
disease from the test negative case control analysis described above to estimate
vaccine effectiveness against hospitalisation. Methods and detailed results are available
here (19). Similar vaccine effectiveness against hospitalisation was seen with the Alpha
and Delta variants (Table 3).
Table 3. Vaccine effectiveness against hospitalisation for Alpha and Delta variants
Vaccine Status Vaccine Effectiveness
Alpha Delta
Dose 1 78 (64 to 87) 80 (69 to 88)
Dose 2 93 (80 to 97) 96 (91 to 98)
8COVID-19 vaccine surveillance report – week 36
Population impact
Vaccines typically have both direct effects on those who are vaccinated and indirect
effects on the wider population due to a reduced probability that people will come
into contact with an infected individual. The overall impact of the vaccination programme
may therefore extend beyond that estimated through vaccine effectiveness analysis.
Estimating the impact of a vaccination programme is challenging as there is no
completely unaffected control group. Furthermore, the effects of the vaccination
programme need to be differentiated from that of other interventions (for example,
lockdowns or outbreak control measures), changes in behaviour and any seasonal
variation in COVID-19 activity.
PHE and other government and academic partners monitor the impact of the of the
vaccination programme on levels of COVID-19 antibodies in the population and different
disease indicators, including hospitalisations and mortality. This is done through
population-based testing and through modelling which combines vaccine coverage rates
in different populations, estimates of vaccine effectiveness and disease surveillance
indicators.
Vaccine coverage
The data in this week’s report covers the period from 8 December 2020 to 5 September
2021 (week 35) (Figure 1). It shows the provisional number and percentage of people in
England who have had received 1 dose or 2 doses of a COVID-19 vaccination by age
group and week since the start of the programme.
Up to 31 July 2021 62,311 women of child-bearing age in England (under 50) who
reported that they were pregnant or could be pregnant at the time, received at least 1
dose of COVID-19 vaccination and of these, 43,737 have received their second dose.
This is in response to the self-reported pre-screening question “Are you or could you be
pregnant?”. The true number of pregnant women who have had a COVID-19 vaccination
is likely to be greater than this.
Please note that pregnant women are not a separate priority group as defined by JCVI
who have advised that “women who are pregnant should be offered vaccination at the
same time as non-pregnant women, based on their age and clinical risk group” therefore
comparing vaccine uptake in pregnant women to other vaccination programmes is not
currently appropriate. The MHRA closely monitors the safety of COVID-19 vaccine
exposures in pregnancy, including Yellow Card reports for COVID-19 vaccines used in
pregnancy, for the latest information please see the webpage Coronavirus vaccine –
weekly summary of Yellow Card reporting.
9COVID-19 vaccine surveillance report – week 36
Figure 1. Cumulative weekly vaccine uptake by age
a) Dose 1
Over 80 75 to under 80 70 to under 75 65 to under 70 60 to under 65 55 to under 60 50 to under 55 45 to under 50
40 to under 45 35 to under 40 30 to under 35 25 to under 30 18 to under 25 16 to under 18 Under 16
100.0
90.0
80.0
70.0
60.0
% vaccine uptake
50.0
40.0
30.0
20.0
10.0
0.0
50 51 52 53 1 2 3 4 5 6 7 8 9 10 11 12 13 14 15 16 17 18 19 20 21 22 23 24 25 26 27 28 29 30 31 32 33 34 35
Week number
10COVID-19 vaccine surveillance report – week 36
b) Dose 2
Over 80 75 to under 80 70 to under 75 65 to under 70 60 to under 65 55 to under 60 50 to under 55 45 to under 50
40 to under 45 35 to under 40 30 to under 35 25 to under 30 18 to under 25 16 to under 18 Under 16
100.0
90.0
80.0
70.0
60.0
% vaccine uptake
50.0
40.0
30.0
20.0
10.0
0.0
50 51 52 53 1 2 3 4 5 6 7 8 9 10 11 12 13 14 15 16 17 18 19 20 21 22 23 24 25 26 27 28 29 30 31 32 33 34 35
Week number
11COVID-19 vaccine surveillance report – week 36
Vaccination status
Vaccination status of COVID-19 cases, deaths and hospitalisations by week of
specimen date over the past 4 weeks up to week 35 (up to 5 September 2021) are
shown in Table 4 to 6 and Figure 2.
Methods
COVID-19 cases and deaths identified through routine collection from the Second
Generation Surveillance System (SGSS) and from PHE EpiCell's deaths data as
described here, were linked to the National Immunisation Management System (NIMS)
to derive vaccination status, using an individual’s NHS number as the unique identifier.
Attendance to emergency care at NHS trusts was derived from the Emergency Care
DataSet (ECDS) managed by NHS Digital. The same data source was used to identify
COVID-19 cases where the attendance to emergency care resulted in admission to an
NHS trust.
ECDS is updated weekly, and cases are linked to these data twice weekly. Data from
ECDS are subject to reporting delays as, although NHS trusts may update data daily,
the mandatory deadline for submission is by the 21st of every month. This means that
for weeks immediately following the 21st of a month, numbers may be artificially low and
are likely to be higher in later versions of the report.
Data from ECDS also only report on cases who have been presented to emergency care
and had a related overnight patient admission and do not show those who are currently
in hospital with COVID-19. As such, it is not appropriate for use for surveillance of those
currently hospitalised with COVID-19. In addition, these data will not show cases who
were directly admitted as inpatients without presenting to emergency care.
The outcome of overnight inpatient admission following presentation to emergency care,
was limited to those occurring within 28 days of the earliest specimen date for a COVID-
19 case.
Deaths include those who died (a) within 28 days of the earliest specimen date or (b)
within 60 days of the first specimen date or more than 60 days after the first specimen
date with COVID-19 mentioned on the death certificate.
The rate of COVID-19 cases, hospitalisation, and deaths in fully vaccinated and
unvaccinated groups was calculated using vaccine coverage data for each age group
extracted from the National Immunisation Management Service.
12COVID-19 vaccine surveillance report – week 36
Results
The rate of death within 28 days or within 60 days of a positive COVID-19 test increases
with age, and is substantially greater in unvaccinated individuals compared to fully
vaccinated individuals.
The rate of hospitalisation within 28 days of a positive COVID-19 test also increases with
age, and again is substantially greater in unvaccinated individuals compared to
vaccinated individuals.
The rate of a positive COVID-19 test varies by age and vaccination status. The rate of a
positive COVID-19 test is substantially lower in vaccinated individuals compared to
unvaccinated individuals up to the age of 39, and in those aged greater than 80. In
individuals aged 40 to 79, the rate of a positive COVID-19 test is higher in vaccinated
individuals compared to unvaccinated. This is likely to be due to a variety of reasons,
including differences in the population of vaccinated and unvaccinated people as well as
differences in testing patterns
Interpretation of the data
These data should be considered in the context of vaccination status of the population
groups shown in the rest of this report. The vaccination status of cases, inpatients and
deaths is not the most appropriate method to assess vaccine effectiveness and there is
a high risk of misinterpretation. Vaccine effectiveness has been formally estimated from
a number of different sources and is described earlier in this report.
In the context of very high vaccine coverage in the population, even with a highly
effective vaccine, it is expected that a large proportion of cases, hospitalisations and
deaths would occur in vaccinated individuals, simply because a larger proportion of the
population are vaccinated than unvaccinated and no vaccine is 100% effective. This is
especially true because vaccination has been prioritised in individuals who are more
susceptible or more at risk of severe disease. Individuals in risk groups may also be
more at risk of hospitalisation or death due to non-COVID-19 causes, and thus may be
hospitalised or die with COVID-19 rather than because of COVID-19.
13COVID-19 vaccine surveillance report – week 36
Table 4. COVID-19 cases by vaccination status between week 32 and week 35 2021
Received Received
Second Rates among
Cases reported by one dose one dose, Rates among
dose ≥14 persons
week of specimen Not (1-20 days ≥21 days persons not
Total Unlinked* days before vaccinated
date between week vaccinated before before vaccinated
specimen with 2 doses
32 and week 35 2021 specimen specimen (per 100,000)
date (per 100,000)
date) date
Under 18 167,832 15,901 141,676 8,132 1,366 757 476.0 1,192.9
18-29 176,392 19,529 53,187 4,598 66,545 32,533 711.1 1,520.8
30-39 113,373 12,452 33,986 1,497 22,434 43,004 782.2 1,143.9
40-49 97,881 8,930 15,106 496 6,000 67,349 1,116.2 880.4
50-59 84,488 6,868 7,552 168 2,248 67,652 962.0 729.7
60-69 45,252 3,657 2,650 54 772 38,119 672.3 487.5
70-79 25,499 2,034 910 12 273 22,270 480.5 367.5
80+ 12,011 1,124 545 9 246 10,087 391.1 427.4
*individuals whose NHS numbers were unavailable to link to the NIMS
14COVID-19 vaccine surveillance report – week 36
Table 5. COVID-19 deaths (a) within 28 days and (b) within 60 days of positive specimen or with COVID-19 reported
on death certificate, by vaccination status between week 32 and week 35 2021
(a)
Death within 28 days of Received Received Second
one dose Rates among
first positive COVID-19 one dose, dose ≥14 Rates among
persons
Total Unlinked*
Not (1-20 days ≥21 days days
vaccinated
persons not
test by date of death vaccinated before before vaccinated
before with 2 doses
between week 32 and specimen specimen specimen (per 100,000)
(per 100,000)
week 35 2021 date) date date
Under 18 3 0 3 0 0 0 0.0 0.0
18-29 18 1 13 0 1 3 0.1 0.4
30-39 45 2 31 0 4 8 0.1 1.0
40-49 93 3 54 0 9 27 0.4 3.1
50-59 191 3 100 0 17 71 1.0 9.7
60-69 332 7 115 2 14 194 3.4 21.2
70-79 580 2 129 1 20 428 9.2 52.1
80+ 1,119 7 155 3 26 928 36.0 121.5
15COVID-19 vaccine surveillance report – week 36
(b)
Death within 60 days of Received Received
Second Rates among
first positive COVID-19 test one dose one dose, Rates among
dose ≥14 persons
or where COVID-19 is Not (1-20 days ≥21 days persons not
Total Unlinked* days before vaccinated
mentioned on the death vaccinated before before vaccinated
specimen with 2 doses
certificate by week of date specimen specimen (per 100,000)
date (per 100,000)
of death between week 32 date) date
and week 35 2021
Under 18 3 0 3 0 0 0 0.0 0.0
18-29 24 1 15 1 3 4 0.1 0.4
30-39 58 2 39 0 5 12 0.2 1.3
40-49 119 3 67 0 14 35 0.6 3.9
50-59 234 3 122 0 19 90 1.3 11.8
60-69 401 8 146 2 18 227 4.0 26.9
70-79 653 3 141 1 22 486 10.5 56.9
80+ 1,266 7 165 3 39 1,052 40.8 129.4
*individuals whose NHS numbers were unavailable to link to the NIMS
16COVID-19 vaccine surveillance report – week 36
Table 6. COVID-19 cases whom presented to emergency care (within 28 days of a positive specimen) resulting in an
overnight inpatient admission by vaccination status between week 32 and week 35 2021
Cases whom presented to Received Received Second
Rates among
emergency care (within one dose one dose, dose ≥14 Rates among
persons
28 days of a positive Not (1-20 days ≥21 days days persons not
Total Unlinked* vaccinated
specimen), resulting in vaccinated before before before vaccinated
with 2 doses
overnight inpatient specimen specimen specimen (per 100,000)
(per 100,000)
admission, by week of date) date date
specimen date between
week 32 and week 35
2021
Under 18 438 25 404 8 1 0 0.0 3.4
18-29 584 14 387 17 86 80 1.7 11.1
30-39 733 16 516 16 67 118 2.1 17.4
40-49 783 14 497 17 35 220 3.6 29.0
50-59 877 10 421 11 29 406 5.8 40.7
60-69 946 7 328 7 33 571 10.1 60.3
70-79 1,098 3 194 2 26 873 18.8 78.3
80+ 1,146 1 144 1 35 965 37.4 112.9
*individuals whose NHS numbers were unavailable to link to the NIMS
17COVID-19 vaccine surveillance report – week 36
Figure 2. Rates (per 100,000) by vaccination status from week 32 to week 35 2021
(a) COVID-19 cases
1,600.0
1,400.0
1,200.0
Rate per 100,000
1,000.0
800.0
600.0
400.0
200.0
0.0
Under 18 18-29 30-39 40-49 50-59 60-69 70-79 80+
Age group
Vaccinated with at least 2 doses Unvaccinated
(b) Death within 28 days of first positive COVID-19 test
140.0
120.0
100.0
Rate per 100,000
80.0
60.0
40.0
20.0
0.0
Under 18 18-29 30-39 40-49 50-59 60-69 70-79 80+
Age group
Vaccinated with at least 2 doses Unvaccinated
18COVID-19 vaccine surveillance report – week 36
(c) Death within 60 days of first positive COVID-19 test or where COVID-19 is mentioned
on the death certificate
140.0
120.0
100.0
Rate per 100,000
80.0
60.0
40.0
20.0
0.0
Under 18 18-29 30-39 40-49 50-59 60-69 70-79 80+
Age group
Vaccinated with at least 2 doses Unvaccinated
(d) COVID-19 cases whom presented to emergency care (within 28 days of a positive
specimen) resulting in an overnight inpatient admission
120.0
100.0
80.0
60.0
40.0
20.0
0.0
Under 18 18-29 30-39 40-49 50-59 60-69 70-79 80+
Vaccinated with at least 2 doses Unvaccinated
19COVID-19 vaccine surveillance report – week 36
Vaccine impact on proportion of population with
antibodies to COVID-19
PHE monitors the proportion of the population with antibodies to COVID-19 by testing
samples provided by healthy adult blood donors aged 17 years and older, supplied by
the NHS Blood and Transplant (NHS BT collection). This is important in helping to
understand the extent of spread of COVID-19 infection (including asymptomatic
infection) in the population and the impact of the vaccine programme. 250 samples from
every geographic region in England are tested each week using 2 different laboratory
tests, the Roche nucleoprotein (N) and Roche spike (S) antibody assays. This dual
testing helps to distinguish between antibodies that are produced following natural
COVID-19 infection and those that develop after vaccination. Nucleoprotein (Roche N)
assays only detect post-infection antibodies, whereas spike (Roche S) assays will detect
both post-infection antibodies and vaccine-induced antibodies. Thus, changes in the
proportion of samples testing positive on the Roche N assay will reflect the effect of
natural infection and spread of COVID-19 in the population. Increases in the proportion
positive as measured by S antibody will reflect both infection and vaccination. Antibody
responses reflect infection or vaccination occurring at least 2 to 3 weeks previously
given the time taken to generate an antibody response.
In this report, we present the results using a 4-weekly average, of testing samples up to
27 August 2021, which takes account of the age and geographical distribution of the
English population. Overall, the proportion of the population with antibodies using the
Roche N and Roche S assays respectively were 18.1% and 97.7% for the period 2
August to 27 August (weeks 31 to 34) (Figure 3). This compares with 18.2% Roche N
seropositivity and 97.0% Roche S seropositivity for the period of 5 July to 30 July (weeks
27 to 30).
The continuing increase in seropositivity using the Roche S assay reflects the growing
proportion of adults who have developed antibodies following vaccination.
Figure 4a and 4b show the proportion of the population with antibodies by age group.
Recent increases in N seropositivity has been observed in some age groups. Roche N
seropositivity in individuals aged 17 to 29 years remained stable at 27.5% in weeks 27 to
30 and at 27.6% in weeks 31 to 34. Small increases were observed in the 30 to 39 year
olds from 18.9% in weeks 27 to 30 to 20.6% in weeks 31 to 34 and in the 50 to 59 years
olds from 16.5% in weeks 27 to 30 to 18.9% in weeks 31 to 34. A small decrease was
observed in 40 to 49 year olds from 19.6% in weeks 27 to 30 to 18.6% in weeks 31 to
34. Roche N seropositivity decreased in 60 to 69 year olds from 13.0% in weeks 27 to
30 to 10.3% in weeks 31 to 34. Similarly, a decrease was observed in the 70 to 84 year
olds from 9.0% in weeks 27 to 30 to 6.7% in weeks 31 to 34.
20COVID-19 vaccine surveillance report – week 36
The pattern of increases in Roche S seropositivity which are observed follow the roll out
of the vaccination programme with the oldest age groups offered vaccine first. (Figure
4b). Roche S seropositivity increased first in donors aged 70 to 84 and has plateaued
since week 13, reaching 99.5% in weeks 31 to 34. Seropositivity has also plateaued
since week 16 for those aged 60 to 69 reaching 99.4% in weeks 31 to 34. Plateauing in
Roche S seropositivity has been observed since week 19 in those aged 50 to 59
reaching 98.9% in weeks 31 to 34 2021. A plateauing in seropositivity has recently been
observed in the 40 to 49-year olds since week 23 reaching 97.5% in weeks 31 to 34.
Plateauing is now being observed in the 30 to 39-year olds, reaching 95.8% in weeks 31
to 34. Increases in seropositivity are still being observed in those aged 17 to 29,
increasing from 93.5% in weeks 27 to 30 2021 to 96.3% in weeks 31 to 34 2021.
The impact of the vaccination programme is clearly evident from the increases in the
proportion of the adult population with antibodies based on Roche S testing. This is
evident initially amongst individuals aged 50 years and above who were prioritised for
vaccination as part of the phase 1 programme and since week 15 in younger adults and
below as part of phase 2 of the vaccination programme.
21COVID-19 vaccine surveillance report – week 36
Figure 3. Overall population weighted 4-weekly rolling SARS-CoV-2 antibody seroprevalence (% seropositive) in blood
donors from the Roche S and Roche N assays.
22COVID-19 vaccine surveillance report – week 36
Figure 4. Population weighted 4-weekly rolling SARS-CoV-2 antibody seroprevalence (% seropositive) in blood donors
from the Roche S and Roche N assays by a) age groups 17 to 29, 30 to 39 and 40 to 49, b) age group 50 to 59, 60 to 69
and 70 to 84.
a)
23COVID-19 vaccine surveillance report – week 36
b)
100
95
90
85
80
75
70
65
% seropositive
60
55
50
45
40
35
30
25
20
15
10
5
0
35 37 39 41 43 45 47 49 51 53 2 4 6 8 10 12 14 16 18 20 22 24 26 28 30 32 34
week (4-week period mid point)
50-59 N 60-69 N 70-84 N
50-59 S 60-69 S 70-84 S
24COVID-19 vaccine surveillance report – week 36
Direct impact on hospitalisations
The number of hospitalisations averted by vaccination, can be estimated by considering
vaccine effectiveness against hospitalisation, vaccine coverage and observed
hospitalisations and through modelling using a range of parameters.
For the week 35 report the vaccine effectiveness estimates used in the model were
updated to use more recent vaccine effective estimates. The vaccine effectiveness
estimates used in previous reports were slightly lower than the current estimates,
therefore an increase in the number of hospitalisations averted was seen in the week 35
report compared to previous reports.
PHE estimates to 22 August 2021 based on the direct effect of vaccination and vaccine
coverage rates, are that around 143,600 hospitalisations have been prevented in those
aged 65 years and over in England (approximately 36,100 admissions in those aged 65
to 74, 58,800 in those aged 75 to 84, and 48,700 in those aged 85 and over) as a result
of the vaccination programme (Figure 5). There is increasing evidence that vaccines
prevent infection and transmission. The indirect effects of the vaccination programme
will not be incorporated in this analysis, therefore the figure of 143,600 hospitalisations
averted is likely to be an underestimate.
Please note this analysis will be updated every 2 weeks. The next update will be in the
week 37 report.
25COVID-19 vaccine surveillance report – week 36
Figure 5. Plot of daily observed and expected COVID-19 hospitalisations in adults aged 65 and over
3500 100%
Percentage vaccine coverage (cumulative)
90%
3000
80%
2500 70%
Number of hospitalisations
60%
2000
50%
1500
40%
1000 30%
20%
500
10%
0 0%
Date
Observed Expected
D1 Coverage 85+ (25 days earlier) D2 Coverage 85+ (11 days earlier)
D1 Coverage 75-84 (25 days earlier) D2 Coverage 75-84 (11 days earlier)
D1 Coverage 65-74 (25 days earlier) D2 Coverage 65-74 (11 days earlier)
26COVID-19 vaccine surveillance report – week 36
Direct and indirect impact on infection and mortality
The PHE and Cambridge real-time model has been used to track the COVID-19
infection throughout the pandemic, providing key epidemic insights, including estimation
of the reproduction number, R, to the Scientific Pandemic Influenza subgroup on
Modelling (SPI-M) and to the Scientific Advisory Group on Emergencies (SAGE). The
application to data from the first wave has been published in Real-time nowcasting and
forecasting of COVID-19 dynamics in England: the first wave (20). Since the first wave,
the model has been constantly improved to capture the pandemic activity as it develops,
in particular to account for the impacts, both direct and indirect, of the vaccination
programme. The direct impact of vaccination is the number of deaths saved in those that
get infected, whereas the indirect effect incorporates the additional prevention of
infections. The history of real-time modelling outputs can be found at Nowcasting and
Forecasting of the COVID-19 Pandemic (21), with the most recent results on which the
figures here are based is currently available at COVID-19: nowcast and forecast (22).
Vaccination rates in the model are based on the actual number of doses administered,
and the vaccine is assumed to reduce susceptibility to COVID-19 as well as mortality
once infected. Estimates for vaccine efficacy are based on the best available published
results (23). The model is fitted to both ONS prevalence and daily COVID-19 mortality
data in England, resulting in posterior samples for a range of epidemiological
parameters. To infer the impact of vaccination, the posterior samples are used to
simulate the number of infections and deaths that would have occurred without
vaccination (Figure 6). The total impact is then calculated by comparing the infection and
mortality estimates with vaccination versus the simulated outcomes without vaccination
(Figure 7; Table 7).
The no-vaccination scenario assumes that no other interventions are implemented to
reduce incidence and mortality. Therefore, the findings presented here should be
interpreted as the impact of the vaccination programme on infection and mortality
assuming no additional non-pharmaceutical interventions were implemented. In practice,
it is impossible to predict what interventions would have been implemented in the
absence of vaccination, although it is reasonable to assume that lockdown measures
would have remained in place for substantially longer and that new lockdown measures
would have been put into place to reduce the pandemic's impact. Similarly, it is likely
that people's behaviour would have changed in response to the rising cases and deaths.
Consequently, over time the state of the actual pandemic and the no-vaccination
pandemic will become increasingly less comparable. For example, recent results from
the no-vaccination scenario show that the pandemic in the absence of vaccination and
additional interventions would have peaked due to natural immunity. Therefore,
reinfections will become more important, but data on the risk and severity of reinfections
is still lacking. Similarly, the arrival and spread of new strains will be different in the 2
scenarios, making it harder to predict what would have happened in the no-vaccination
27COVID-19 vaccine surveillance report – week 36
scenario. This means that the comparison shown here becomes less meaningful as time
goes on.
In conclusion, this means that the no-vaccination scenario captures what would have
happened in the absence of additional interventions to mitigate the pandemic, public
behaviour had stayed the same, and the timing of the introduction of new viral strains
(that is, the delta variant) had not changed. Results should be interpreted accordingly.
The work presented in this section is joint work completed by PHE and Cambridge
University’s MRC Biostatistics Unit.
Estimates suggest that 112,300 deaths and 24,702,000 infections have been prevented
as a result of the COVID-19 vaccination programme, up to 27 August. Please note this
analysis has not been updated since last week’s report.
Table 7. Inferred reduction in infections and mortality as the result of vaccination
up to 27 August 2021. (Infections are rounded to the nearest 1,000, deaths to the
nearest 100).
Model Outcome Reduction
ONS/Death Infection 24,702,000 [ 24,465,000 to 24,966,000]
ONS/Death Mortality 112,300 [ 108,600 to 116,200]
28COVID-19 vaccine surveillance report – week 36
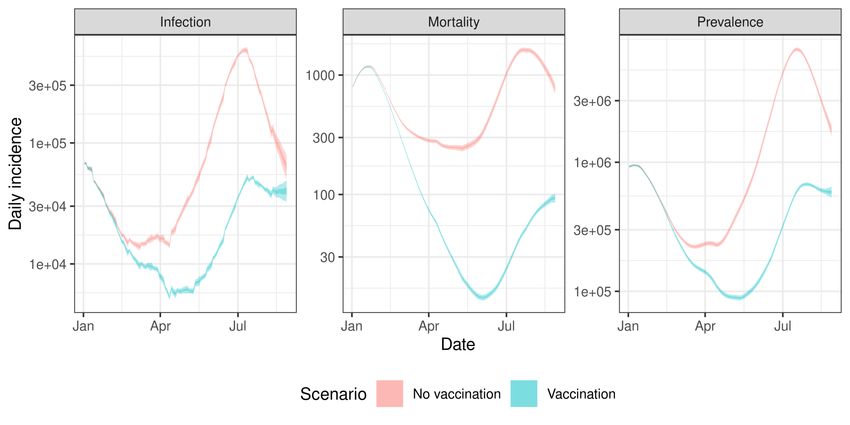
Figure 6. Inferred and predicted incidence, mortality and prevalence with and without vaccination in England. This is presented
on a log scale
29COVID-19 vaccine surveillance report – week 36
Figure 7. Averted number of infections (left) and deaths (right) due to vaccination (cumulatively)
30COVID-19 vaccine surveillance report – week 36
References
1. Public Health England. ‘COVID-19: vaccine surveillance strategy 2021’
2. Medicines and Healthcare Products Regulatory Agency. ‘Coronavirus vaccine – weekly
summary of Yellow Card reporting 2021’
3. Lopez Bernal J, Andrews N, Gower C, Robertson C, Stowe J, Tessier E and others.
‘Effectiveness of the Pfizer-BioNTech and Oxford-AstraZeneca vaccines on COVID-19-
related symptoms, hospital admissions, and mortality in older adults in England: test
negative case-control study.’ British Medical Journal 2021: volume 373, n1,088
4. Public Health England. ‘Public Health England vaccine effectiveness report – March 2021.
Public Health England 2021
5. Pritchard E, Matthews PC, Stoesser N, Eyre DW, Gethings O, Vihta K-D and others.
‘Impact of vaccination on SARS-CoV-2 cases in the community: a population-based study
using the UK’s COVID-19 Infection Survey.’ medRxiv 2021: 2021.04.22.21255913
6. Public Health England. ‘Public Health England COVID-19 vaccine surveillance report: 20
May 2021 (week 20)’ Public Health England 2021
7. Whitaker H, Tsang R, Byford R, Andrews N, Sherlock J, Sebastian Pillai P and others.
‘Pfizer-BioNTech and Oxford AstraZeneca COVID-19 vaccine effectiveness and immune
response among individuals in clinical risk groups’
8. Amirthalingham G, Lopez Bernal J, Andrews N, Whitaker H, Gower C, Stowe J and others.
‘Higher serological responses and increased vaccine effectiveness demonstrate the value
of extended vaccine schedules in combatting COVID-19 in England.’ medRxiv. 2021
9. Vasileiou E, Simpson CR, Robertson C, Shi T, Kerr S, Agrawal U and others.
‘Effectiveness of first dose of COVID-19 vaccines against hospital admissions in Scotland:
national prospective cohort study of 5.4 million people.’ 2021
10. Hyams C, Marlow R, Maseko Z, King J, Ward L, Fox K and others. ‘Effectiveness of
BNT162b2 and ChAdOx1 nCoV-19 COVID-19 vaccination at preventing hospitalisations in
people aged at least 80 years: a test-negative, case-control study.’ Lancet Infectious
Diseases 2021
11. Ismail SA, Vilaplana TG, Elgohari S, Stowe J, Tessier E, Andrews N and others.
‘Effectiveness of BNT162b2 mRNA and ChAdOx1 adenovirus vector COVID-19 vaccines
on risk of hospitalisation among older adults in England: an observational study using
surveillance data.’ PHE Preprints. 2021
12. Lopez Bernal J, Andrews N, Gower C, Stowe J, Tessier E, Simmons R and others.
‘Effectiveness of BNT162b2 mRNA vaccine and ChAdOx1 adenovirus vector vaccine on
mortality following COVID-19.’ PHE Preprints 2021
13. Hall VJ, Foulkes S, Saei A, Andrews N, Oguti B, Charlett A and others. ‘COVID-19 vaccine
coverage in health-care workers in England and effectiveness of BNT162b2 mRNA
vaccine against infection (SIREN): a prospective, multicentre, cohort study.’ Lancet 202
14. Shrotri M, Krutikov M, Palmer T, Giddings R, Azmi B, Subbarao S and others. ‘Vaccine
effectiveness of the first dose of ChAdOx1 nCoV-19 and BNT162b2 against SARS-CoV-2
infection in residents of long-term care facilities in England (VIVALDI): a prospective cohort
study.’ Lancet Infectious Diseases 2021
31COVID-19 vaccine surveillance report – week 36
15. Menni C, Klaser K, May A, Polidori L, Capdevila J, Louca P and others. ‘Vaccine side-
effects and SARS-CoV-2 infection after vaccination in users of the COVID Symptom Study
app in the UK: a prospective observational study.’ The Lancet Infectious Diseases 2021
16. V Shah AS, Gribben C, Bishop J, Hanlon P, Caldwell D, Wood R and others. ‘Effect of
vaccination on transmission of COVID-19: an observational study in healthcare workers
and their households.’ medRxiv 2021: 2021.03.11.21253275
17. Harris RJ, Hall JA, Zaidi A, Andrews NJ, Dunbar JK, Dabrera G. ‘Impact of vaccination on
household transmission of SARS-COV-2 in England.’ Public Health England 2021
18. Lopez Bernal J, Andrews N, Gower C, Gallagher E, Simmons R, Thelwall S and others.
‘Effectiveness of Covid-19 Vaccines against the B.1.617.2 (Delta) Variant’. New England
Journal of Medicine 2021
19. Stowe J, Andrews N, Gower C, Gallagher E, Utsi L, Simmons R and others. ‘Effectiveness
of COVID-19 vaccine against hospital admission with the Delta (B.1.617.2) variant.’ 2021
20. Birrell Paul, Blake Joshua, van Leeuwen Edwin, Gent Nick and De Angelis Daniela (2021).
‘Real-time nowcasting and forecasting of COVID-19 dynamics in England: the first wave’
Philosophical Transactions of the Royal Society B 376: 20200279
21. MRC Biostatistics Unit. ‘Nowcasting and Forecasting of the COVID-19 Pandemic’
22. Birrell, Paul, Joshua Blake, Edwin van Leeuwen, MRC Biostatistics Unit COVID-19
Working Group, Daniela De Angelis (2021). ‘COVID-19: nowcast and forecast’. Published
25 June 2021
23. Public Health England (2021). ‘COVID-19 vaccine surveillance report, Week 24’
32Website: www.gov.uk/phe
Twitter: @PHE_uk
Facebook: www.facebook.com/PublicHealthEngland
© Crown copyright 2021
Published: 9 September 2021
PHE gateway number: GOV-9692
33You can also read