Statistical analysis of fireballs: Seismic signature survey - Desert Fireball Network
←
→
Page content transcription
If your browser does not render page correctly, please read the page content below
Publications of the Astronomical Society of Australia (2021), 38, e016, 7 pages
        doi:10.1017/pasa.2021.11

        Research Paper

        Statistical analysis of fireballs: Seismic signature survey
        T. Neidhart1 , K. Miljković1, E. K. Sansom1, H. A. R. Devillepoix1, T. Kawamura2, J.-L. Dimech3, M. A. Wieczorek4
        and P. A. Bland1
        1
          School of Earth and Planetary Sciences, Space Science and Technology Centre, Curtin University, Perth, Australia, 2 Institut de Physique du Globe de Paris, Paris,
        France, 3 Geoscience Australia, Canberra, Australia and 4 Observatoire de Cote d’Azur, Laboratoire Lagrange, Nice, France

        Abstract
        Fireballs are infrequently recorded by seismic sensors on the ground. If recorded, they are usually reported as one-off events. This study
        is the first seismic bulk analysis of the largest single fireball data set, observed by the Desert Fireball Network (DFN) in Australia in the
        period 2014–2019. The DFN typically observes fireballs from cm-m scale impactors. We identified 25 fireballs in seismic time series data
        recorded by the Australian National Seismograph Network (ANSN). This corresponds to 1.8% of surveyed fireballs, at the kinetic energy
        range of 106 –1010 J. The peaks observed in the seismic time series data were consistent with calculated arrival times of the direct airwave
        or ground-coupled Rayleigh wave caused by shock waves by the fireball in the atmosphere (either due to fragmentation or the passage of
        the Mach cone). Our work suggests that identification of fireball events in the seismic time series data depends on both physical properties
        of a fireball (such as fireball energy and entry angle in the atmosphere) and the sensitivity of a seismic instrument. This work suggests that
        fireballs are likely detectable within 200 km direct air distance between a fireball and seismic station, for sensors used in the ANSN. If each
        DFN observatory had been accompanied by a seismic sensor of similar sensitivity, 50% of surveyed fireballs could have been detected. These
        statistics justify the future consideration of expanding the DFN camera network into the seismic domain.
        Keywords: fireball – impact – seismic – observation – sensitivity
        (Received 20 October 2020; revised 16 February 2021; accepted 23 February 2021)

        1. Introduction
        When a meteoroid enters the atmosphere, it experiences aero-
        dynamic drag and dynamic pressure. The atmosphere slows
        down meteoroids and in most cases they break-up and vaporise
        (Ceplecha & Revelle 2005). The break-up occurs when the
        dynamic pressure is higher than its compression strength
        (Cevolani 1994; Stevanović et al. 2017). Shock waves can be
        generated in the atmosphere by (Figure 1):

         • The hypersonic flight forming a Mach cone,
         • A discrete fragmentation event during the meteoroid’s trajec-
           tory,
         • A catastrophic final airburst,
         • Physical impact on the ground (extremely rare).

        The Mach angle within the Mach cone is expected to be negligibly
        small, because the impact speed is much larger than the speed
        of sound in the air. Therefore, the shock waves generated during
        a hypersonic fireball entry are expected to propagate almost                                Figure 1. Shock wave generation during a fireball event: (a) shock waves are gener-
        perpendicular to the trajectory (Figure 1a). The fragmentation of                           ated by the Mach cone that travel almost perpendicular to the trajectory of the object
        the meteoroid can also create shock waves that propagate with                               and rapidly decay from a non-linear to linear wavefront, (b) fragmentation-induced air-
                                                                                                    burst causes shock waves that travel omnidirectionally, (c) seismic waves originating
        no preferred direction; thus, it can be assumed they propagate                              from impact itself, (d) Rayleigh waves formed by coupling between airwaves and the
        omnidirectionally (Figure 1b). If the impactor or parts of the                              ground, and (e) an air disturbance directed at the seismic station (Brown et al. 2003;
                                                                                                    Revelle, Brown, & Spurný 2004). Figure redrawn from Edwards et al. (2008).
           Author for correspondence: T. Neidhart, E-mail: tanja.neidhart@postgrad.curtin.
        edu.au
           Cite this article: Neidhart T, Miljković K, Sansom EK, Devillepoix HAR, Kawamura T,
                                                                                                    impactor survive the atmospheric path and hit the ground
        Dimech J-L, Wieczorek MA and Bland PA. (2021) Statistical analysis of fireballs: Seismic    (Figure 1c), the seismic waves in the ground can be generated by
        signature survey. Publications of the Astronomical Society of Australia 38, e016, 1–7.      the impact itself (Edwards, Eaton, & Brown 2008; Tancredi et al.
        https://doi.org/10.1017/pasa.2021.11                                                        2009). The atmospheric shock waves can couple with the ground

        c The Author(s), 2021. Published by Cambridge University Press on behalf of the Astronomical Society of Australia.

Downloaded from https://www.cambridge.org/core. Curtin University Library, on 16 Apr 2021 at 03:02:20, subject to the Cambridge Core terms of use, available at
https://www.cambridge.org/core/terms. https://doi.org/10.1017/pasa.2021.11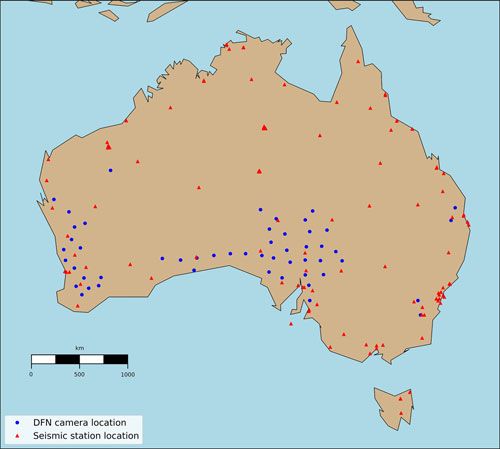
2                                                                                                                                                          T Neidhart et al.

       and form body and surface waves (Figure 1d) (Brown et al. 2003;
       Stevanović et al. 2017; Karakostas et al. 2018). The arrival times
       for different seismic waves differ as they travel at different speeds
       through different media (ground or air), which allows for their
       classification. Airwaves generated by the Mach cone (Figure 1e)
       will arrive last as they travel slowest (at the speed of sound),
       through the air directly between the fireball and the sensor on the
       ground (Edwards et al. 2008).
           For larger (bolide and cratering) events, a variety of seismic
       waves has been recorded. For example, the seismic signals caused
       by the 20-m diameter asteroid that exploded over Chelyabinsk,
       Russia in 2013 (estimated to have carried 1015 J at airburst
       (Emel’yanenko et al. 2013)) were identified as P and S body waves,
       ground-coupled airwaves, and Rayleigh waves (Tauzin et al. 2013);
       The P and S seismic waves were also seen when the 13.5-m diam-
       eter crater formed near Carancas, Peru in 2007 (Brown et al. 2008;
       Le Pichon et al. 2008; Tancredi et al. 2009); The Neuschwanstein
       large meteorite (estimated to have had 1012 J initial source energy)
       (Revelle et al. 2004; Oberst et al. 2004) caused seismic activity
       by direct airwaves and ground-coupled Rayleigh waves at seismic
       stations within a few hundred km distance (Revelle et al. 2004;
       Edwards et al. 2008). These impact examples were all significantly                          Figure 2. Locations of GA seismometers (red triangles) and DFN camera observatories
                                                                                                   (blue circles). Some stations are close together and therefore symbols overlap.
       larger than fireballs observed daily by the Desert Fireball Network
       (DFN) in Australia. Fireballs detected by the DFN have energies
       in the range of 103 –1012 J at atmospheric entry (Devillepoix et al.
       2019). Meteorite-dropping fireballs are at the upper energy range                           applied to all 1 410 DFN fireballs. The arrival times for the airwave
       observed by the DFN.                                                                        are then calculated for both the longest and the shortest direct
           DFN is the world’s largest fireball camera network, located in                          distances, using a speed of sound of 300 ± 60 ms−1 . We used this
       the Australian outback and consisting of 52 observatories, cov-                             error margin to account for local temperature and wind dependen-
       ering an area of 3 million km2 . It is aimed to detect fireballs,                           cies (Le Pichon et al. 2008). The large time window also considers
       recover meteorites, and calculate their orbits (Devillepoix et al.                          unknown coupling with the ground and the low signal strength.
       2019, 2018). The observatories are optimised to image objects hav-                             Seismic data were acquired from the ANSN, operated
       ing a brightness between 0 and −15 mag which corresponds to                                 by Geoscience Australia (GA), via public service domain
       sizes between 0.05 and 0.5 m (Devillepoix et al. 2019). In this work,                       Incorporated Research Institutions for Seismology (IRIS). The
       we make a bulk seismic analysis of the largest single data set of ter-                      ANSN consists of a network of broadband seismometers across
       restrial fireballs obtained by the DFN in the period from 2014 to                           Australia and its offshore territories. Figure 2 shows the locations
       2019, by systematically searching for seismic signals occurring in                          of broadband seismometers (red triangles) and the coverage of
       the time window and proximity of fireball trajectories.                                     DFN observatories (blue circles).
           Unlike other studies that used data from images (Beech et al.                              The criteria that determined if a signal in time series data can be
       1995; Brown et al. 1994; Spurný et al. 2012), seismic stations                              confidently classified as a signal coming from a fireball event are:
       (Brown et al. 2003; Devillepoix et al. 2020; Koten et al. 2019),                            1. The amplitude of the signal must be similar or lower than
       and infrasound (ElGabry et al. 2017) to calculate the orbits and                               previously confirmed seismic signals from fireballs or bolides,
       energies of meteors, this is the first study that uses information                             accounting for uncertainties related to the event’s distance to a
       about the trajectory and timing of fireballs from a large data                                 detector, yet above the background noise;
       set to back-trace any impact-related seismic activity. We investi-
                                                                                                   2. The seismic signal must be within the calculated arrival times
       gate detection threshold of the DFN-observed fireballs in seismic
                                                                                                      of the airwave (direct or ground-coupled Rayleigh wave; no P
       data recorded by the Australian National Seismograph Network
                                                                                                      and S waves were identified in this survey);
       (ANSN). We also report on the seismic properties of the fireballs
       caught by the seismic instruments. This information will be used                            3. There must not be an earthquake activity in the database
       for future instrument development in detecting fireballs in the                                (Geoscience Australia, 2019) at about the same time;
       seismic domain.                                                                             4. There must not be any clear anthropogenic-related noise (e.g.,
                                                                                                      mine blasts, proximity to airport runways, etc.). We note that
                                                                                                      DFN detects only night-time fireballs and at that time the
       2. Methodology                                                                                 anthropogenic noise is expected to be minimal.
       We used the DFN database containing trajectories of 1 410 fire-                                 The seismic time series data were obtained from the nearest
       ball events that occurred above Australia over the last 6 yr. The                           seismic stations and checked for distinguishable signals in the time
       DFN trajectory data provide absolute timing of fireball events, the                         window of the arrival of the airwave and Rayleigh wave (Criteria
       start and end coordinates as well as the height above ground of the                         2). Time series data were interrogated for a time window starting
       observed bright flight. A Python-based programme was written                                30 s prior to the start of a fireball event in the upper atmo-
       to calculate distances between the entire fireball trajectory (bright                       sphere and ending up to 28 min later. This is to account for the
       flight path) and all ANSN seismic stations. The programme was                               travel time of the airwave from the fireball to any seismic station

Downloaded from https://www.cambridge.org/core. Curtin University Library, on 16 Apr 2021 at 03:02:20, subject to the Cambridge Core terms of use, available at
https://www.cambridge.org/core/terms. https://doi.org/10.1017/pasa.2021.11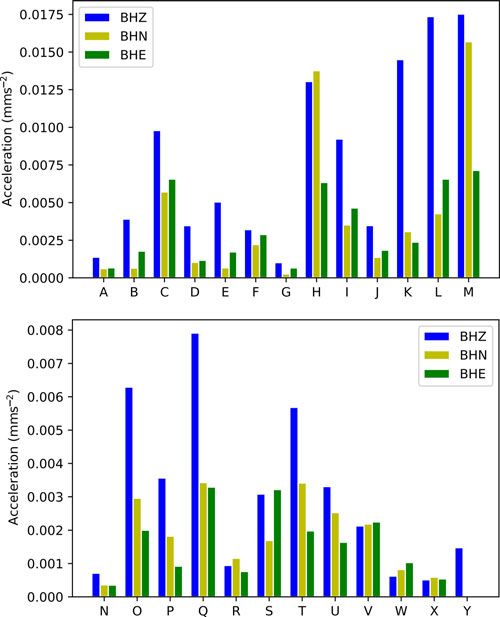
Publications of the Astronomical Society of Australia                                                                                                                                  3

        within 400 km. The seismic data were downloaded from the IRIS                               Table 1. Fireball events with suspected seismic signals. Time of fireball marks
        database. The Python framework ObsPy (Beyreuther et al. 2010;                               the start of the bright flight as observed by the DFN. Notation [A: Y] is to be used
        Krischer et al. 2015) was used to manipulate and analyse the time                           for easier cross-referencing between tables in this paper only
        series data and the Python library Astropy (Astropy Collaboration                           #                        DFN event ID                           Time of fireball start
        et al. 2013, 2018) was used for making coordinate transformations.
                                                                                                    A                        DN150622_01                            2015-06-22T10:55:08.126
        The time series data were filtered using a Butterworth-high-pass
                                                                                                    B                        DN150822_01                            2015-08-22T11:42:14.446
        filter at a default frequency of 2 Hz. For most signals, this filtering
        was the most satisfactory in cutting out ambient noise.                                     C                        DN150829_01                            2015-08-29T18:11:09.126
            In attempt to distinguish between meteor fragmentation and                              D                        DN160210_01                            2016-02-10T11:48:49.126
        the Mach cone passage, we used two approaches. We looked into                               E                        DN160328_01                            2016-03-28T12:19:02.286
        the fireball orientation with respect to the location of the seismic
                                                                                                    F                        DN160604_04                            2016-06-04T20:17:01.126
        station. If the shortest distance to the seismic station is perpendic-
        ular to the bright flight trajectory and arrival time for the airwaves                      G                        DN160610_01                            2016-06-10T16:19:22.726
        fits, signals are classified as likely originating from the Mach cone.                      H                        DN160802_03                            2016-08-02T13:24:51.926
        If the shortest distance is not perpendicular to the bright flight                          I                        DN160918_02                            2016-09-18T10:48:37.426
        trajectory, any seismic signals can be assumed to come from a                               J                        DN161007_01                            2016-10-07T19:01:01.026
        fragmentation along the trajectory. Considering that the fragmen-
                                                                                                    K                        DN170723_02                            2017-07-23T13:16:47.800
        tation has no preferred orientation, the events flagged as likely
        originated from the Mach cone could have instead originated from                            L                        DN171214_02                            2017-12-14T15:29:42.026
        the airburst caused by fragmentation. However, we class them as                             M                        DN180421_01                            2018-04-21T15:03:42.800
        Mach cone events because previous literature reported fragmen-                              N                        DN150909_02                            2015-09-09T12:08:31.126
        tation to cause lesser air disturbance compared to the Mach cone                            O                        DN160620_01                            2016-06-20T11:25:37.426
        passage (Brown et al. 2003; Edwards et al. 2008). We also visually
                                                                                                    P                        DN160830_02                            2016-08-30T09:35:20.926
        investigated DFN fireball images to identify the distinct presence
        of fragmentation. However, we were unable to unambiguously                                  Q                        DN160915_01                            2016-09-15T12:28:33.026
        make such a distinction for all fireball events. This is probably                           R                        DN161017_01                            2016-10-17T13:10:13.500
        due to camera sensor saturation and because of DFN cameras                                  S                        DN161106_03                            2016-11-06T15:32:32.586
        using the deBruin shutter sequence to mark absolute timing which                            T                        DN161115_03                            2016-11-15T17:46:23.605
        interrupts visual light curve recording (Table 3).
                                                                                                    U                        DN170226_03                            2017-02-26T11:16:01.026
                                                                                                    V                        DN170503_04                            2017-05-03T19:15:01.026
        3. Results                                                                                  W                        DN170607_01                            2017-06-07T15:01:38.300

        Compared to larger impact events, it was expected that the DFN-                             X                        DN171013_03                            2017-10-13T14:09:12.826
        observed fireballs could only cause occasional weak seismic sig-                            Y                        DN190407_01                            2019-04-07T13:20:32.150
        nals, predominantly coming from the atmospheric disturbance,
        and only in favourable positions and locations. Such an expecta-
        tion was set by previous works (Brown et al. 2003; Edwards et al.
        2008).
            Table 1 shows the fireball events with suspected seismic signals
        including the start time of the bright flight observation. Seismic
        signals were found for 25 fireball events (Tables 1–3) out of 1 410
        surveyed, setting the detectability at 1.8% when using the public
        seismic data. From here on, we will refer to specific events with
        their allocated ID letter, rather than DFN event code name, as
        introduced in Table 1.
            Figure 3 shows the location of all DFN observatories (blue
        circles) and seismic stations of the ANSN (red triangles) that
        identified these 25 events. It also shows the trajectories of the
        bright flight of the fireballs for which seismic signals are suspected
        (yellow lines).
            Table 2 shows the coordinates of the beginning (latb , longb ) and
        the end (late , longe ) of the bright flight, the beginning (hb ) and
        end (he ) height, the trajectory slope, and the velocity (V), inferred
        mass (m), and fireball energy (KE) at atmospheric entry. The slope
        is defined as the angle between the beginning of the bright flight
        trajectory and local horizontal. The recorded fireballs had almost                          Figure 3. Locations of seismic stations in Australia of the ANSN (red triangles) which
        the entire range of possible impact angles (from 4◦ to 78◦ ) with                           detected seismic signals from fireballs, DFN observatories that observed fireballs that
        a mean value (±1σ ) of 38◦ ± 19◦ . The mean hb was 86 ± 25 km                               showed seismic signals (blue circles), and trajectories of the bright flight of fireballs for
        and he was 46±18 km. The impact speed at the atmospheric entry                              which suspected seismic signals have been detected (yellow lines).

Downloaded from https://www.cambridge.org/core. Curtin University Library, on 16 Apr 2021 at 03:02:20, subject to the Cambridge Core terms of use, available at
https://www.cambridge.org/core/terms. https://doi.org/10.1017/pasa.2021.11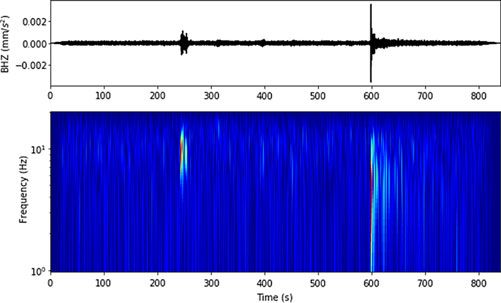
4                                                                                                                                                            T Neidhart et al.

                        Table 2. Fireball events with suspected seismic signals. Data include the coordinates of the start (latb , longb ) and end (late , longe ) of the
                        bright flight trajectory, initial velocity (V), inferred mass (m), and fireball energies (KE) at the top of the atmosphere and slopes (with
                        respect to the horizon) as observed by the DFN. The uncertainties in the trajectory positions are 0.1 km and the velocity uncertainties are
                        0.1 kms−1 . Masses are calculated using the dynamic method of Sansom et al. (2019) and are correct to an order of magnitude. Fireball
                        energy is calculated as the transfer of kinetic energy on entry

                                       latb , longb                 late , longe             hb           he             V              m              KE         Slope
                        ID                ( ◦ ,◦ )                     ( ◦ ,◦ )             (km)        (km)         (kms−1 )           (g)           (MJ)          (◦ )
                        A         −27.4556, 135.1753          −27.5068, 134.3404            86.5         29.8          22.0            1 200           286          34
                        B         −31.5395, 135.0993          −31.6170, 134.8425            75.5         42.9          21.4             10            2.29          51
                        C         −30.4119, 137.8785          −29.7315, 137.7925            69.6         37.3          15.3            900             105          23
                        D         −28.6623, 135.3836          −28.7460, 135.2587            75.1         41.7          18.0             80             13           65
                        E         −30.6361, 128.1459          −30.6801, 127.2522            99.2         72.2          38.9              2            1.51          17
                        F         −29.5592, 140.2430          −31.3590, 136.5810            98.6         66.8          38.3             10            7.33           4
                        G         −31.8641, 136.6595          −31.7352, 135.8630           111.0         90.1          69.9              1            2.44          15
                        H         −31.1390, 137.6323          −29.8901, 138.2426            85.6         31.4          17.2            1 500           222          19
                        I         −30.0159, 137.9459          −30.1322, 138.6963            79.2         41.4          15.6             50            6.08          27
                        J         −28.5360, 134.7298          −28.4699, 134.5781            60.4         39.5          38.3            4 700          3 450         51
                        K         −28.2104, 135.5600          −27.4458, 135.3177            76.4         30.0          14.8            5 500           602          28
                        L         −27.7673, 141.4574          −28.3419, 141.2917            91.9         54.9          34.9              5            3.05          29
                        M         −30.1016, 133.7398          −30.9163, 134.3092            88.2         58.3          14.4             30            3.11          16
                        N         −32.9211, 136.9160          −32.7568, 136.9180            57.3         45.0          18.3            400             67           34
                        O         −28.3672, 140.0076          −28.3798, 139.6592            97.2         70.7          31.5             60            29.80         37
                        P         −31.4627, 136.4002          −31.8320, 136.5779            82.7         42.0          13.7            5 800           544          42
                        Q         −26.1650, 140.4517          −26.6136, 139.9639            90.4         29.8          29.3            900             408          41
                        R         −33.1445, 117.1267          −32.6246, 116.8404            82.4         25.6          16.4            5 300           713          42
                        S         −32.9373, 138.8363          −32.7216, 138.9215           184.6         63.0          16.3             40            5.31          78
                        T         −27.8922, 137.0177          −27.2644, 136.6992            78.1         19.1          13.1          180 000         15 400         37
                        U         −28.0908, 136.2213          −27.8967, 136.3981            76.1         56.6          23.3              7            1.90          35
                        V         −28.0967, 136.4564          −28.0936, 136.5267            54.3         46.0          34.7            1 900          1 140         50
                        W         −31.1292, 136.2143          −31.2810, 136.2115            83.9         27.6          22.6            1 500           383          73
                        X         −29.4472, 138.1771          −29.7606, 137.9361            94.6         54.5          35.0              5            3.06          43
                        Y         −33.3076, 119.5644          −33.4876, 119.4131            76.1         29.7          16.4            877           207.43         62

       was 25 ± 13 kms−1 . Meteoroids had a very large mass range, from
       1 g up to 180 kg estimated at atmospheric entry, corresponding to
       energies of 106 –1010 J.
           The peaks in the seismic time series data are consistent with
       the calculated arrival times of the airwave travelling perpendicular
       to the fireball trajectory and/or from an omnidirectional source
       (fragmentation or frontal pressure at the end of the trajectory).
       Based on the orientation of the fireball trajectory with respect
       to the location of the nearest seismic station, 13 events [A:M]
       could have originated from the Mach cone shock wave (Figure 1a)
       and 12 events [N:Y] were likely from an omnidirectional source
       (Figure 1b; Tables 1–3).
           Figure 4 shows one example of seismic time series data (top)
       and spectrogram (bottom) of fireball event P (Tables 1–3) for
       which signals of the airwave and the Rayleigh wave can be identi-                           Figure 4. Time series data and spectrogram in vertical direction for the only fireball
       fied separately. Based on the seismic wave arrival time, the seismic                        event (DN160830_02) for which signals of the airwave and the Rayleigh wave can be
       source could be from either a direct airwave (A) or a ground-                               identified separately. Signal was detected at the stations BBOO and high-pass filter
       coupled Rayleigh wave (R). In some cases, the arrival windows                               was applied at 2 Hz.
       for A or R are clearly separated, but for most cases these windows
       overlap preventing us from confidently determining which source                             the seismic station at which the signal was detected, the shortest
       wave the signal came from (Table 3).                                                        station-to-fireball distance (dmin ), the peak values for the acceler-
           Table 3 lists DFN fireball events for which we identified                               ation in vertical (BHZ), N-S (BHN), and E-W (BHE) components
       possible corresponding seismic signals, including the name of                               seen in the time series data, the duration of the signal (t), the peak

Downloaded from https://www.cambridge.org/core. Curtin University Library, on 16 Apr 2021 at 03:02:20, subject to the Cambridge Core terms of use, available at
https://www.cambridge.org/core/terms. https://doi.org/10.1017/pasa.2021.11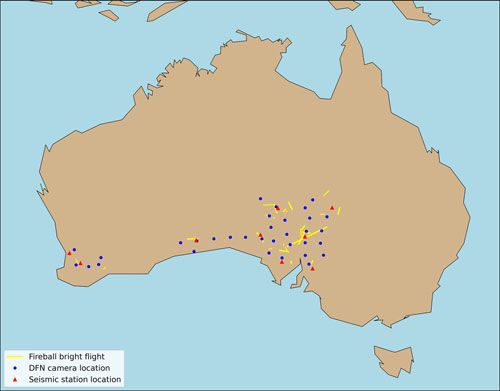
Publications of the Astronomical Society of Australia                                                                                                              5

                         Table 3. Fireball events with suspected seismic signal data, including the shortest station-to-trajectory distance (dmin ), peak values for
                         the seismic acceleration in vertical (BHZ), N-S (BHN), and E-W (BHE) seismic axes, estimated duration of the seismic signal (t), and peak
                         frequency (ν) after applying 2 Hz high-pass filter. Based on the arrival times, the seismic source can be a direct airwave (A) or a ground-
                         coupled Rayleigh wave (R). The last column shows whether the optical image of the fireball displayed clear evidence of fragmentation
                         processes

                                                    dmin        BHZ × 10−3       BHN × 10−3        BHE × 10−3          t        ν
                         ID        Station          (km)          (mms−2 )        (mms−2 )           (mms−2 )         (s)      (Hz)        Source          Fragmentation
                         A           OOD            106.8            1.38            0.62               0.67          16        3        A and/or R               Yes
                         B          BBOO            180.7            3.91            6.54               1.78          12      4–10            A                   No
                         C          LCRK            74.2             9.79            5.71               6.56           7        3           A or R                No
                         D           OOD            121.3            3.47            1.03               1.17           3        3             A                   Yes
                         E          FORT            93.0             5.04            0.67               0.17           7        3        A and/or R               Yes
                         F          LCRK            78.9             3.21            2.22               2.88          20        3           A or R                –
                         G          BBOO            150.3            1.01            0.26               0.66           9       3–5          A or R                No
                         H          LCRK            53.4             13.0            1.38               6.34          25       3–6          A or R                Yes
                         I          LCRK            69.4             9.22            3.52               4.64           9       3–5          A or R                No
                         J           OOD            138.1            3.47            1.37               1.84           7        3             A                   Yes
                         K           OOD            54.4             14.5            3.08               2.38          37       3–5          A or R                No
                         L           INKA           100.3            17.4            4.26               6.56          55        3           A or R                –
                         M          MULG            77.4             17.5            15.7               7.14          16       3–4          A or R                Yes
                         N          BBOO            92.7             0.71            0.36               0.35          24       3–5            A                   –
                         O           INKA           140.3            6.29            2.96               2.00          18       3–4            A                   Yes
                         P          BBOO            126.5            3.56            1.82               0.92          17       3–5       A and/or R               Yes
                         Q           INKA           150.3            7.91            3.43               3.29           8       3–5            A                   Yes
                         R           MUN            96.8             0.94            1.16               0.76          10       3–5            A                   –
                         S           HTT            101.1            3.08            1.69               3.22           7       3–4          A or R                –
                         T           OOD            117.6            5.68            3.41               1.98          11      3–10            A                   –
                         U           OOD            90.9             3.31            2.53               1.64           8       3–4          A or R                –
                         V           OOD            99.3             2.13            2.19               2.25           6       3–4            A                   Yes
                         W          BBOO            172.7            0.62            0.82               1.03          12       3–4            A                   Yes
                         X          LCRK            97.7             0.51            0.59               0.54          43       3–5          A or R                Yes
                         Y          NWAOa           214.5            1.47              -                 –            20      7–10            A                   No
                         a Note that NWAO station is non-aligned to cardinals.

        frequency (ν), and estimates for the seismic source. The seismic                            did not find any other azimuth on directionality. On average, the
        signals for all 25 fireballs are between 3 and 55 s long and the                            amplitude for the highest peaks for seismic signals in the vertical
        peak values of the seismic frequencies are up to 10 Hz with an                              direction was 5.5 × 10⁻³ mms−2 , while it was 2.7 × 10⁻³ mms−2
        average at 3.8±1 Hz, which is in agreement with previous works                              in N-S and 2.4 × 10⁻³ mms−2 in E-W directions. This sug-
        (D’Auria et al. 2006; Edwards et al. 2008, 2007; Kanamori et al.                            gested a slight preference in vertical direction agreeing with the
        1992; Revelle 1976). The shortest distance to the nearest seismic                           assumption that the seismic excitation was from the atmosphere.
        station is 112±40 km, ranging from 53 to 215 km, although the                                   Figure 6 shows the highest peak in vertical direction as a func-
        surveyed area reached the maximum of 325 km distance. No                                    tion of the shortest distance between the trajectory and the seismic
        surveyed fireballs were detected by more than one seismic station.                          station for all events for which seismic signals are suspected. The
        This is expected given the sparse distribution of ANSN stations                             colours of the markers represent the slope of the fireballs. It can
        and is roughly in agreement with previous works (Brown et al.                               be seen that fireballs that occur very close to the seismic station
        2003, 2004).                                                                                have higher peak amplitudes in vertical direction than fireballs fur-
            Figure 5 shows the time series data for 25 fireball events [A:Y]                        ther away. There is also additional observational bias that could
        for which seismic signals were detected. It can be seen that for 18                         be attributed to favourable fireball orientation to create Mach
        out of 25 events, the highest peaks are in the vertical direction. We                       cone disturbance that is directed at a seismic station. The Mach
        examined any correlations between the direction of the highest                              cone-related fireball detections are more likely to originate from
        peak in amplitude seen in the time series data and the position                             shallower (lower) impact angles that assure longer trajectories in
        of the seismic station relative to the trajectory of the fireball and                       the atmosphere than in the case of suspected fragmentation as a
        if the fireball approaches the seismic station or not. However, we                          seismic source.

Downloaded from https://www.cambridge.org/core. Curtin University Library, on 16 Apr 2021 at 03:02:20, subject to the Cambridge Core terms of use, available at
https://www.cambridge.org/core/terms. https://doi.org/10.1017/pasa.2021.11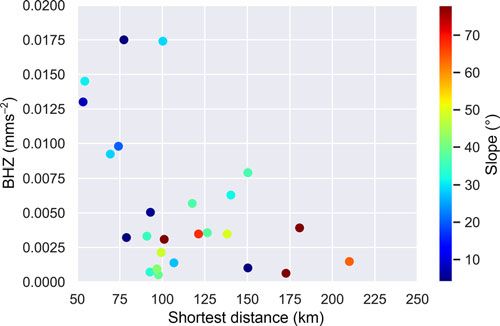
6 T Neidhart et al.
furthest events are all steep-sloped. It is therefore reasonable to
place a threshold at 215 km as an approximate limit for the seismic
detection of fireballs. Given that, the number of DFN fireballs
within this range is reduced to 1 101, increasing the detection
success to 2.3%. DFN observatories are approximately 150 km
apart. There were 1 236 of fireball trajectories within 215 km of a
DFN observatory. Should the DFN camera network be equipped
with seismic instruments (of comparable sensitivity) at each
observatory site, 86% of observed fireballs would be within the
215 km distance threshold for detection in the seismic domain.
The mean distance to a seismic station of detected fireballs using
ANSN was 112 km (Figure 6), which corresponds to about 50% of
all surveyed fireballs if each observatory site had a seismic station
equipped. It would be possible to detect fireballs at multiple
stations, with an average of four stations per fireball.
The survey showed that some seismic stations are more sen-
sitive to fireball events than others. The highest number of signal
detections was at the station Oodnadatta (OOD) which detected
seven suspected fireball events followed by Buckleboo (BBOO)
and Leigh Creek (LCRK), where each detected five events, and
Innamincka (INKA) with three events. There are five seismic
stations (Forrest (FORT), Mundaring (MUN), Hallett (HTT),
Mulgathing (MULG), Narrogin (NWAO)) that only detected one
event. This could be due to the individual instrument quality or
background noise levels which are influenced by the positioning
setup and geographic location of the sensor. Previous studies by
Revelle et al. (2004) have also pointed this out. Another sensitiv-
ity to detection might be directionality between seismic stations
Figure 5. Highest peaks in time series data in vertical, North-South and East-West and bright flight trajectory. Seismic stations that are perpendicu-
direction for 25 seismic signals that might originate from the Mach cone of fireball lar can detect the signal from the Mach cone which has a higher
events (A-M) (upper) and from fragmentation (N-Y) (lower). Eighteen signals show the amplitude and is therefore easier to recognise. A combination of
highest peak in vertical direction.
these factors, such as the presence of noise, distance to the sta-
tion, the directionality from the trajectory to the seismic stations,
weather conditions, soil properties, and also the characteristics of
the impactor, are among reasons we did not detect more than 2.3%
events within the 215 km threshold.
As well as identifying the 25 fireball events in seismic time
series data, we also investigated five of the largest events ever
seen by the DFN. Unfortunately none pass the selection cri-
teria. To date, there are two events detected by the DFN
(DN150102_01, DN170630_01) that have also been recognised by
the US Government Sensors (USG) and described in detail by
Devillepoix et al. (2019). The closest stations to these two events
where data are available were 120 and 182 km away. These stations
show noisy signals or a signal only in one component.
We also looked for seismic signals from fireballs that had
dropped a meteorite (Murrili, Sansom et al. 2020; Dingle Dell,
Devillepoix et al. 2018; DN160822_03, Shober et al. 2019) that
Figure 6. Highest amplitude in vertical for all 25 fireballs for which seismic signals are
were recovered from the field. The closest stations to these events
suspected as a function of the shortest distance between bright flight trajectory and were 150, 93 and 169, and 191 km, respectively, and show noisy
seismic station. The colours of the markers show the slope of these fireballs. The peak seismic data and no signals.
amplitude is decreasing with distance to the seismic station.
5. Conclusions
4. Discussion
Fireball events occur on a daily basis, yet are rarely reported as
From the 1 410 DFN fireball events surveyed, we identify seismic seismic events because their energy (at the top of the atmosphere)
signals in time series data that correspond to 25 of these events. is often not sufficient to cause quakes that are detectable by
This is 1.8%. Figure 6 shows there is a rough correlation between seismic stations. Unlike other studies who used data from images,
peak amplitude and distance to a seismic station. Beyond 215 km seismic stations, and infrasound to calculate the orbit and energies
we do not detect any unambiguous seismic signals, and the of meteors, this study uses information about the trajectory and
Downloaded from https://www.cambridge.org/core. Curtin University Library, on 16 Apr 2021 at 03:02:20, subject to the Cambridge Core terms of use, available at
https://www.cambridge.org/core/terms. https://doi.org/10.1017/pasa.2021.11Publications of the Astronomical Society of Australia 7
timing of fireballs observed by the DFN to search for seismic References
signals.
We report possible detections of 25 seismic signatures origi- Astropy Collaboration, et al. 2013, A&A, 558, A33
Astropy Collaboration, et al. 2018, AJ, 156, 123
nating from 1 410 surveyed fireballs observed by the DFN over a
Beech, M., Brown, P., Hawkes, R. L., Ceplecha, Z., Mossman, K., & Wetherill,
6-yr period. This is made by calculating the distance between the G. 1995, EMP, 68, 189
bright flight trajectory of the fireball to ANSN seismic stations. We Beyreuther, M., Barsch, R., Krischer, L., Megies, T., Behr, Y., & Wassermann,
searched for significant seismic signals recorded that fit our selec- J. 2010, SRL, 81, 530
tion criteria. The observed signals cannot be explained to be of Brown, P., Ceplecha, Z., Hawkes, R. L., Wetherill, G., Beech, M., & Mossman,
any other geologic or anthropogenic origin. Signals are seconds- K. 1994, Natur, 367, 624
long in duration and have peak amplitude ranges in the following Brown, P., Pack, D., Edwards, W. N., Revelle, D. O., Yoo, B. B., Spalding, R. E.,
components: & Tagliaferri, E. 2004, MPS, 39, 1781
Brown, P., ReVelle, D. O., Silber, E. A., Edwards, W. N., Arrowsmith, S.,
• Vertical: 5 × 10⁻⁴ mms−2 – 2 × 10⁻² mms−2 Jackson, L. E., Tancredi, G., & Eaton, D. 2008, JGR (P), 113, E9007
Brown, P. G., Kalenda, P., Revelle, D. O., & Borovicka, J. 2003, MPS, 38, 989
• N-S: 3 × 10⁻⁴ mms−2 – 2 × 10⁻² mms−2
Ceplecha, Z., & Revelle, D. O. 2005, MPS, 40, 35
• E-W: 4 × 10⁻⁴ mms−2 – 7 × 10⁻³ mms−2 Cevolani, G. 1994, PSS, 42, 767
D’Auria, L., Marotta, E., Martini, M., & Ricciolino, P. 2006, JGR (SE), 111,
The total of 18 out of 25 signals showed the highest peak in vertical B10307
component. The signals showed the peak frequency in the range Devillepoix, H. A. R., et al. 2018, MPS, 53, 2212
up to 10 Hz. Calculations of arrival times suggest signals are due Devillepoix, H. A. R., et al. 2019, MNRAS, 483, 5166
to direct airwaves or ground-coupled Rayleigh waves. The fireball Devillepoix, H. A. R., et al. 2020, PSS, 19, 105036
directionality suggests that about half of the observed signals could Edwards, W. N., Eaton, D. W., & Brown, P. G. 2008, RG, 46, RG4007
have been caused by the Mach cone and the other half originated Edwards, W. N., Eaton, D. W., McCausland, P. J., Revelle, D. O., & Brown, P.
from fragmentation of the impactor. G. 2007, JGR (SE), 112, B10306
We propose an upper threshold for seismic detectability of ElGabry, M. N., Korrat, I. M., Hussein, H. M., & Hamama, I. H. 2017, NRIAG
JAG, 6, 68
fireballs to be approximately 215 km. If a seismometer (of equal
Emel’yanenko, V. V., et al. 2013, SoSyR, 47, 240
sensitivity) was installed alongside these systems, it may have been Kanamori, H., Mori, J., Sturtevant, B., Anderson, D. L., & Heaton, T. 1992, SW,
possible to record 50% of all DFN fireballs. 2, 89
Karakostas, F. G., Rakoto, V., Lognonne, P. H., Larmat, C. S., Daubar, I., &
Acknowledgements. TN is fully, and PAB partially, supported by the Miljkovic, K. 2018, in AGU Fall Meeting Abstracts, P53F–3046
Australian Research Council on DP180100661. KM is fully supported by the Koten, P., Rendtel, J., Shrbený, L., Gural, P., Borovička, J., & Kozak, P. 2019,
Australian Research Council on DP180100661 and DE180100584. MW is sup- Meteors and Meteor Showers as Observed by Optical Techniques, 90
ported by DP180100661 via Discovery International Award. The DFN, EKS, Krischer, L., Megies, T., Barsch, R., Beyreuther, M., Lecocq, T., Caudron, C., &
PAB, and HARD would like to thank support from the Australian Research Wassermann, J. 2015, CSD, 8, 014003
Council as part of the Australian Discovery Project scheme (DP170102529 Le Pichon, A., et al. 2008, MPS, 43, 1797
and DP200102073), the institutional support from Curtin University, and the Oberst, J., Heinlein, D., Köhler, U., & Spurný, P. 2004, MPS, 39, 1627
Pawsey Supercomputing Centre. This research made use of data from the Revelle, D. O. 1976, JGR, 81, 1217
Australian National Seismograph Network and are available through the IRIS Revelle, D. O., Brown, P. G., & Spurný, P. 2004, MPS, 39, 1605
Data Management Center (IRISDMC). The facilities of IRIS Data Services, and Sansom, E. K., et al. 2019, ApJ, 885, 115
specifically the IRIS Data Management Center, were used for access to wave- Sansom, E. K., et al. 2020, MPS
forms, related metadata, and/or derived products used in this study. IRIS Data Shober, P., et al. 2019, AJ, 158, 183
Services are funded through the Seismological Facilities for the Advancement Spurný, P., et al. 2012, MPS, 47, 163
of Geoscience (SAGE) Award of the National Science Foundation under Stevanović, J., Teanby, N. A., Wookey, J., Selby, N., Daubar, I. J., Vaubaillon, J.,
Cooperative Support Agreement EAR-1851048. This is InSight Contribution & Garcia, R. 2017, SSR, 211, 525
Number 168. Tancredi, G., et al. 2009, MPS, 44, 1967
Tauzin, B., Debayle, E., Quantin, C., & Coltice, N. 2013, GRL, 40, 3522
Downloaded from https://www.cambridge.org/core. Curtin University Library, on 16 Apr 2021 at 03:02:20, subject to the Cambridge Core terms of use, available at
https://www.cambridge.org/core/terms. https://doi.org/10.1017/pasa.2021.11You can also read