Invivo microvascular network imaging of the human retina combined with an automatic three-dimensional segmentation method - SPIE Digital Library
←
→
Page content transcription
If your browser does not render page correctly, please read the page content below
In vivo microvascular network
                 imaging of the human retina
                 combined with an automatic three-
                 dimensional segmentation method

                 Shenghai Huang
                 Zhonglie Piao
                 Jiang Zhu
                 Fan Lu
                 Zhongping Chen

Downloaded From: https://www.spiedigitallibrary.org/journals/Journal-of-Biomedical-Optics on 26 Aug 2021
Terms of Use: https://www.spiedigitallibrary.org/terms-of-use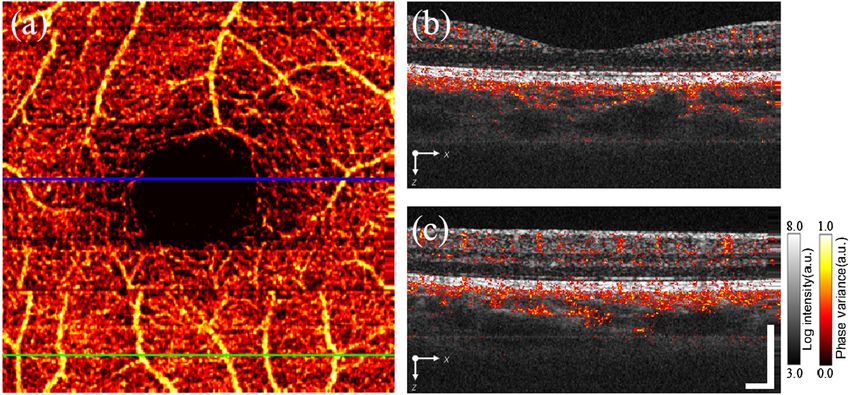
Journal of Biomedical Optics 20(7), 076003 (July 2015)

                In vivo microvascular network imaging of
                the human retina combined with an automatic
                three-dimensional segmentation method
                Shenghai Huang,a,b Zhonglie Piao,b Jiang Zhu,b Fan Lu,a and Zhongping Chena,b,c,*
                a
                  Wenzhou Medical University, School of Optometry and Ophthalmology, 270 Xueyuan Road, Wenzhou 325027, China
                b
                  University of California, Irvine, Beckman Laser Institute, 1002 Health Sciences Road East, Irvine, California 92612, United States
                c
                  University of California, Irvine, Department of Biomedical Engineering, Irvine, California 92697, United States

                              Abstract. Microvascular network of the retina plays an important role in diagnosis and monitoring of various
                              retinal diseases. We propose a three-dimensional (3-D) segmentation method with intensity-based Doppler vari-
                              ance (IBDV) based on swept-source optical coherence tomography. The automatic 3-D segmentation method is
                              used to obtain seven surfaces of intraretinal layers. The microvascular network of the retina, which is acquired by
                              the IBDV method, can be divided into six layers. The microvascular network of the six individual layers is visu-
                              alized, and the morphology and contrast images can be improved by using the segmentation method. This
                              method has potential for earlier diagnosis and precise monitoring in retinal vascular diseases. © 2015 Society of
                              Photo-Optical Instrumentation Engineers (SPIE) [DOI: 10.1117/1.JBO.20.7.076003]

                              Keywords: optical coherence tomography; swept-source optical coherence tomography; Doppler optical coherence tomography;
                              Doppler variance; intensity-based Doppler variance; angiography; three-dimensional segmentation; dynamic programming.
                              Paper 150176R received Mar. 17, 2015; accepted for publication Jun. 12, 2015; published online Jul. 13, 2015.

                1     Introduction                                                                 a phase instable situation, and the human choroidal blood vessel
                Most retinal diseases are closely related to vasculopathy, such                    network was also achieved.9
                as diabetic retinopathy, retinal vascular occlusive disease, and                       Compared with FFA which only shows 2-D images of the
                choroidal neovascularization. Fundus fluorescein angiography                       fundus, OCT can provide the 3-D structure of the fundus.
                (FFA) is widely used in clinical practice and is the gold standard                 The vascular morphology of intraretinal layers can be obtained
                for vascular imaging of the retina and choroid. However, it is an                  by combining OCT angiography and 3-D segmentation of intra-
                invasive procedure with an associated risk of complications                        retinal layers. It may allow earlier diagnosis and more precise
                which limits clinical applications.1 In addition, FFA can only                     monitoring of some retinal diseases.19,20 There are several
                provide two-dimensional (2-D) images of the fundus, and the                        approaches that have successfully segmented intraretinal layers
                deeper capillary network may not be visualized well by FFA.2                       in 2-D images, such as the active contour model,21 Dijkstra algo-
                    Optical coherence tomography (OCT) is a noninvasive, high-                     rithm,22 and dynamic programming.23 The 3-D surfaces of the
                resolution biomedical imaging technology that can provide                          retina can be obtained by applying these 2-D based algorithms
                three-dimensional (3-D) images of the fundus. Doppler OCT                          independently on each image. Compared with 2-D-based meth-
                (D-OCT) is a functional extension of OCT which can image                           ods, 3-D-based segmentation methods can make full use of the
                not only structure but also blood flow.3–5 Compared to the abso-                   information from neighboring B-scans and help improve the
                lute value of flow velocity, the microvascular networks in the                     accuracy and robustness of the algorithm. A graph cut-based
                retina are also important for diagnosing retinal diseases. A num-                  segmentation method was proposed for simultaneous segmen-
                ber of methods have been developed to visualize the microvas-                      tation of multiple 3-D surfaces in the macula24 and optic nerve
                cular networks. A phase-resolved Doppler variance method was                       head.25 However, the minimum cut graph algorithm is computa-
                first used to map vessels in human skin and brain.6,7 Since then,                  tionally expensive which usually requires minutes to complete
                it has been used in imaging retinal flow.8–10 Yasuno et al.11 and                  a 3-D data segmentation. Cheng and Lin26 proposed a fast 3-D
                Wang et al.12 used a modified Hilbert transform to achieve high-                   dynamic programming expansion method for vessel boundary
                resolution images of blood flow. Several extensions of D-OCT                       detection on magnetic resonance imaging sequences. Efficiency
                based on amplitude variance have also demonstrated capabilities                    was significantly improved with good robustness, and this
                of microvascular imaging which are not sensitive to phase noise                    method can be used in retinal boundary detection.
                artifacts, including speckle variance,13,14 correlation mapping,15                     In this paper, we combine the 3-D dynamic programming
                split-spectrum amplitude-decorrelation angiography,16 intensity-                   method with intensity-based Doppler variance based on swept-
                based Doppler variance (IBDV).9,17,18 Compared with phase-                         source OCT (SS-OCT). The microvascular morphology of intra-
                resolved methods, amplitude variance methods do not depend                         retinal layers is visualized in vivo in a normal subject by using
                on phase stability. The IBDV method has been demonstrated in                       this method. The microvascular network with the 3-D structure

                *Address all correspondence to: Zhongping Chen, E-mail: z2chen@uci.edu             1083-3668/2015/$25.00 © 2015 SPIE

                Journal of Biomedical Optics                                              076003-1                                            July 2015   •   Vol. 20(7)

Downloaded From: https://www.spiedigitallibrary.org/journals/Journal-of-Biomedical-Optics on 26 Aug 2021
Terms of Use: https://www.spiedigitallibrary.org/terms-of-use
Huang et al.: In vivo microvascular network imaging of the human retina combined. . .

                of the retina has potential for earlier diagnosis and precise mon-                     In order to obtain the vascular morphology of the intraretinal
                itoring in retinal vascular diseases.                                              layers, the boundaries of each layer are required. We used a 3-D
                                                                                                   expansion of the dynamic programming method26 for automated
                2     Methods                                                                      boundaries detection. The basic idea of the method is to trans-
                                                                                                   form the boundary detection problem to an optimization prob-
                In this study, a 1050-nm SS-OCT system was used to acquire the                     lem that searches for an optimal path. In 2-D images, each pixel
                3-D data of the fundus. A commercially available swept-source                      is treated as a node in the graph, and the links connecting the
                laser (Axsun Technologies Inc., Billerica, Massachusetts) with a                   nodes are called edges. The values of the links are assigned
                center wavelength of 1050 and 100 nm tuning range was used.                        based on the intensity of the pixels. The start node is a virtual
                The configuration of the system has already been described in                      node which connects to the nodes in the first column in the
                previous reports.27 The axial resolution was 6.4 μm, and the                       image and the weights are assigned to zero. Correspondingly,
                image range was 3.0 mm at the retina (n ¼ 1.38). The interfer-
                                                                                                   the end node is also a virtual node which connects to the
                ence signal was digitized by a 12 bit 500 MHz data acquisition
                                                                                                   nodes in last column. The boundaries can be found by searching
                board, ATS9350 (Alazar Technologies Inc., Pointe-Claire, QC,
                                                                                                   the minimum cost of the path from start node to end node. For
                Canada), and the signal acquisition was triggered by an optical
                                                                                                   3-D expansion, the surfaces of the layers were achieved by
                clock generated by the Axsun laser. The signal-to-noise ratio
                                                                                                   sequentially performing the search process in the fast scan
                (SNR) of the system was 95 dB with 1.8 mW of sample arm
                                                                                                   plane and slow scan plane. The dynamic programming provides
                power and a 100-kHz acquisition rate. A 3-dB sensitivity roll-
                                                                                                   an efficient optimization method to find the minimum cost of the
                off from 0.1-mm imaging depth to 1.5-mm imaging depth was
                measured.                                                                          surface.
                    Three right eyes (two normal subjects and one high myopia                          Consider a volumetric image Rðx; y; zÞ of size X × Y × Z,
                patient) were used to demonstrate the feasibility of the method                    where the X and Y are the numbers of fast scan and slow
                under the protocols approved by the Institutional Review Board.                    scan, and Z denotes the depth. The iterative cost function in two
                Each set of 3-D measurements was composed of 200 slices of                         directions is given by26
                400 A-lines over an area of 2.5 mm × 2.5 mm. Each slice was
                composed of eight sequential B-scans at the same position,                         C1 ðx;y;zÞ ¼ min fC1 ðx þ i;y − 1;zÞ þ α1 jij þ wðx þ i;xÞg
                                                                                                                 −d1 ≤i≤d1
                which can achieve a high time difference (T) to improve the
                sensitivity of the IBDV method. The total acquisition time of                      C2 ðx;y;zÞ ¼ min fC2 ðx − 1;y þ j;zÞ þ α2 jjjg þ C1 ðx;y;zÞ;
                                                                                                                 −d2 ≤j≤d2
                a 3-D volumetric data was approximately 6.8 s including the
                flyback time. The subject was asked to fixate on an internal                                                                                          (2)
                target during the acquisition.
                    Custom-built OCT data acquisition and processing software                      for 1 < x ≤ X and 1 < y ≤ Y, where C1 and C2 are the accumu-
                was developed with Microsoft Visual C++ 2012. In order to                          lation costs in the x–z plane and the y–z plane, respectively. The
                achieve real-time preview of the acquired data, the graphics                       initialization of C1 and C2 are assigned by Rðx; y; zÞ. The
                processing unit (GPU)-accelerated computing technique was                          parameters d1 and d2 constrain the searching range which can
                used with NVIDIA’s compute unified device architecture                             be used to control the smoothness of the surfaces. The param-
                (CUDA, 6.5) toolkit. The SS-OCT preprocessing, including                           eters α1 and α2 are also used to control the smoothness of the
                fixed pattern noise removal, spectral shaping, zero-padding, and                   surfaces. For retinal segmentation, the parameters α1 and α2 are
                numerical dispersion compensation, was accelerated by the                          set to zero. The volumetric image Rðx; y; zÞ is the intensity gra-
                GPU. Figure 1 shows the flow diagram of the IBDV method                            dient image along the vertical direction which is obtained by the
                combined with 3-D segmentation after obtaining the complex                         dark-to-light or light-to-dark intensity transition. wðx þ i; xÞ
                OCT data by preprocessing the interference signal.                                 denotes the weights from node ðx þ i; y − 1; zÞ to node ðx; y; zÞ
                    The intensity-based Doppler variance method9 was used to                       and the weights can be calculated as follows22
                visualize the retinal vasculature. The time difference (T) was
                increased by using the interframe method. Although the motion                      wðx þ i; xÞ ¼ 2 − rðx þ i; y − 1; zÞ − rðx; y; zÞ þ wmin ;
                artifacts were significantly attenuated because of the improve-                                                                                       (3)
                ment of acquisition speed, the motion between the B-scans
                still cannot be ignored, especially the axis motion.28 A subpixel                  where rðx; y; zÞ is the gradient value of the node ðx; y; zÞ which
                registration algorithm29 was used to alignment sequential                          is normalized to values between 0 and 1. The wmin is the mini-
                B-scans in both the fast transverse direction, x, and axial direc-                 mum weight for system stabilization, which is set at 1 × 10⁻⁵ .
                tion, z. The variance value (σ 2 ) between sequential B-scans in                       Figure 1 outlines the core steps of the 3-D segmentation
                the same position is given by9,18                                                  method for the retina. The averaged images were obtained from
                                  PM PN−1                                                        eight consecutive B-scans after registration. Before segmenta-
                       1                   n¼1 ðjAn;m jjAnþ1;m jÞ                                  tion, a 3-D median filter is applied to the volumetric data
                σ2 ¼        1 − P     P
                                     m¼1
                                                                       ;                (1)
                       T2         M
                                  m¼1   n¼1 2 ðjAn;m j þ jAnþ1;m j Þ
                                        N−1 1         2           2                                using a window size of 5 × 3 × 5 voxels. The initial location of
                                                                                                   the retina is determined by the inner limiting membrance (ILM)
                where M is the number of the depth points that are averaged and                    layer and retinal pigment epithelium (RPE) layer. The ILM layer
                N is the number of the B-scans at the same position. The SNR                       is defined as the first high reflective increase from the inner side
                can be increased by choosing a larger Z and N. In this applica-                    of the retina, and the RPE layer can be determined as the highest
                tion, the M is the set at 2 and the N is the set at 8. An;m denotes                peak after the ILM layer. Therefore, the initial location of the
                the amplitude value which is extracted from complex OCT data.                      ILM and RPE layer can be determined from the A-scan profile.
                Finally, a threshold based on the histogram analysis of the aver-                  After smoothing by using the polynomial method, the search
                aged intensity images is used to remove the noise.                                 area for the ILM layer can be reduced based on the rudimentary

                Journal of Biomedical Optics                                              076003-2                                              July 2015   •   Vol. 20(7)

Downloaded From: https://www.spiedigitallibrary.org/journals/Journal-of-Biomedical-Optics on 26 Aug 2021
Terms of Use: https://www.spiedigitallibrary.org/terms-of-use
Huang et al.: In vivo microvascular network imaging of the human retina combined. . .
Fig. 1 Flow diagram of intensity-based Doppler variance imaging process with three-dimensional (3-D)
segmentation.
ILM boundary. Finally, the ILM layer is refined by finding the improve the accuracy and robustness of the algorithm. Garvin
optimal path in a limited region. After obtaining the location of et al.24 proposed a graph cut-based method for simultaneous seg-
the retina, the limited search region can be determined based on mentation of multiple 3-D surfaces in the retina. However, the
the characteristics of the retinal structure. The OPL/ONL layer computational complexity was significantly increased in the 3-D
and IS/OS layer are the most obvious layers besides the ILM data. Compared with the graph cut method, the computational
layer, and the intensity transition along the axis direction complexity can be significantly reduced by using a dynamic
between two layers are in opposite directions. Therefore, these programming method. The processing time for finding an opti-
two layers can be determined first. The other surfaces can also mal surface from volume data with 400 × 200 × 80 voxels was
be obtained by limiting the search region based on the previous ∼0.5 s with parallel techniques in a Quad-Core Intel i7 2.66GHz
layers. A 2-D average filter is applied to the segmentation results workstation. The total processing time for extracting all of the
to obtain smooth surfaces. Finally, the surfaces of ILM, nerve
fiber layer (NFL)/ganglion cell layer (GCL), inner plexiform
layer (IPL)/inner nuclear layer (INL), INL/outer plexiform layer
(OPL), OPL/outer nuclear layer (ONL), outer segment (IS)/
outer segment (OS), and RPE/choroid [Fig. 2(c)] are detected
by the automatic algorithm.
Combined with the 3-D surfaces data, the volumetric micro-
vascular signal of the retina can be segmented into different
layers from the IBDV dataset. The en face projection view of
the microvascular network for intraretinal layers is produced
by using the maximum intensity projection (MIP) method.
3 Results and Discussion
The 3-D OCT data of the retina from three right eyes was col-
lected to test the feasibility of the method. The seven surfaces
of the intraretinal layers were segmented automatically by the
developed automated segmentation algorithm. The 3-D volume
rendering of the retina centered on the macular fovea with an
image area of 2.5 mm × 2.5 mm is shown in Fig. 2(a). The
seven segmented surfaces from the ILM layer to the RPE/cho-
roid boundary are reconstructed [Fig. 2(b)] such that the retina
from ILM layer to RPE/choroid boundary can be divided into
six layers, including NFL, GCL + IPL, INL, OPL, ONL + IS,
and OS. Figure 2(c) shows a cross-section image overlaid with Fig. 2 Three-dimensional segmentation of the retina by using a 3-D
the segmented boundaries, and the position of the image is indi- expansion of dynamic programming method. (a) 3-D volume render-
cated by the planes in Figs. 2(a) and 2(b). The flying view of ing of the retina centered on the macular fovea. (b) Three-dimensional
the segmented layers along the y axis is also shown in Video 1. rendering of the seven segmented surfaces from the ILM layer to the
The position of the segmented layers accurately fall on the RPE/choroid boundary. (c) The corresponding cross-section images
corresponding boundaries of intraretinal layers [Fig. 2(c) and overlaid with segmented boundaries indicated by the planes in (a) and
(b). The boundaries from inner to outer retina: 1. ILM; 2. NFL/GCL;
Video 1], and the six layers of the retina are successfully 3. IPL/INL; 4. INL/OPL; 5. OPL/ONL; 6. IS/OS; and 7. RPE/choroid.
obtained. Compared with the 2-D image segmentation algorithm Scale bar: 0.4 mm. Video 1 gives a flying view of the segmented
in the retina,22,23 the 3-D expansion dynamic programming layers along the y -axis (Video 1, MEPG, 3.18 MB) [URL: http://dx
method can use the information from neighboring B-scans to .doi.org/10.1117/1.JBO.20.7.076003.1].
Journal of Biomedical Optics 076003-3 July 2015 • Vol. 20(7)
Downloaded From: https://www.spiedigitallibrary.org/journals/Journal-of-Biomedical-Optics on 26 Aug 2021
Terms of Use: https://www.spiedigitallibrary.org/terms-of-useHuang et al.: In vivo microvascular network imaging of the human retina combined. . .
Table 1 Differences (mean SD in pixels) in retinal boundary positions of 27 slides from three sets of 3-D volume data. Between-segmenter
indicates the mean differences of M1 versus M2, M1 versus M3, and M2 versus M3; auto indicates the results from automated segmentation; M1,
M2, and M3 indicate the results from three trained graders; Avg indicates the averaged results from graders. Each pixel is 2.83 μm.
Retinal layer Between-segmenter Auto versus M1 Auto versus M2 Auto versus M3 Auto versus Avg
ILM 0.89 0.80 1.25 1.10 1.44 1.14 1.61 1.15 1.38 1.03
NFL/GCL 1.15 1.03 1.51 1.21 1.64 1.39 1.79 1.40 1.52 1.22
IPL/INL 1.81 1.72 1.87 1.41 2.18 1.60 1.74 2.01 1.66 1.33
INL/OPL 1.55 1.35 1.91 1.34 1.55 1.31 2.03 1.69 1.56 1.30
OPL/ONL 1.57 1.68 1.60 1.39 1.68 1.48 1.93 2.10 1.55 1.34
IS/OS 0.80 0.73 1.04 0.89 1.28 0.93 1.40 0.98 1.16 0.86
RPE/choroid 1.15 1.03 1.70 1.32 1.72 1.24 1.69 1.18 1.59 1.10
surfaces was ∼8 s and the most time-consuming step was the on the normal characteristics of retinal structure. The algorithm
3-D median filter processing. may fail with obvious abnormal structures, such as central
To evaluate the accuracy of the developed automated seg- serous chorioretinopathy (serous detachment of the neurosen-
mentation algorithm, the results of 27 slides from three sets sory retina) and retinitis pigmentosa (disappearance of the
of 3-D volume data were compared to those achieved by manual OS layer).30 However, the 3-D expansion dynamic programming
segmentation. Nine linear spaced slides (in the fast scan plane) method is suitable for interactive segmentation in retinal
from each dataset were selected, and the fifth slide was centered disease because of a significant reduction in the computational
at the fovea. The manual boundary detections were obtained by complexity.
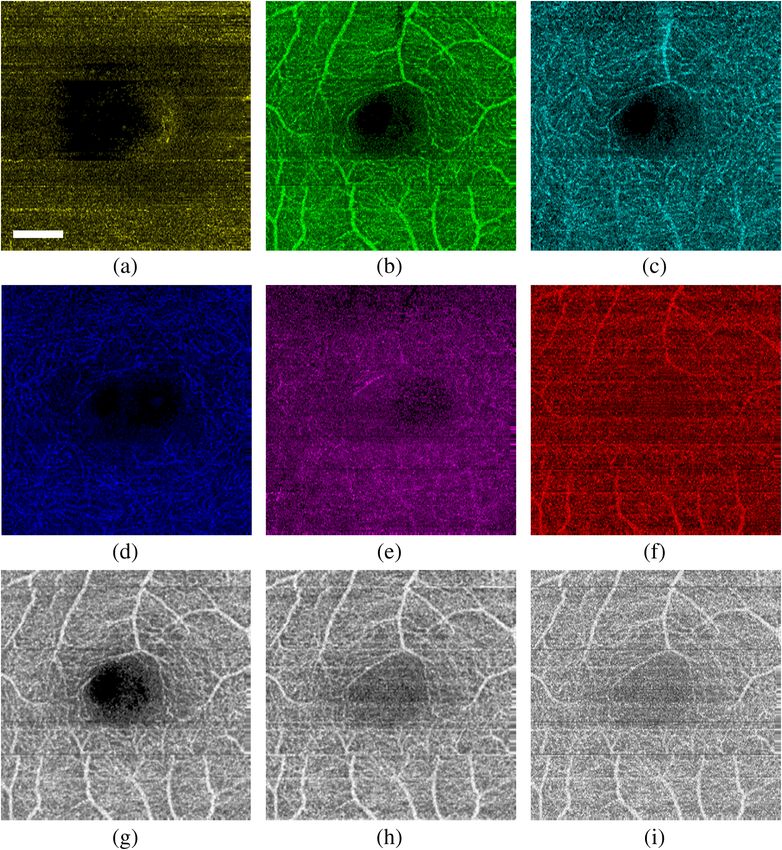
three trained graders using ImageJ software [National Institutes The microvascular network of the macular retina was also
of Health (NIH), Bethesda, Maryland]. The automatic detec- obtained by using the IBDV method. Figure 3(a) shows
tions were extracted from the corresponding positions of the en face retina vessels from the ILM layer to the RPE/choroid
seven segmented surfaces. The mean standard deviation of boundary by using the MIP method. The capillary network
the difference in retinal boundary positions between the auto- can clearly be visualized around the foveal avascular zone.
mated and manual detections was calculated.23 The boundaries Figures 3(b) and 3(c) are cross-sectional views of the vessels
of retinal layers detected by the automated algorithm were very merged with the intensity images corresponding to the blue and
close to the manual segmentation results in both normal and green lines in Fig. 3(a). Video 2 shows the changes of the vessels
high-myopia eyes. The mean differences were within 2.18 pixels along the y axis. Most of the vessel signals are located in the
(Table 1) which are similar to 2-D-based segmentation algo- inner retina and choroid. There are also some Doppler variance
rithms.22,23 The differences between automatic segmentation signals in the outer retina which should be avascular. This
and averaged manual segmentation were similar to the differ- should relate to the shadow artifact from the upper layers.10,31
ence between manual graders. The layers were segmented based Total processing for obtaining the IBDV images from the raw
Fig. 3 In vivo microvascular network of macular retina in a healthy subject (2.5 mm × 2.5 mm). (a) En
face maximum intensity projection (MIP) view image of the retinal microvascular network from ILM layer
to RPE/choroid boundary; (b) and (c) cross-sectional views of the retina marked by the blue and green
lines in (a). The color-encoded vessel images are merged with intensity images (gray scale). Scale bar:
0.4 mm. Video 2 shows flying view of the vessel signal along the y-axis (Video 2, MEPG, 8.47 MB) [URL:
http://dx.doi.org/10.1117/1.JBO.20.7.076003.2].
Journal of Biomedical Optics 076003-4 July 2015 • Vol. 20(7)
Downloaded From: https://www.spiedigitallibrary.org/journals/Journal-of-Biomedical-Optics on 26 Aug 2021
Terms of Use: https://www.spiedigitallibrary.org/terms-of-useHuang et al.: In vivo microvascular network imaging of the human retina combined. . .
Fig. 4 Intensity-based Doppler variance method combined with 3-D segmentation of the retina. (a)–(f):
En face MIP view microvascular images of the six individual layers: (a) NFL, (b) GCL + IPL, (c) INL,
(d) OPL, (e) ONL + IS, and (f) OS + RPE. (g) MIP view microvascular image of the inner retina
(from NFL/GCL boundary to OPL/ONL boundary). (h) MIP view microvascular image of the total retina
(from ILM layer to RPE/choroid boundary). (i) MIP view microvascular image of the retina with a range of
400-μm depth above the RPE/choroid boundary. Scale bar: 0.5 mm.
dataset is ∼30 s after acceleration by the GPU (NVIDIA, Compared with simply projecting the maximum values with
GeForce GTX 460). a range of 400-μm depth above the RPE/choroid boundary
Combined with seven surfaces of the intraretinal data, the [Fig. 4(i)], the MIP view from the ILM layer to the RPE/choroid
microvascular network of the macular retina can be divided boundary [Fig. 4(h)] can help to improve the quality of an OCT
into six layers. Figures 4(a)–4(f) present an en face MIP micro- angiography image. Because the retinal vessels are concentrated
vascular view of the six layers, including NFL, GCL + IPL, in the inner retinal layers (GCL, IPL, INL, OPL), the contrast of
INL, OPL, ONL + IS, and OS + RPE. Most of the vessels in the microvascular images can be improved by projecting the
the macular region are located in the inner retina, which maximum values from the NFL/GCL boundary to the OPL/
agree with the known anatomy.32 In Figs. 4(h) and 4(i), some ONL boundary [Fig. 4(g)] rather than the total retina [Fig. 4(h)].
deeper microvessels may be sheltered from upper vessels in
the en face view of the total retina. Segmentation of the individ- 4 Conclusion
ual layers can help to separate these vessels. Microvascular In summary, we have demonstrated a 3-D segmentation method
images of individual layers may provide some essential infor- with IBDV based on SS-OCT with a center wavelength of
mation for early diagnosis of some retinal diseases. The shadow 1050 nm. The feasibility of the method was tested on 3-D data
artifacts are also observed in the MIP view of the individual of a retina centered on the macular fovea with an image area of
layers [Fig. 4(f)]. However, most of the shadow artifacts are gen- 2.5 mm × 2.5 mm. The seven surfaces of the intraretinal layers
erated from the relatively large vessels [Figs. 3(b) and 3(c)]. were successfully segmented automatically by using a 3-D
Journal of Biomedical Optics 076003-5 July 2015 • Vol. 20(7)
Downloaded From: https://www.spiedigitallibrary.org/journals/Journal-of-Biomedical-Optics on 26 Aug 2021
Terms of Use: https://www.spiedigitallibrary.org/terms-of-useHuang et al.: In vivo microvascular network imaging of the human retina combined. . .
expansion of a dynamic programming method. The IBDV 15. J. Enfield, E. Jonathan, and M. Leahy, “In vivo imaging of the micro-
method was used to acquire the microvascular network of the circulation of the volar forearm using correlation mapping optical coher-
ence tomography (cmOCT),” Biomed. Opt. Express 2(5), 1184–1193
macular retina. The en face MIP microvascular network images
(2011).
of six layers were obtained after combining the 3-D surfaces of 16. Y. L. Jia et al., “Split-spectrum amplitude-decorrelation angiography
the segmented layers. The morphology of the microvascular net- with optical coherence tomography,” Opt. Express 20(4), 4710–4725
work for the individual intraretinal layers can be visualized, and (2012).
the segmentation method can also be used to enhance the con- 17. G. Liu et al., “High-resolution imaging of microvasculature in human
trast of the vascular images. This method has potential for earlier skin in-vivo with optical coherence tomography,” Opt. Express 20(7),
diagnosis and precise monitoring in retinal vascular diseases. 7694–7705 (2012).
18. G. Liu et al., “A comparison of Doppler optical coherence tomography
methods,” Biomed. Opt. Express 3(10), 2669–2680 (2012).
Acknowledgments 19. P. A. D’Amore, “Mechanisms of retinal and choroidal neovasculariza-
This work was supported by the National Institutes of Health tion,” Invest. Ophthalmol. Visual Sci. 35(12), 3974–3979 (1994).
under Grant Nos. R01EY-021529, R01HL-125084, R01HL- 20. B. L. Sikorski et al., “The diagnostic function of OCT in diabetic
105215, and P41-EB015890; and the National Major Equip- maculopathy,” Mediators Inflammation 2013, 434560 (2013).
21. A. Mishra et al., “Intra-retinal layer segmentation in optical coherence
ment Program from the Ministry of Science and Technology tomography images,” Opt. Express 17(26), 23719–23728 (2009).
in Beijing, China, under Grant No. 2012YQ12008004. Dr. 22. S. J. Chiu et al., “Automatic segmentation of seven retinal layers in
Zhongping Chen has a financial interest in OCT Medical Inc., SDOCT images congruent with expert manual segmentation,” Opt.
which, however, did not support this work. Express 18(18), 19413–19428 (2010).
23. Q. Yang et al., “Automated layer segmentation of macular OCT images
using dual-scale gradient information,” Opt. Express 18(20), 21293–
References 21307 (2010).
24. M. K. Garvin et al., “Automated 3-D intraretinal layer segmentation of
1. L. A. Yannuzzi et al., “Fluorescein angiography complication survey,” macular spectral-domain optical coherence tomography images,” IEEE
Ophthalmology 93(5), 611–617 (1986). Trans. Med. Imaging 28(9), 1436–1447 (2009).
2. K. R. Mendis et al., “Correlation of histologic and clinical images to 25. B. J. Antony et al., “Automated 3D segmentation of multiple surfaces
determine the diagnostic value of fluorescein angiography for studying with a shared hole: segmentation of the neural canal opening in SD-
retinal capillary detail,” Invest. Ophthalmol. Vis. Sci. 51(11), 5864– OCT volumes,” Med. Image Comput. Comput. Assist. Interv. 17(Pt. 1),
5869 (2010). 739–746 (2014).
3. Z. Chen et al., “Optical Doppler tomographic imaging of fluid flow 26. D. C. Cheng and J. T. Lin, “Three-dimensional expansion of a dynamic
velocity in highly scattering media,” Opt. Lett. 22(1), 64–66 (1997). programming method for boundary detection and its application to
4. Z. Chen et al., “Noninvasive imaging of in vivo blood flow velocity sequential magnetic resonance imaging (MRI),” Sensors 12(5),
using optical Doppler tomography,” Opt. Lett. 22(14), 1119–1121 5195–5211 (2012).
(1997). 27. B. Potsaid et al., “Ultrahigh speed 1050 nm swept source/Fourier
5. Y. Zhao et al., “Phase-resolved optical coherence tomography and opti- domain OCT retinal and anterior segment imaging at 100,000 to
cal Doppler tomography for imaging blood flow in human skin with fast 400,000 axial scans per second,” Opt. Express 18(19), 20029–20048
scanning speed and high velocity sensitivity,” Opt. Lett. 25(2), 114–116 (2010).
(2000). 28. R. de Kinkelder et al., “Heartbeat-induced axial motion artifacts in
6. Y. Zhao et al., “Doppler standard deviation imaging for clinical mon- optical coherence tomography measurements of the retina,” Invest.
itoring of in vivo human skin blood flow,” Opt. Lett. 25(18), 1358–1360 Ophthalmol. Vis. Sci. 52(6), 3908–3913 (2011).
(2000). 29. M. Guizar-Sicairos, S. T. Thurman, and J. R. Fienup, “Efficient subpixel
7. L. Yu et al., “Spectral Doppler optical coherence tomography imaging image registration algorithms,” Opt. Lett. 33(2), 156–158 (2008).
of localized ischemic stroke in a mouse model,” J. Biomed. Opt. 15(6), 30. P. Riordan-Eva and E. Cunningham, Vaughan and Asbury’s General
066006 (2010). Ophthalmology, 18th ed., McGraw-Hill, New York (2011).
8. L. Yu and Z. Chen, “Doppler variance imaging for three-dimensional 31. L. An, T. T. Shen, and R. K. Wang, “Using ultrahigh sensitive optical
retina and choroid angiography,” J. Biomed. Opt. 15(1), 016029 (2010). microangiography to achieve comprehensive depth resolved microvas-
9. G. Liu et al., “Intensity-based modified Doppler variance algorithm: culature mapping for human retina,” J. Biomed. Opt. 16(10), 106013
application to phase instable and phase stable optical coherence tomog- (2011).
raphy systems,” Opt. Express 19(12), 11429–11440 (2011). 32. D. M. Snodderly, R. S. Weinhaus, and J. Choi, “Neural-vascular rela-
10. D. Y. Kim et al., “In vivo volumetric imaging of human retinal circu- tionships in central retina of macaque monkeys (Macaca fascicularis),”
lation with phase-variance optical coherence tomography,” Biomed. J. Neurosci. 12(4), 1169–1193 (1992).
Opt. Express 2(6), 1504–1513 (2011).
11. Y. Yasuno et al., “In vivo high-contrast imaging of deep posterior eye by
Zhongping Chen is a professor of biomedical engineering and the
1-μm swept source optical coherence tomography andscattering optical
director of the F-OCT Laboratory at the University of California,
coherence angiography,” Opt. Express 15(10), 6121–6139 (2007). Irvine. He is a co-founder and the board chairman of OCT Medical
12. R. K. Wang et al., “Three dimensional optical angiography,” Opt. Imaging Inc. His research group has pioneered the development of
Express 15(7), 4083–4097 (2007). Doppler optical coherence tomography. He has published more
13. A. Mariampillai et al., “Speckle variance detection of microvasculature than 200 peer-reviewed papers. He is a fellow of the American
using swept-source optical coherence tomography,” Opt. Lett. 33(13), Institute of Medical and Biological Engineering, a fellow of SPIE,
1530–1532 (2008). and OSA.
14. A. Mariampillai et al., “Optimized speckle variance OCT imaging of
microvasculature,” Opt. Lett. 35(8), 1257–1259 (2010). Biographies for the other authors are not available.
Journal of Biomedical Optics 076003-6 July 2015 • Vol. 20(7)
Downloaded From: https://www.spiedigitallibrary.org/journals/Journal-of-Biomedical-Optics on 26 Aug 2021
Terms of Use: https://www.spiedigitallibrary.org/terms-of-useYou can also read