Evaluating the peripheral optical effect of multifocal contact lenses
←
→
Page content transcription
If your browser does not render page correctly, please read the page content below
Ophthalmic & Physiological Optics ISSN 0275-5408

TECHNICAL NOTE

Evaluating the peripheral optical effect of multifocal contact
lenses
Robert Rosén1, Bart Jaeken2, Anna Lindskoog Petterson3, Pablo Artal2, Peter Unsbo1 and
Linda Lundström1
1
 Biomedical & X-Ray Physics Royal Institute of Technology (KTH), Stockholm, Sweden, 2Laboratorio de Optica, Universidad de Murcia, Murcia, Spain,
and 3Unit of Optometry, Karolinska Institute, Stockholm, Sweden

Citation information: Rosén R, Jaeken B, Lindskoog Petterson A, Artal P, Unsbo P & Lundström L. Evaluating the peripheral optical effect of
multifocal contact lenses. Ophthalmic Physiol Opt 2012. doi: 10.1111/j.1475-1313.2012.00937.x

Keywords: defocus, depth of field,                    Abstract
multifocal/bifocal/dual-focus contact lenses,
myopia, peripheral wavefront aberrations              Purpose: Multifocal soft contact lenses have been used to decrease the progression
                                                      of myopia, presumably by inducing relative peripheral myopia at the same time
Correspondence: Linda Lundström                      as the central image is focused on the fovea. The aim of this study was to investi-
E-mail address: linda@biox.kth.se                     gate how the peripheral optical effect of commercially available multifocal soft
                                                      contact lenses can be evaluated from objective wavefront measurements.
Received: 20 March 2012; Accepted: 2 August
                                                      Methods: Two multifocal lenses with high and low add and one monofocal design
2012
                                                      were measured over the ±40° horizontal field, using a scanning Hartmann–Shack
                                                      wavefront sensor on four subjects. The effect on the refractive shift, the peripheral
                                                      image quality, and the depth of field of the lenses was evaluated using the area
                                                      under the modulation transfer function as the image quality metric.
                                                      Results: The multifocal lenses with a centre distance design and 2 dioptres of add
                                                      induced about 0.50 dioptre of relative peripheral myopia at 30° in the nasal visual
                                                      field. For larger off-axis angles the border of the optical zone of the lenses severely
                                                      degraded image quality. Moreover, these multifocal lenses also significantly
                                                      reduced the image quality and increased the depth of field for angles as small as
                                                      10°–15°.
                                                      Conclusions: The proposed methodology showed that the tested multifocal soft
                                                      contact lenses gave a very small peripheral myopic shift in these four subjects and
                                                      that they would need a larger optical zone and a more controlled depth of field to
                                                      explain a possible treatment effect on myopia progression.

                                                                             Wildsoet7). Furthermore, the sign of peripheral defocus has
Introduction
                                                                             also been shown to play a role; even with a clear foveal
Peripheral optical errors have been suggested to influence                   image, peripheral hyperopia (i.e. an image behind the ret-
the development of myopia.1,2 This study suggests a meth-                    ina) induces central myopic growth.8 It is likely that a simi-
odology to evaluate the optical effect of multifocal soft con-               lar regulation process takes place in the human eye, though
tact lens designs on the image quality over the peripheral                   the association between relative peripheral hyperopia and
retina. Myopia is the condition in which the refractive                      myopia progression is weak.9 Nevertheless, there is consid-
power of the eye is too strong relative to its length. It is                 erable interest in correction methods that allow manipula-
normally caused by the eye growing too long1–4 and is asso-                  tion of the peripheral image while leaving the foveal image
ciated with increased risk of ocular diseases.5 Currently, the               unaltered. One option currently being tested is to use mul-
prevalence of myopia is increasing, likely due to changes in                 tifocal and bifocal soft contact lenses with a centre distance
the everyday visual environment.1,2,6 Defocus of the retinal                 design.10–16 Two recent studies using lenses with 2 D add
image is one such important environmental factor, as                         have reported a reduction in myopia progression from
demonstrated by animal studies (see e.g. the review by                       0.86 to 0.57 D per year and from 0.69 to 0.44 D per

Ophthalmic & Physiological Optics © 2012 The College of Optometrists                                                                                1
Evaluating peripheral effect of multifocal lenses                                                                           R Rosén et al.

10 months respectively.11,12 In these lenses, the power of      Proclear Multifocal DTM a centre distance design with the
the inner zone corrects for the foveal refractive errors        more positive power in the outer zone of the lens. The
whereas the outer zone power is chosen to be more posi-         multifocal lenses were evaluated both with +1 and +2 diop-
tive. Such lenses are commercially available today, though      tres add. All subjects were measured with lenses that
most of them are not designed to prevent myopia, as they        included their foveal refractive correction. As a baseline,
are marketed towards presbyopic patients. However, inter-       they were also measured without wearing any lens.
est in the research community in these lenses goes beyond          The peripheral optics of the subject’s right eye was evalu-
their marketed purpose, since the more positive outer zone      ated with the new fast scanning Hartmann–Shack sensor
can reduce accommodative lag as well as impose myopia           especially developed for off-axis wavefront measurements
on the peripheral retina and thereby possibly inhibit myo-      at the Laboratory of Optics in Murcia, Spain.19,20 The
pia development. Bifocal and multifocal contact lenses also     sensor has an open field of view and uses near infrared light
have the advantage that they can be manufactured with a         (780 nm) to be as comfortable as possible for the subject.
central (distant) power of zero dioptres and thereby be         The aberrations over the horizontal peripheral field were
worn by emmetropic eyes, who might be at risk of becom-         measured out to ±40° with an angular resolution of 1°. For
ing myopic, as well as by already established myopes.           each lens, four sweeps were made within 7.2 s while the
   However, multifocal designs inevitably affect the quality    subject was stabilised with a chin rest and maintained fixa-
of the image, which might decrease the effective peripheral     tion to a 2° Maltese cross placed at a distance of 2 m. The
image shift of the lens. To our knowledge there is no study     order of the lenses was random. The measurements were
on the full off-axis optical image quality with bifocal or      made in dim light with natural pupils (no cycloplegia) and
multifocal contact lenses, and only one on monofocal            subjects were allowed to blink. The study followed the
lenses.17 Previous investigations on multifocal lenses have     tenets of the Declaration of Helsinki and informed consent
only reported the change in relative peripheral defocus         was obtained from the subjects beforehand.
(RPD, i.e. the difference between foveal and peripheral
refractive state) derived from lower order aberra-
                                                                Data analysis
tions.11,16,18 In the present study we therefore suggest some
additional objective metrics to evaluate the change in          The wavefronts were reconstructed with Zernike coeffi-
peripheral optical quality when wearing multifocal soft         cients21 defined over a circular aperture inscribing the
contact lenses; higher order root mean square wavefront         elliptical pupil (the LC method proposed by Lundström
error (RMS), the normalised area under the modulation           et al.22). To allow comparison, the data for all measure-
transfer function (MTF), the depth of field, as well as the     ments were then shrunk to a pupil diameter of 4 mm,
RPD that optimises the area under the MTF. We apply             which was smaller than the minor pupil diameter of all sub-
these metrics on peripheral wavefront measurements per-         jects (corresponding to the SC method by Lundström
formed over the 80° horizontal field of four subjects wear-     et al.22, algorithms given by Lundström and Unsbo23). No
ing commercially available multifocal soft contact lenses       correction for chromatic aberration was performed. The
with two different add powers and two designs. We are           four sets (one from each sweep) of Zernike coefficients in
especially interested in whether the lenses actually are        each eccentricity for each person and lens were averaged
changing the RPD, whether overall image quality beyond          and the wavefront aberrations were then analyzed in two
defocus is altered, and over which parts of the visual field    different ways:
these effects take place.                                          First, to allow comparison with other studies, we used
                                                                the methodology to calculate defocus directly from the
                                                                second order Zernike   pffiffiffi coefficients (i.e. mean spherical
Methods
                                                                equivalent M = - 4 3  c02 =r2pupil ). This metric minimised
Subjects, contact lenses and measurements                       the RMS of the wavefront over the whole 4 mm circular
Multifocal soft contact lenses were fitted by an experienced    aperture.
optometrist and were worn for 20 min before measurement            However, minimising the RMS is known to be a poor
in the right eye of four subjects; three emmetropes and one     predictor of the subjective refraction, even for foveal mea-
low myope (average on-axis spherical refractive error equal     surements (see e.g. the study by Thibos et al.24). In the
to 0.7 D, ranging from +0.50 to 2.75 D, no cylinder,          periphery, where the aberrations are larger and the pupil is
25–39 years). The subjects were measured with the lenses        elliptical, it is especially useful to determine defocus using
described in Table 1; PureVisionTM a monofocal lens             image quality metrics that correspond with subjective
design with spherical aberration control (i.e. inducing         refraction.25 We therefore also calculated defocus with an
negative c04 ), Proclear Multifocal NTM a centre near design    image quality metric similar to AreaMTF in the study by
with the more positive power in the centre of the lens, and     Thibos et al.24: The MTF out to 10 cycles per degree was

2                                                                      Ophthalmic & Physiological Optics © 2012 The College of Optometrists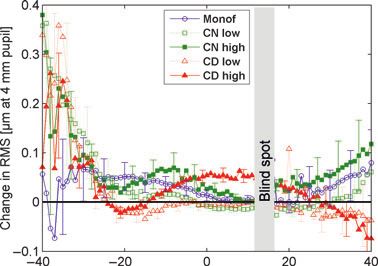
R Rosén et al.                                                                                  Evaluating peripheral effect of multifocal lenses

Table 1. The measured lens designs

Design               Add                    Brand                      Manufacturer       Base curve (mm)       Optical zone (mm)        Material

Monofocal            –                      PureVisionTM               Bausch & Lomb      8.6                   8.9                      Balafilcon A
Centre near          +1.0 and +2.0 D        Proclear Multifocal NTM    Cooper Vision      8.7                   8.5                      Omafilcon A
Centre distance      +1.0 and +2.0 D        Proclear Multifocal DTM    Cooper Vision      8.7                   8.5                      Omafilcon A

calculated using Fourier transformation and then averaged                     abrupt change in the local refractive power and that the
over all orientations. The elliptical shape of the pupil was                  measurement of especially defocus was ambiguous. There
preserved in these calculations (but reduced in scale with                    was no difference between the monofocal and the multifo-
the radius of the major axis equal to 2 mm). The area                         cal lenses in this regard, both showed affected spot patterns
under the one dimensional MTF was then normalised with                        at angles larger than 30°. Thus, defocus results for contact
the diffraction limited case. The value of this metric at best                lens data at the outer periphery should be interpreted with
spherical correction was also used as a measure of the                        caution.
retinal image quality and the depth of field was taken as the
dioptric distance between the limits imposed by the defocus
                                                                              Relative peripheral defocus using traditional RMS metric
that reduced the area to 80% of the maximal area, as
proposed by Marcos.26                                                         As explained in Methods, the level of defocus was first
                                                                              calculated directly from the 2nd order Zernike coeffi-
                                                                              cients and the RPD was found by subtracting the foveal
Results
                                                                              mean spherical equivalent from the peripheral. The RPD
Optical zone limitation                                                       without lens and with the three different lens designs are
To determine at which angle the border of the optical zone                    displayed separately for the four subjects in Figure 2. As
of the contact lens started to degrade the quality of the                     can be seen, the RPD without lens (indicated by black
measurement, manual inspection of the actual spot pattern                     filled circles in Figure 2) followed the well documented
images was performed. An example of the spot patterns at a                    pattern of relative peripheral myopia for the emme-
few measurement angles can be seen in Figure 1. Without                       tropes.1,2,20,22,27,28 The monofocal and multifocal centre
any contact lens, the spot patterns did not show any large                    near designs induced more peripheral hyperopia (or less
irregularities all the way out to ±40° (upper row in                          myopia) compared to the RPD without lens. The largest
Figure 1). With a contact lens worn, the patterns were gen-                   shift, up to 2 D, was obtained with the centre near lens
erally fine out to 20°30° in the nasal visual field, and out                 with high add. The only lens that gave an RPD slightly
to 30°40° in the temporal visual field. For larger angles                    more myopic than that without lens was the centre dis-
the border of the optical zone of the lens caused a larger                    tance design with high add; it induced peripheral myopia
displacement of some spots (indicated by the arrows in the                    of about 0.5 D in the nasal visual field, with an even
lower row of Figure 1). This means that there was an                          smaller shift on the temporal side.

Figure 1. Spot pattern without (top) and with (bottom) a multifocal centre near soft contact lens. Optical zone limit indicated by arrows.

Ophthalmic & Physiological Optics © 2012 The College of Optometrists                                                                                3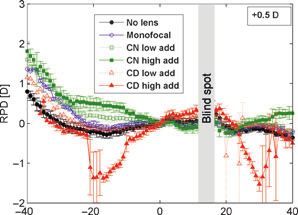
Evaluating peripheral effect of multifocal lenses R Rosén et al.
(a) (b)
(c) (d)
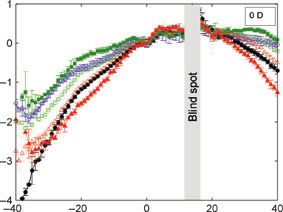
Figure 2. Relative peripheral defocus (RPD) with and without soft contact lenses over the horizontal field of view shown separately for the four sub-
jects (the foveal refraction of each subject is given in the upper right corner of each graph). The RPD presented here is calculated to minimize the RMS
error of the wavefront. Angles are given relative to the line of sight. Six different types of correction are shown: without lens (indicated by black filled
circles), monofocal contact lens (blue open circles), multifocal contact lens with a low add centre near (CN) design (green open squares), multifocal
contact lens with a high add CN design (green filled squares), multifocal contact lens with a low add centre distance (CD) design (red open triangles),
and multifocal contact lens with a high add CD design (red filled triangles). The error bars indicate the standard deviation of the four scans made by
the wavefront sensor.
field and 25° in the temporal visual field, the optimised
Relative peripheral defocus with an image quality metric
defocus became more hyperopic both with and without
using the elliptical shape of the pupil
lens, which is why the change in RPD was similar for
To get a better estimation, defocus was also found by both metrics.
choosing the spherical correction that optimised the area
under the MTF curve. Similar to Figure 2, Figure 3
Peripheral image quality with best spherical correction
shows the RPD without lens and with the three different
lens designs separately for the four subjects, but now When evaluating the higher order RMS wavefront error,
calculated from this optimised sphere. As can be seen, a decrease in the peripheral image quality at best spheri-
the change in RPD with lenses compared to the eye cal correction was found with contact lenses, compared
without lens was similar for both metrics. In Figure 3, to the naked eye, as can be seen in the upper graph of
the relative peripheral myopic effect of the centre dis- Figure 4. This effect was mainly due to the multifocal
tance design showed larger fluctuations in optimised design, which gave an increase in the Zernike coefficient
defocus over the visual field, reflecting the ambiguity of for horizontal coma (up to 1 lm larger for a 4 mm
defining the far point. Table 2 shows the difference pupil at 35° in the nasal visual field). However, as
between the mean spherical equivalent obtained by the mentioned in Methods the RMS error and Zernike coef-
image quality metric and by minimising the RMS error ficients are poor predictors of image quality, particularly
at various intervals over the visual field with the different in these peripheral measurements through multifocal
lenses. The foveal difference between RMS and optimised lenses. To achieve a better estimate of the retinal image
defocus was small, but beyond 15° in the nasal visual quality, we therefore used the same image quality metric
4 Ophthalmic & Physiological Optics © 2012 The College of Optometrists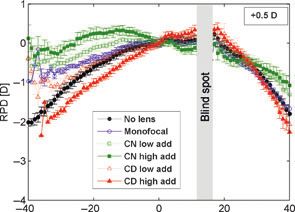
R Rosén et al. Evaluating peripheral effect of multifocal lenses
(a) (b)
(c) (d)
Figure 3. Relative peripheral defocus (RPD) with and without soft contact lenses over the horizontal field of view shown separately for the four sub-
jects (the foveal refraction of each subject is given in the upper right corner of each graph). The RPD presented here is calculated to optimise the area
under the MTF-curve. The six different types of correction and the error bars are the same as in Figure 2.
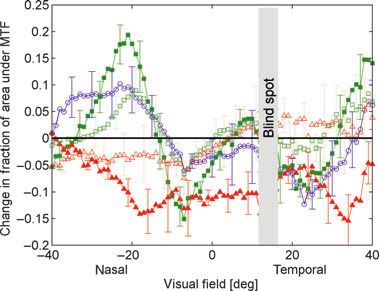
with the area under the MTF curve as described earlier. increased slightly with all lenses. On the other hand, in the
The lower graph of Figure 4 shows the change with periphery beyond 10° in the nasal visual field we found a
lenses in area under the MTF averaged for all subjects at difference between the high add centre distance design and
optimal defocus. The high add centre distance design the other designs; the depth of field increased with as much
decreased the peripheral image quality at optimal as 0.9 D (at 20° nasally) for the centre distance lens with
defocus, whereas the other lens designs maintained or high add compared to without lens, whereas the other
even increased the quality at best defocus slightly. The designs maintained or even diminished the depth of field.
increase was due to the negative spherical aberration
induced by these lenses, which compensated for the
Discussion
positive spherical aberration of the eye.
The Hartmann–Shack wavefront sensor provided reliable
measurements of the peripheral aberrations with contact
Peripheral depth of field
lenses on the eye. Additionally, it was possible to see the
Objective quantification of the magnitude of the depth of presumed border of the optical zone in the raw spot pattern
field is highly dependent on the chosen metric. Neverthe- (as shown in Figure 1), which is not always possible with
less, a relative change in depth of field with the different the reconstructed wavefront data as, e.g., pupil size or Zer-
lenses is still of interest, as it is indicative of a real change in nike coefficients. This manual check is an advantage of the
depth of field. As described in Methods, the depth of field Hartmann–Shack technique over other techniques to mea-
was calculated as the amount of defocus needed to reduce sure the peripheral refraction through contact lenses, such
the area under the MTF curve by 20%. Total depth of field as Shin-Nippon autorefractors and photorefraction.29
was taken as the sum of the negative and positive depth of The tested contact lenses had an optical zone of around
field. Figure 5 shows the total depth of field of each contact 8.5 mm, which proved to be too small for off-axis angles
lens averaged across subjects. Foveally, the depth of field larger than about 30°, even for the monofocal lens. This
Ophthalmic & Physiological Optics © 2012 The College of Optometrists 5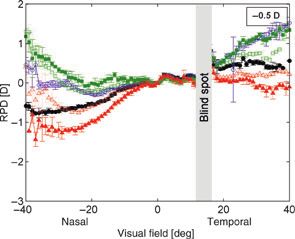
Evaluating peripheral effect of multifocal lenses                                                                                                 R Rosén et al.

Table 2. Mean difference ± standard deviation in dioptres between the mean spherical equivalent obtained by optimising the area under the MTF
and by minimising the RMS error at different angle intervals. A positive difference means that the optimised refraction was more hyperopic than the
RMS refraction. The angle intervals are given by the limiting angles (minimum and maximum), separated by a colon, negative angles indicate the nasal
visual field

Difference for          35°:25°            25°:15°           15°:5°                5°:5°               5°:15°              15°:25°             25°:35°

No lens                 1.3   ±   0.4        0.5   ±   0.3        0.0   ±    0.1          0.0   ±   0.0       0.0   ±   0.1       0.1   ±   0.1       0.3   ±   0.4
Monofocal               0.9   ±   0.3        0.2   ±   0.2        0.0   ±    0.1          0.0   ±   0.0       0.0   ±   0.0       0.0   ±   0.2       0.3   ±   0.4
Centre near             0.4   ±   0.6        0.1   ±   0.3       0.1   ±    0.2         0.1   ±   0.1       0.0   ±   0.0       0.0   ±   0.2       0.4   ±   0.5
Centre distance         1.3   ±   0.6        0.4   ±   0.6       0.1   ±    0.2          0.0   ±   0.1       0.1   ±   0.1       0.1   ±   0.1       0.2   ±   0.5

(a)

(b)
                                                                                   Figure 5. Change in depth of field with the different lens designs com-
                                                                                   pared to the uncorrected eye, given as the full range from the hyperopic
                                                                                   to the myopic threshold, averaged for all subjects. The five different
                                                                                   types of correction shown are the same as in Figure 4. The error bars
                                                                                   indicate the standard error of mean and are plotted for every fifth
                                                                                   angle.

                                                                                   limit of about 30° was confirmed by a simple calculation;
                                                                                   the contact lens is located approximately 3 mm in front of
                                                                                   the entrance pupil of the eye and if we assume that the lens
                                                                                   and the pupil are aligned, 30° off-axis means that the pro-
                                                                                   jection of the entrance pupil on the contact lens will be
                                                                                   shifted by 1.7 mm (3*tan 30°). The projection of a 5 mm
                                                                                   entrance pupil will therefore touch the edge of the optical
                                                                                   zone for a contact lens with 4.25 mm zone radius (5/
Figure 4. Estimates of the change in peripheral image quality with the
                                                                                   2 + 1.7 is 4.2 mm). This together with some displacement
different lens designs compared to the uncorrected eye. Upper graph:               of the lens compared to the line of sight could explain why
higher order RMS wavefront error averaged for all subjects. Lower                  the optical zone edge was visible in our measurements.
graph: normalised area under MTF out to 10 cycles per degree at opti-              Since results from animal studies give us no reason to
mal defocus compared to the diffraction limited case averaged for all              believe that the peripheral control of the emmetropisation
subjects. Five different types of correction are shown: monofocal con-             process should be limited to the central 60° of the visual
tact lens (blue open circles), multifocal contact lens with a low add cen-
                                                                                   field,1,2 it would probably be an advantage to enlarge the
tre near (CN) design (green open squares), multifocal contact lens with
a high add CN design (green filled squares), multifocal contact lens with
                                                                                   optical zone of the lens. Note that a small optical zone rep-
a low add centre distance (CD) design (red open triangles), and multifo-           resented not just a technical metrology problem; it also
cal contact lens with a high add CD design (red filled triangles). The             introduced large image degradation in the outer periphery.
error bars indicate the standard error of mean and are plotted for every              Quantifying the refractive error from the reconstructed
fifth angle.                                                                       wavefront is not a simple or unambiguous task. The

6                                                                                           Ophthalmic & Physiological Optics © 2012 The College of Optometrists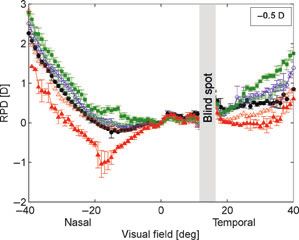
R Rosén et al.                                                                        Evaluating peripheral effect of multifocal lenses

current study included two metrics: minimising the RMS                 design with high add (red filled triangles) in the lower
error and optimising the area under the MTF. Both metrics              graph of Figure 4 with that in Figure 5.
showed that the multifocal contact lenses with a centre dis-
tance design indeed induced peripheral myopia, while a                 Conclusions
centre near design gave a hyperopic shift in the periphery.
For our subjects, the two metrics agreed in RPD in the cen-            The recommendation of this study is to use image quality
tral part of the visual field but differed in the outer periph-        metrics when analysing the peripheral optical effect of mul-
ery, beyond 15° in the nasal visual field, with the RMS                tifocal soft contact lenses, as they provide a more complete
refraction giving a systematically more myopic estimation              description of the change in retinal image quality than the
of the refractive error. Although the refraction given by the          refraction and RMS error calculated directly from the Zer-
two metrics differed substantially in the periphery, this dif-         nike coefficients. For the four studied subjects we found
ference was similar both without and with wearing contact              that the centre distance design with 2 D add gave a minor
lenses, and therefore the change in RPD induced by the                 myopic shift in the periphery out to about 30° off-axis, as
lenses estimated by the two metrics was also similar (com-             the optical zone limit of the lens severely degraded the
pare Figures 2 and 3).                                                 image quality in larger eccentricities. However, the image
   In the current study on four subjects the low add lens              quality was also reduced for the near periphery due to the
designs had no effect (centre distance lens) or an effect very         extra aberrations induced by the lens. Actually, the increase
similar to the monofocal lens (centre near lens). Even with            in peripheral depth of field with this lens (estimated from
the higher add of 2 D the amount of induced relative                   wavefront measurements) was of the same order of magni-
peripheral myopia by the lens with centre distance design              tude as the peripheral myopic shift induced by the centre
was small, only around 0.5 D, in agreement with Lopes-                 distance design. If these results hold true also in a larger
Ferreira et al.16 The centre near design had a larger and              population, the peripheral myopic shift induced by this lens
hyperopic effect on the RPD, as had the monofocal lens                 design is probably too small to explain a possible treatment
because of its negative spherical aberration (note that                effect on myopia progression.
monofocal spherical lenses with negative power have
instead been found to have a myopic effect on the                      Acknowledgements
RPD18,30). Nevertheless, two recent studies found a reduc-
tion in myopia progression close to 0.3 D per year using a             This work was in part presented at the annual meeting of
centre distance design and 2 D add in one multifocal lens              the Association for Research in Vision and Ophthalmology
and one bifocal lens respectively.11,12 However, it is not             (ARVO), presentation no. 4373 ‘Influence of Commercial
fully understood whether it was the reduction of peripheral            Soft Multifocal Contact Lenses on Peripheral Refraction
hyperopia that caused the reduced myopia progression, or               and Aberrations’ May 4, 2011. This work was supported by
if other factors might have compounded the outcome. In a               the Swedish Agency for Innovation Systems (VINNMER
study that followed myopia progression without any                     2008-00992); the Ministerio de Educación y Ciencia’, Spain
peripheral treatment, Mutti et al.9 found that each dioptre            (grant FIS2007-64765 and CONSOLIDER-INGENIO 2010,
of peripheral hyperopia exacerbated myopia progression                 CSD2007-00033 SAUUL); Fundación Séneca (Region de
with 0.024 D per year. Assuming that this is the case also            Murcia, Spain), grant 4524/GERM/06; and by European
for lenses, 2 D add only explains one-sixth of the reduced             Commission’s sixth framework program through the Marie
myopia progression in the studies using bifocal or multifo-            Curie Research Training Network MY EUROPIA (MRTN-
cal contact lenses.11,12 Furthermore, as indicated by our              CT-2006-034021).
results, the actual influence on peripheral refractive errors
is less than the maximal add.                                          References
   To our knowledge, this study is the first to also assess the
                                                                        1. Charman WN & Radhakrishnan H. Peripheral refraction
peripheral higher order aberrations induced by multifocal                  and the development of refractive error: a review. Ophthal-
contact lenses. We used the traditional RMS error, the area                mic Physiol Opt 2010; 30: 321–338.
under the MTF, and the objective depth of field to quantify             2. Wallman J & Winawer J. Homeostasis of eye growth and the
the retinal image quality. The area under the MTF showed                   question of myopia. Neuron 2004; 43: 447–468.
that the centre distance design with high add gave a much               3. Atchison DA, Jones CE, Schmid KL et al. Eye shape in
larger reduction in image quality compared to what was                     emmetropia and myopia. Invest Ophthalmol Vis Sci 2004;
found when only evaluating the RMS error. This reduction                   45: 3380–3386.
in image quality resulted in an increase in peripheral depth            4. Logan NS, Gilmartin B, Wildsoet CF & Dunne MC. Poster-
of field, at some angles by up to 50%, which can be clearly                ior retinal contour in adult human anisomyopia. Invest
seen when comparing the results for the centre distance                    Ophthalmol Vis Sci 2004; 45: 2152–2162.

Ophthalmic & Physiological Optics © 2012 The College of Optometrists                                                                  7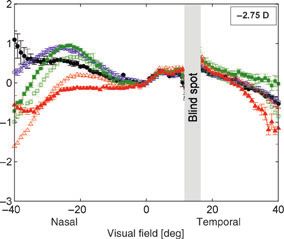
Evaluating peripheral effect of multifocal lenses                                                                                  R Rosén et al.

 5. Saw SM, Gazzard G, Chan Shih-Yen E & Chua WH. Myopia              18. Shen J, Clark CA, Soni PS & Thibos LN. Peripheral refrac-
    and associated pathological complications. Ophthalmic                 tion with and without contact lens correction. Optom Vis Sci
    Physiol Opt 2005; 25: 381–391.                                        2010; 87: 642–655.
 6. Morgan I & Rose K. How genetic is school myopia? Prog             19. Jaeken B, Lundström L & Artal P. Fast scanning peripheral
    Retin Eye Res 2005; 24: 1–38.                                         wave-front sensor for the human eye. Opt Express 2011; 19:
 7. Wildsoet CF. Active emmetropization – evidence for its                7903–7913.
    existence and ramifications for clinical practice. Ophthalmic     20. Jaeken B & Artal P. Optical quality of emmetropic and myo-
    Physiol Opt 1997; 17: 279–290.                                        pic eyes in the periphery measured with high-angular resolu-
 8. Smith EL, Hung LF & Huang J. Relative peripheral hyper-               tion. Invest Ophthalmol Vis Sci 2012; 53: 3405–3413.
    opic defocus alters central refractive development in infant      21. American National Standards Institute. Methods for report-
    monkeys. Vision Res 2009; 49: 2386–2392.                              ing optical aberrations of eyes. ANSI Z80.28–2004.
 9. Mutti DO, Sinnott LT, Mitchell GL et al. Relative peripheral      22. Lundström L, Gustafsson J & Unsbo P. Population distribu-
    refractive error and the risk of onset and progression of myo-        tion of wavefront aberrations in the peripheral human eye. J
    pia in children. Invest Ophthalmol Vis Sci 2011; 52: 199–205.         Opt Soc Am A 2009; 26: 2192–2198.
10. Lee D. Current methods of myopia control: a literature            23. Lundström L & Unsbo P. Transformation of Zernike coeffi-
    review and update. J Behav Optom 2009; 20: 87–93.                     cients: scaled, translated, and rotated wavefronts with circu-
11. Sankaridurg P, Holden B, Smith E et al. Decrease in rate of           lar and elliptical pupils. J Opt Soc Am A 2007; 24: 569–577.
    myopia progression with a contact lens designed to reduce         24. Thibos LN, Hong X, Bradley A & Applegate RA. Accuracy
    relative peripheral hyperopia: one-year results. Invest               and precision of objective refraction from wavefront aberra-
    Ophthalmol Vis Sci 2011; 52: 9362–9367.                               tions. J Vis 2004; 4: 329–351.
12. Anstice NS & Phillips JR. Effect of dual-focus soft contact       25. Lundström L, Gustafsson J, Svensson I & Unsbo P. Assess-
    lens wear on axial myopia progression in children. Ophthal-           ment of objective and subjective eccentric refraction. Optom
    mology 2011; 118: 1152–1161.                                          Vis Sci 2005; 82: 298–306.
13. Tarrant J, Severson H & Wildsoet CF. Accommodation in             26. Marcos S, Barbero S & Jiménez-Alfaro I. Optical quality and
    emmetropic and myopic young adults wearing bifocal soft               depth-of-field of eyes implanted with spherical and aspheric
    contact lenses. Ophthalmic Physiol Opt 2008; 28: 62–72.               intraocular lenses. J Refract Surg 2005; 21: 223–235.
14. Aller TA & Wildsoet C. Bifocal soft contact lenses as a possi-    27. Lundström L, Mira-Agudelo A & Artal P. Peripheral optical
    ble myopia control treatment: a case report involving identi-         errors and their change with accommodation differ between
    cal twins. Clin Exp Optom 2008; 91: 394–399.                          emmetropic and myopic eyes. J Vis 2009; 9: 17.
15. Aller TA & Wildsoet C. Results of a one-year prospective          28. Atchison DA, Pritchard N & Schmid KL. Peripheral refrac-
    clinical trial (CONTROL) of the use of bifocal soft contact           tion along the horizontal and vertical visual fields in myopia.
    lenses to control myopia progression. Ophthalmic Physiol              Vision Res 2006; 46: 1450–1458.
    Opt 2006; 26 (Suppl 1): 8–9.                                      29. Fedtke C, Ehrmann K & Holden BA. A review of peripheral
16. Lopes-Ferreira D, Ribeiro C, Maia R et al. Peripheral myop-           refraction techniques. Optom Vis Sci 2009; 86: 429–446.
    ization using a dominant design multifocal contact lens. J        30. Kwok E, Patel B, Backhouse S & Phillips JR. Peripheral
    Optom 2011; 4: 14–21.                                                 refraction in high myopia with spherical soft contact lenses.
17. Shen J & Thibos LN. Peripheral aberrations and image quality          Optom Vis Sci 2012; 89: 263–270.
    for contact lens correction. Optom Vis Sci 2011; 88: 1196–1205.

8                                                                             Ophthalmic & Physiological Optics © 2012 The College of Optometrists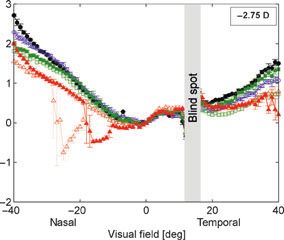
You can also read