Water Quality Report 2021 | Based on data collected in 2020 - Norfolk.gov
←
→
Page content transcription
If your browser does not render page correctly, please read the page content below

Water Quality
Report
 2021 | Based on data collected in 2020

TRUSTED-EXCELLENCE & VALUE
Once again, Norfolk tap water met or
exceeded quality and health standards.

Norfolk Department of Utilities 2020 Drinking Water Quality Results                                www.norfolk.gov/utilities

  A Message from your Water Utility

  The City of Norfolk Department of                      Sharing This Report
  Utilities is committed to providing                    Please share this report with all people who drink this water,
  residents and businesses throughout                    especially those who may not have received this notice directly
  the city with top-quality water service.               (for example, people in apartments, nursing homes, schools and
                                                         businesses). You can do this by posting this notice in a public
  Once again in 2020, Norfolk tap                        place or distributing copies by hand or mail. To receive a printed
  water met all federal and state                        copy of this report, please call 664-6701 or email
  requirements.                                          utpublicinfo@norfolk.gov.

  Utilities' employees are on call 24
  hours a day, 365 days a year to ensure                 People with Special Health Concerns
  that you always have access to healthy                 Some people may be more vulnerable to contaminants in
  Norfolk drinking water. The Water                      drinking water than the general population. Immuno-
  Quality Report is distributed annually                 compromised persons, such as persons with cancer undergoing
  to inform our customers that we are                    chemotherapy, persons who have undergone organ transplants,
  meeting all water quality guidelines set               people with HIV/AIDS and other immune system disorders,
  forth by the Environmental Protection                  some elderly and infants can be particularly at risk from
  Agency.                                                infections. These individuals should seek advice about drinking
                                                         water from their health care providers.
  For questions regarding this report,
  contact the Norfolk Water Quality Lab       U.S. Environmental Protection Agency (EPA)/Centers for
  at 757-441-5678. For more information       Disease Control (CDC) guidelines on appropriate means to
  about decisions affecting your drinking     lessen the risk of infection by Cryptosporidium and other
  water quality, you may attend               microbial contaminants are available from the Safe Drinking
  Norfolk city council meetings. For          Water Hotline: (800) 426-4791.
  times and agendas, call the city
  clerk's office at 757-664-4253 or visit
  www.norfolk.gov.
  Este informe contiene información muy importante sobre el agua potable que consume. Si tiene alguna
  pregunta sobre este informe, comuníquese con el Departamento de Servicios Públicos al (757) 441-5678..

         Norfolk Department of Utilities is an active member of:

                                                                                                                               Page | 2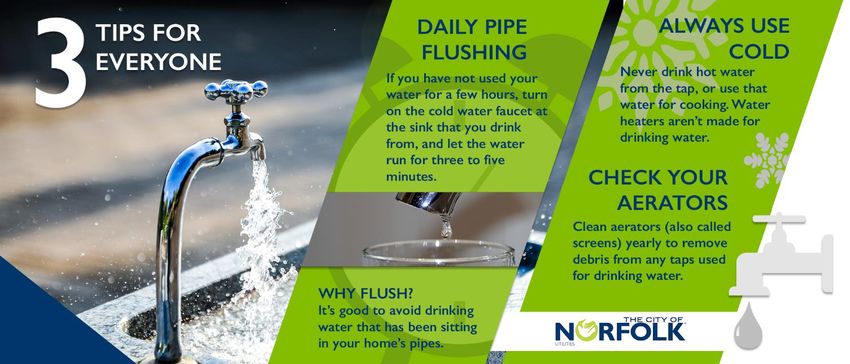
Norfolk Department of Utilities 2020 Drinking Water Quality Results www.norfolk.gov/utilities
Where Does Norfolk's Drinking Water Come From?
Norfolk obtains its raw (untreated) water from eight reservoirs, two rivers and four deep wells. The map
below shows the location of each of your water sources. From these sources, raw water is pumped to one of
the Department of Utilities' two water treatment plants, where it is filtered and disinfected. Once tested to
meet water quality standards, Norfolk drinking water is pumped on demand to your tap.
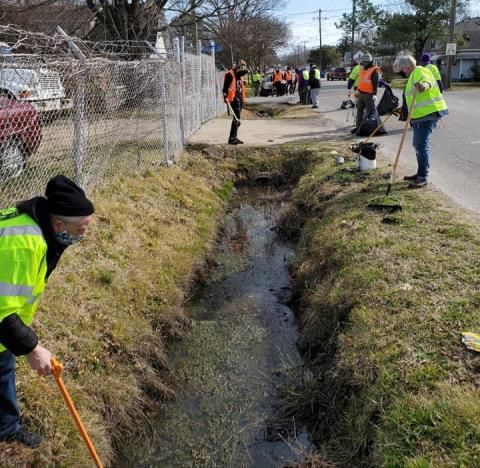
Safeguarding the Water You Drink
The protection of our water resources,
including our drinking water reservoirs, is
directly related to how we manage and
protect the land around them. The water in
the reservoirs comes from direct rainfall, but it
also comes from the water that falls in the
drainage area or watershed. This water flows
across streets and driveways, off rooftops,
across manicured lawns, through gardens and
may finally enter the reservoir or lake through
a storm pipe or ditch.
As the water travels across all of these areas it picks
up pollutants - fertilizers, oil, gasoline, soda cans,
paper cups, pet waste. Each of these pollutants can
have a negative impact on the water, from
something as simple as floating litter to more
complicated issues that affect wildlife and water
quality.
The land the water flows across on this journey
and the waterways that receive it are called a
watershed. Visit AskHRGreen.org for more
information.
Page | 3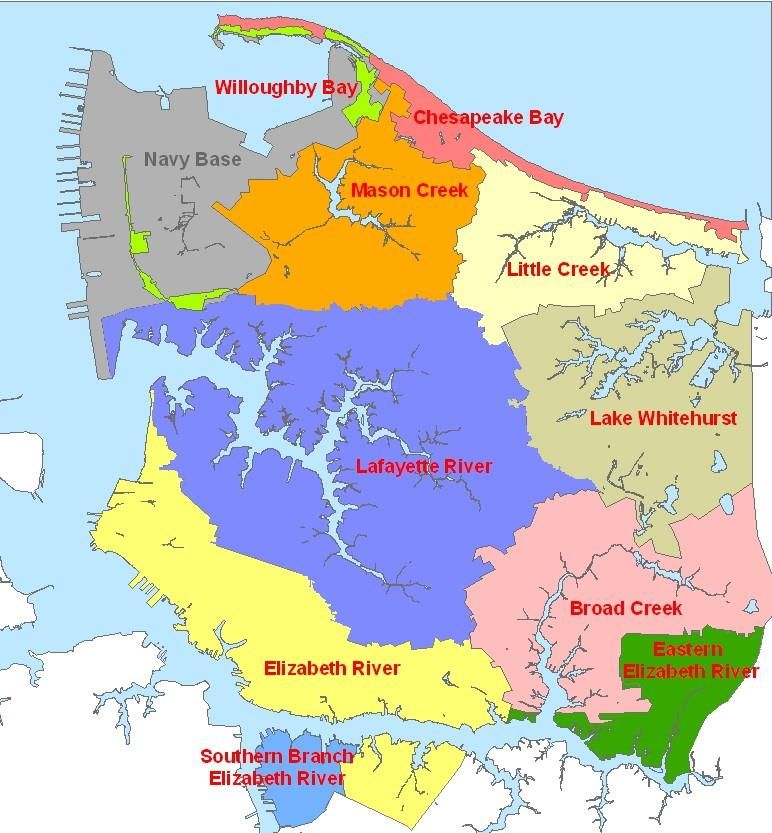
Norfolk Department of Utilities 2020 Drinking Water Quality Results                               www.norfolk.gov/utilities

  Committed to Quality. Committed to You.

                                                                  Chlorine – A little goes a long way.

                                                                  Chlorination is a method
                                                                  used to disinfect water.
                                                                  This method was used
                                                                  over a century ago and
                                                                  is still used today!

                                                                      Microorganisms are
                                                                      found in raw (untreated)
                                                                      water from rivers, lakes,
                                                                      and groundwater. Not
                                                                      all microorganisms are
                                                                      harmful to human
                                                                      health, but some could
  The Norfolk Department of Utilities                                 cause diseases in
  consistently produces high-quality                                  humans. These are
  drinking water that achieves state                                  called pathogens, and
  and federal water quality                                           they can cause
  requirements.                                                       waterborne diseases.

  In 2019, the newly named Kristen M. Lentz (37th                     State and federal laws
  St.) and Moores Bridges (MB) Water Treatment                        require the disinfection
  Plants earned Virginia Water Treatment Plant                        of the water supply, and
  Performance awards. This award is given to                          the EPA and health
  water plants that meet stringent standards for                      organizations consider
  filtration process control and water clarity and                    chlorination as one of
  demonstrate excellence in their day-to-day                          the best methods to
  operations. MB received a silver award for six                      combat these potential
  consecutive years of achieving these standards,                     waterborne diseases.
  and 37th St. received a bronze for three straight
  years of excellence.                                                Chlorination protects
                                                                      your water as it travels
  MB also received the Hampton Roads Sanitation                       from our treatment
  District (HRSD) Pretreatment Excellence and                         plants to your home and
  Pollution Prevention Platinum Award for six                         ensures your water is
  consecutive years of exemplary permit                               safe and healthy to drink
  compliance and outstanding pollution                                whenever you need it!
  prevention. The U. S. Environmental Protection
  Agency (EPA) has recognized HRSD's
  pretreatment program as one of the nation's                     Our scientists work around-the-clock to
  best. Norfolk's efforts focus on reducing waste
  (or its toxicity) at the source and before its
                                                                  ensure our drinking water is top-quality.
  water plants discharge into HRSD's system. This                 Each month over 7,250 laboratory tests are
  helps to protect waterways and other natural                    completed.
  resources.

                                                                                                                       Page | 4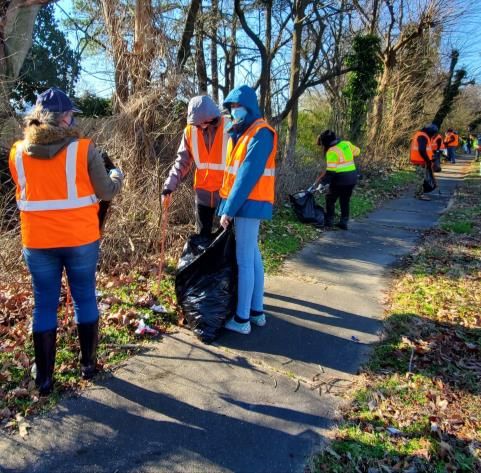
Norfolk Department of Utilities 2020 Water Quality Results                                      www.norfolk.gov/utilities

Lead in a Property's Plumbing - The drinking water delivered
to your home meets all state and federal water quality standards.
 How We Manage Lead
 Our chemists continuously monitor drinking
 water to ensure our treatment helps keep
 lead out of water in buildings with lead
 plumbing. Every three years, Norfolk
 samples at least 50 homes for lead levels.
 These samples are a required part of the
 EPA's Lead and Copper Rule, which was
 created in 1992, to make sure that our
 corrosion control treatment is working.
 Required by Federal law, Norfolk's corrosion
 control program has been in place for over
 three decades. It minimizes the release of
 lead from service lines, indoor pipes, fixtures,
 and solder by creating a coating designed to
 keep lead from leaching into the water.

 To date, sampling results show that
 our treatment is controlling corrosion
 in our customers' plumbing.

 Lead Testing
 The Norfolk Department of Utilities                             Concerned About Lead In Your Pipes?
 conducted a regulatory lead testing program                 If you are concerned about lead in your water, you may wish
 from June through September 2020. Results                   to have your water tested. Information on lead in drinking
 from the 2020 round of testing show Norfolk                 water, testing methods, and steps you can take to minimize
 complies with the federal Lead and Copper                   exposure is available from the Safe Drinking Water Hotline at
 Rule and can be found in the table on page 8.               (800) 426- 4791 or www.epa.gov/safewater/lead.

Page | 5
Norfolk Department of Utilities 2020 Drinking Water Quality Results                              www.norfolk.gov/utilities

  Monitoring Water Quality: What Do We Look For?
  Drinking water sources (both tap              urban storm water runoff, industrial    Norfolk's susceptibility has been
  water and bottled water) include              or domestic wastewater discharges,      rated high. Norfolk's water
  rivers, lakes, streams, ponds,                oil and gas production, mining, or      treatment process ensures you
  reservoirs, springs, and wells. As            farming.                                receive high-quality treated tap
  water travels over the surface of                                                     water that meets all Federal Safe
  the land or through the ground, it            • Pesticides and herbicides, which      Drinking Water Act requirements.
  dissolves naturally-occurring                 may come from a variety of              For a copy of this study, contact
  minerals, and in some cases,                  sources such as agriculture, urban      Norfolk's Water Quality Lab at
  radioactive material. It can also pick        storm water runoff, and residential     757-441-5678.
  up substances resulting from the              uses.
  presence of animals or human                                                          To ensure that tap water is safe
  activity.                                     • Radioactive contaminants, which       to drink, the EPA prescribes
                                                can be naturally occurring or be the    regulations that limit the amount
  Contaminants that may be present              result of oil and gas production and    of certain contaminants in water
  in source (raw) water include:                mining activities.                      provided by public water systems.
                                                                                        FDA regulations establish
  • Microbial contaminants, such as             In 2001 the Hampton Roads               limitations for contaminants in
  viruses and bacteria, which may               Planning District Commission            bottled water which must provide
  come from sewage treatment                    conducted a study on all the raw        the same protection for public
  plants, septic systems, agricultural          water sources in the area, including    health. Drinking water, including
  livestock operations, and wildlife.           Norfolk's, to determine the             bottled water, may reasonably
                                                susceptibility of reservoirs, rivers,   contain slight (trace) amounts of
  • Inorganic contaminants, such as             and wells to contamination.             some contaminants. The presence
  salts and metals, which can be                                                        of contaminants does not
  naturally occurring or result from                                                    necessarily indicate that water
                                                                                        poses a health risk.

                                Your Water Meets All Standards!
      The EPA and Virginia Department of Health water quality standards guide the craftsmanship of Norfolk tap
      water. And once again in 2020, Norfolk tap water met or exceeded those standards.

      Nearly 87,000 annual water quality tests were conducted at reservoirs, treatments plants, homes and
      throughout the distribution system. None of the tests reported elevated levels of substances identified by
      drinking water standards as potentially harmful to public health.

                                                           0 Health and Quality Violations
                                                           16     Substances detected but within limits

                                                          120 Additional substances tested for but not found
                                                 And Water Hardness is Just right!
                                                 Water hardness is not a health hazard, but it can be a nuisance.
                                                 Norfolk’s water averages in the range between soft and slightly hard.
                                                 This means there is enough hardness for soaps and detergents to work
                                                 properly, yet not too much to interfere with most applications.

                                                                                                                      Page | 6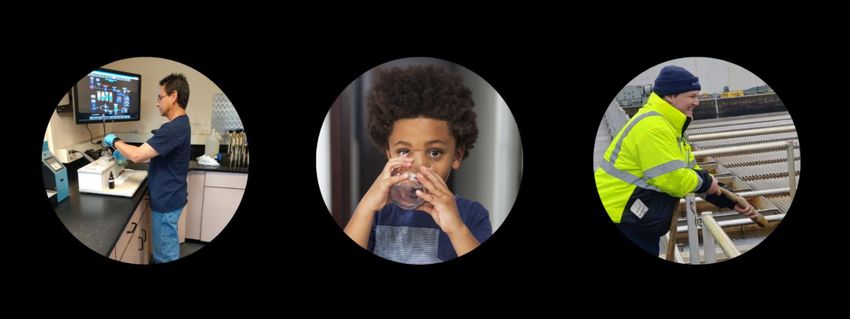
Norfolk Department of Utilities 2020 Drinking Water Quality Results                                         www.norfolk.gov/utilities

 CY2020 Consumer Confidence Report Data
 Below are items we test for in drinking water. These samples were taken in 2020.
 Regulated Substances
                                          Norfolk’s       Norfolk’s     Norfolk’s     National National                      Meets
    Substance        Likely Source        Measured        Highest       Average        MCL      MCLG              Unit        EPA
                                           Range           Level         Level                                             Standards
    Atrazine        Agricultural
                    Runoff            ND – 0.07              0.07          ND              3          3            ppb         ✓
    Barium          Erosion of
                    natural deposits 0.03 – 0.05             0.05          0.03            2          2           ppm          ✓
    Chloramine      Drinking water
                    disinfectant       1.5 – 4.2            3.4 1          3.3           42          43           ppm          ✓
    Fluoride        Added to
                    prevent tooth      0.1 – 0.9            0.7 4           0.6            4          4           ppm          ✓
                    decay
    Gross Beta      Erosion of
                    natural deposits
                                           3                   3             3          50 5          0           pCi/L        ✓
    Nitrate as      Erosion of
    Nitrogen        natural deposits, 0.04 – 0.28            0.28          0.16          10          10           ppm          ✓
                    runoff
       1 Highest quarterly average for calendar year 2 MRDL 3 MRDLG 4 Highest monthly average for calendar year
                             5 EPA considers 50 pCi/L to be the level of concern for Beta particles

    Substance          Likely Source        Percent Removal1           Range        National    National Unit            Meets EPA
                                                                                     MCL        MCLG                     Standards
    Total             Occurs                    53% removal           45 – 68
    Organic           naturally in the                                percent         TT            n/a          %           ✓
                      environment           (45% is required)         removal
    Carbon
                                             1 Running Annual Average, calculated quarterly

                                         Norfolk's Norfolk's Norfolk's Highest      Quarterly
                                          Range      Average                    Running Annual
                                                                Quarterly                               Meets
                                                      Level Locational Running      Average
    Substance             Likely                                                                         EPA
                                                                               National National Unit
                          Source         (Individual Results) Annual Average                          Standards
                                                                                MCL      MCLG
    Haloacetic Acids Disinfection
    (HAA5)           process              19 – 34         26                31                 60           0        ppb        ✓
                     byproduct
    Trihalomethanes Disinfection
    (TTHM)           process              29 – 57         45                48                 80           0        ppb        ✓
                     byproduct
 Turbidity
                                 Norfolk's Lowest      Norfolk's                                                              Meets
    Substance    Likely         Monthly % of Samples   Highest               National MCL           National      Unit         EPA
                 Source            Meeting Limit     Level (NTUs)                                   MCLG                    Standards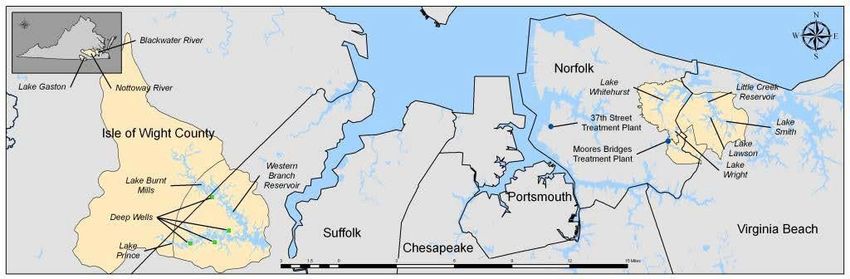
Norfolk Department of Utilities 2020 Drinking Water Quality Results                                   www.norfolk.gov/utilities
 Lead and Copper in Customers' Homes (data from 2020 triennial sampling)
 Norfolk has extremely low lead levels in its drinking water system. Because of this, the EPA has placed Norfolk on
 a reduced monitoring schedule. No lead was detected at the monitoring level during this monitoring period.1
                                   Norfolk's      Norfolk Homes      National                             Meets
                                                                      Action                   National    EPA
     Substance Likely Source       Results1 Exceeding Action                          Unit     MCLG Standards
                                                       Level          Level
                    Household
     Lead           plumbing                < 2.5              0              15              ppb           0            ✓
                    corrosion
                    Household
     Copper         plumbing                0.09               0             1.3              ppm          1.3           ✓
                    corrosion
    1Lead and copper compliance is measured at the 90th percentile of all samples taken during the triennial sampling period.

 If present, elevated lead levels can cause serious health problems, especially for pregnant women and young children.
 Lead in drinking water is primarily from materials and components associated with service lines and home plumbing. The
 Norfolk Department of Utilities is responsible for providing high-quality drinking water but cannot control the variety of
 materials used in plumbing components. When your water has been sitting for several hours, you can minimize the
 potential for lead exposure by flushing your tap for 30 seconds to 2 minutes before using water for drinking or cooking.
 If you are concerned about lead in your water, you may wish to have your water tested. Information on lead in drinking
 water, testing methods, and steps you can take to minimize exposure are available from the Safe Drinking Water Hotline
 (800) 426-4791- http://www.epa.gov/safewater/lead.
 Secondary and Unregulated Monitored Substances
                                                                                    Norfolk's Norfolk's
                                                                       Norfolk's                        National
     Substance         Likely Source                                                Highest Average                        Unit
                                                                        Range                  Level     SMCL
                                                                                     Level
     Aluminum          Erosion of natural deposits; also from
                       use of chemicals at water treatment            0.01 – 0.05      0.05         0.02         0.20      ppm
                       plant
     Chloride          Natural in environment                          12 – 21          21          16           250       ppm
     Foaming
     Agents            Natural in environment                           5 – 13          13           7           500       ppb

     Iron              Natural in environment                         ND – 0.04        0.04         ND           0.3       ppm
     pH                Adjusted during water treatment                                                                      pH
                       process                                         7.4 –7.9        7.71         7.7      6.5 – 8.5
                                                                                                                           units
     Sodium            Natural in environment; also from use
                       of chemicals at water treatment plant           10 – 22          22          14           n/a2      ppm

     Sulfate           Natural in environment; also from use
                       of chemicals at water treatment plant           24 – 34          34          27           250       ppm

     Total
     Dissolved         Natural in environment                          39 – 20         120          83           500       ppm
     Solids
     Zinc              Natural in environment; also from use
                       of chemicals at water treatment plant          0.01 – 0.46      0.46         0.20          5        ppm
       1 Highest monthly average for calendar year 2 For physician-prescribed "no salt diets," a limit of 20 ppm is suggested

                                                                                                                           Page | 8
Norfolk Department of Utilities 2020 Drinking Water Quality Results                                      www.norfolk.gov/utilities

 Additional Information
    Substance               Norfolk's Range       Norfolk's Average Level            Unit                Secondary,
    Alkalinity                   13 – 39                       26                    ppm                Additional, &
                                                                                                         Unregulated
    Ammonia                     ND – 0.9                       0.1                   ppm
                                                                                                        substances all
    Hardness                     28 – 61                       42                    ppm               within expected
    Silica                         3–6                          5                    ppm                  ranges
 Unregulated Contaminant Monitor Rule
 The EPA uses the Unregulated Contaminant Monitoring (UCM) program to collect data for contaminants
 suspected to be present in drinking water but do not have health-based standards set under the Safe Drinking
 Water Act (SDWA). Every five years, the EPA reviews the list of contaminants and selects no more than 30 for a
 nationwide drinking water survey to provide occurrence data for potential future regulation. The final sampling
 for UCMR4 occurred in November 2018.

                                                                                             Norfolk's
                                                      Norfolk's             Norfolk's        Average          National
     Substance        Likely Source                    Range                Highest                            MCL            Unit
                                                                                              Level
     Total            Byproduct of
                                                       5.8 – 10                 10             7.3               n/a          ppb
     HAA6Br           disinfection process
     Total            Byproduct of
                                                      20.6 – 45                 45             32.1              n/a          ppb
     HAA9             disinfection process
                                                                                             Norfolk's
                                                      Norfolk's             Norfolk's        Average          National
     Substance        Likely Source                    Range                Highest                            SMCL           Unit
                                                                                              Level
     Manganese        Natural in
                                                    ND – 0.004             Level 0.004         0.001            0.050         ppm
                      environment
 For more information on the UCMR program, visit EPA online at https://www.epa.gov/dwucmr/fourth-unregulated-
 contaminant-monitoring-rule.
                                                                      Per- and polyfluoroalkyl Substances
 Pharmaceuticals & Source Water                                       (PFAS)
 Pharmaceuticals can enter the waterways through                      Per- and polyfluoroalkyl substances (PFAS) are a group
 excretion from the body and the practice of                          of human made chemicals. PFAS have been used in a
 improper disposal methods, such as flushing                          variety of industries and consumer goods. Initial
 unused or expired medications down the toilet.                       research suggests that exposure to PFAS may lead to
 Everyone can help keep unused pharmaceuticals                        human health concerns.
 out of the water supply by properly disposing of
 unused medications.                                                  There are no federal or state drinking water regulations
                                                                      for PFAS in Virginia. However, in 2016 the EPA set a
 A permanent drug drop-off is located at Norfolk's
                                                                      health advisory level as guidance. Treated water
 Public Safety Building, 811 E. City Hall Ave.
                                                                      samples have been taken from all Norfolk drinking
 If disposing at home, discard with the trash. Always                 water treatment plants as part of EPA's national
 remove personal information, seal in a container                     sampling program in 2013, and again in 2020. All
 and disguise the contents by mixing with coffee                      samples were well below the EPA health advisory level.
 grounds or kitty litter.
Page | 9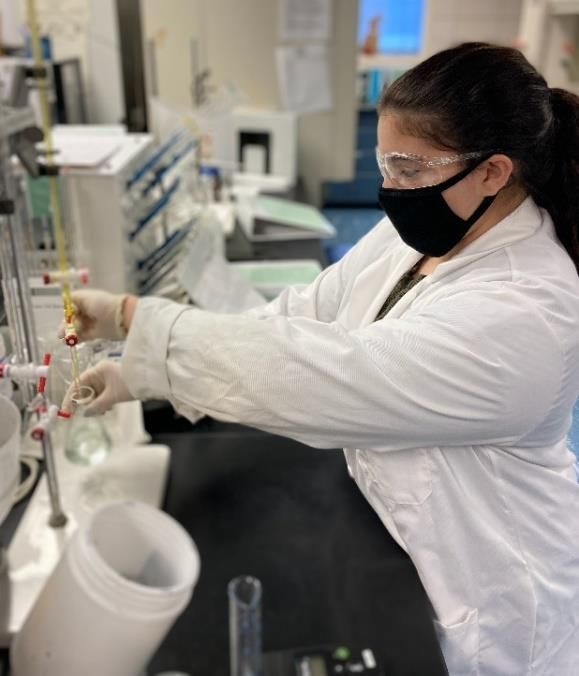
Norfolk Department of Utilities 2020 Drinking Water Quality Results                                    www.norfolk.gov/utilities

 Glossary
 Action Level: The concentration of a          MRDLG (Maximum Residual                    Total Coliform: Coliforms are bacteria
 contaminant which, if exceeded,               DisinfectionLevel Goal): The level of a    thatare naturally present in the
 triggers treatment or other                   disinfectant in drinking water below       environment. Their presence in drinking
 requirements that a water system              which there isno known or expected         water may indicate that other potentially
 must follow. The action level is not          risk to health.                            harmful bacteria are also present.
 based on one sample; instead,it is based
                                               MRDLGs do not reflect the benefits of      HAAs (Haloacetic Acids):
 on many samples.
                                               theuse of disinfectants to control         A group of chemicals known as
 Alkalinity: A measure of the water's          microbial contaminants.                    disinfection byproducts. These form
 ability to resist changes in the pH level                                                when a disinfectant reacts with naturally
                                               Minimum Residual Disinfectant
 and a good indicator of overall water                                                    occurring organic and inorganic matter in
                                               Level: The minimum level of residual
 quality. Although there is no health risk                                                the water.
                                               disinfectant required at the entry point
 from alkalinity, we monitor it to check
                                               to the distribution system.                TOC (Total Organic Carbon):
 ourtreatment processes.
                                                                                          A measure ofthe carbon content of
                                               ND - Not Detected in the water
 E. coli (Escherichia coli): A type of                                                    organic matter. This measure is used to
 coliform bacteria that is associated          NTU (nephelometric turbidity units):       indicate the amount of organic material in
 withhuman and animal fecal waste.             Turbidity is measured with an              the water that could potentially react
                                               instrument called a nephelometer.          with a disinfectant to form disinfection
 gpg (grains per gallon): A unit of water
                                               Measurements are given in                  byproducts.
 hardness. One grain per gallon is equal
                                               nephelometric turbidity units.
 to 17.1 parts per million.                                                               TTHMs (Total Trihalomethanes):
                                               Pathogens: Bacteria, virus, or other       A group of chemicals known as
 MCL (Maximum Contaminant Level):
                                               microorganisms that can cause disease.     disinfection byproducts. These form
 The highest level of a contaminant that                                                  when a disinfectant reacts with naturally
 is allowed in drinking water. MCLs are        pCi/L (Picocuries per liter): A measure
                                                                                          occurring organic and inorganic matter in
 set asclose to the MCLGs as feasible          of radioactivity.
                                                                                          the water.
 using the best available treatment            ppm (parts per million): Denotes 1
                                                                                          Treatment Technique: A required
 technology.                                   part per 1,000,000 parts, which is
                                                                                          process intended to reduce the level
 MCLG (Maximum Contaminant Level               equivalentto two-thirds of a gallon in
                                                                                          of acontaminant in drinking water.
                                               an Olympic- sized swimming pool.
 Goal): The level of a contaminant in
                                                                                          Turbidity: A measure of the clarity of
 drinking water below which there is           ppb (parts per billion): Denotes 1 part
                                                                                          water related to its particle content.
 no known or expected risk to health.          per 1,000,000,000 parts, which is
                                                                                          Turbidity serves as an indicator for the
 MCLGsallow for a margin of safety.            equivalentto half a teaspoon in an
                                                                                          effectiveness of the water treatment
                                               Olympic-sized swimming pool.
 mg/L (Milligrams per liter):                                                             process. Low turbidity measurements,
 One milligram per liter is equal to one       μg/L (Microgram per liter): One            such as ours, show the significant
 part per million.                             microgram per liter is equal to one        removal of particles that are much
                                               partper billion.                           smaller than canbe seen by the naked
 MRDL (Maximum Residual
                                                                                          eye.
 Disinfection Level): The highest level        ppt (parts per trillion): Denotes 1
 of disinfectant that is allowed in drinking   part per 1,000,000,000,000 parts,          WTP: Water Treatment Plant
 water. The addition of a disinfectant is      which is equivalent to one drop in 20
 necessary for the control of microbial        Olympic-sized swimming pools.
 contaminants.

                                                                                                                           Page | 10
Norfolk Department of Utilities 2020 Drinking Water Quality Results www.norfolk.gov/utilities
Do Your Part to Keep Our Waters Clean!
Don't Pollute!
Water that enters our storm drains often flows directly to our local streams
and rivers. Do your part to help protect our waterways:
• Always recycle or dispose of household hazardous waste properly
• Don't pour motor oil, antifreeze or other toxic materials down storm
drains, which connect to the City's sewer system
• Don't flush paint thinners, insect sprays, herbicides and other harmful
chemicals down the toilet or put them down the sink
Contact Waste Management to get a schedule for household hazardous
materials drop-off events where you can dispose of these materials safely
without polluting your drinking water supply.
Don't flush wipes, whether made from natural or synthetic materials,
down the toilet because they do not instantly dissolve like toilet paper. In
homes, wipes can cause interior pipes to clog and sewage to back-up into
homes or the street.
It is also important NOT to discard rubber gloves, masks and any other
litter onto streets or sidewalks because they can end up in our local
waterways or at our wastewater treatment plants, where they can clog
the infrastructure. All litter and waste should be appropriately discarded
into a trash can.
Get Involved: Important Numbers &
Websites:
We're looking for excellent
people to work with. Department of Utilities
(757) 664-6700
We participate in public and www.norfolk.gov/utilities
community events, including
presentations made at schools, civic Reservoir Management (Boating)
leagues, homeowner and (757) 441-5678, ext. 253
environmental association and other www.norfolk.gov/584/Reservoirs
environmental celebrations. Water Quality
(757) 441-5678
If you would like to help protect
www.norfolk.gov/tap-water
your water supply or watershed,
please call the Department of Water & Sewer Main Breaks
Utilities at 664-6700 or visit our (757) 823-1000
website at www.norfolk.gov/4759/Report-a-Problem
www.norfolk.gov/watersense. Stormwater
(757) 823-4000
Contact Norfolk Utilities www..norfolk.gov/stormwater
Public Information Keep Norfolk Beautiful
(757) 664-6701 (757) 441-1347
utpublicinfo@norfolk.gov www.norfolk.gov/knb
Page | 11Norfolk is a proud partner of the askHRgreen program. By partnering with others throughout the region, Norfolk hopes to
inspire environmental stewardship among all citizens to protect our waterways and local resources on a greater scale. Visit
www.askHRgreen.org and begin helping our waterways, infrastructure and recycling efforts through information and
inspiration sharing.
Page | 12You can also read