Automatic detection of artifacts in converted S3D video
←
→
Page content transcription
If your browser does not render page correctly, please read the page content below
Automatic detection of artifacts in converted S3D video
   Alexander Bokov, Dmitriy Vatolin, Anton Zachesov, Alexander Belous, Mikhail Erofeev
                        Lomonosov Moscow State University, Moscow, Russia

                                                 ABSTRACT
In this paper we present algorithms for automatically detecting issues specific to converted S3D content. When
a depth-image-based rendering approach produces a stereoscopic image, the quality of the result depends on
both the depth maps and the warping algorithms. The most common problem with converted S3D video is
edge-sharpness mismatch. This artifact may appear owing to depth-map blurriness at semitransparent edges:
after warping, the object boundary becomes sharper in one view and blurrier in the other, yielding binocular
rivalry. To detect this problem we estimate the disparity map, extract boundaries with noticeable differences,
and analyze edge-sharpness correspondence between views. We pay additional attention to cases involving a
complex background and large occlusions. Another problem is detection of scenes that lack depth volume: we
present algorithms for detecting flat scenes and scenes with flat foreground objects. To identify these problems
we analyze the features of the RGB image as well as uniform areas in the depth map. Testing of our algorithms
involved examining 10 Blu-ray 3D releases with converted S3D content, including Clash of the Titans, The
Avengers, and The Chronicles of Narnia: The Voyage of the Dawn Treader. The algorithms we present enable
improved automatic quality assessment during the production stage.
Keywords: stereoscopic video, quality assessment, stereo matching, 2D-to-3D conversion, edge-sharpness mis-
match, cardboard effect

                                           1. INTRODUCTION
The process of creating S3D videos usually involves one of three approaches: capturing footage using a stereo-
scopic camera system, conversion from 2D videos, and computer graphics. In this work we address automatic
quality control of stereoscopic videos converted from a 2D source.
   The International Telecommunication Union defines the quality of experience that a stereoscopic system
provides as comprising three perceptual factors: picture quality, depth quality, and visual discomfort [1]. In this
paper we mostly examine the last two, as stereoscopic conversion rarely affects picture quality. The quality of
the resulting S3D video, however, depends on both the depth maps and the warping algorithms. Processing of
object boundaries is a principal concern; it may require filling of holes and handling of semitransparent edges.
Low-quality depth maps may cause numerous problems ranging from annoying jitter on object boundaries to a
complete inability of viewers to perceive the scene.
   A number of artifacts may arise during stereo conversion; these artifacts not only cause visual discomfort to
viewers watching these videos, but they also impede popularization of S3D. It should be noted that automatic
quality measurement of 2D-to-3D conversion is a significantly more difficult task than quality evaluation of
natively captured S3D. Numerous issues may arise during the conversion process: structural deformations,
inconsistent occlusion filling, low-quality edge processing, and so on. Thus, owing to the problem’s complexity,
we restrict our present coverage to the two most common and serious issues arising for 2D-to-3D conversion:
edge-sharpness mismatch and the cardboard effect.
    To evaluate the quality of object boundaries, we define the term edge-sharpness mismatch to describe defective
stereo pairs with particular asymmetric impairments. This term refers to any inconsistencies in the appearance
of object edges between the stereoscopic views (edge-sharpness variation, edge doubling, ghosting, and so on).
Under the viewing conditions of a real environment, such situations rarely occur. In the case of 2D-to-3D
conversion, however, the likelihood of edge-sharpness-mismatch can be rather high. Figure 1 illustrates such an
artifact.
   Author e-mail: {abokov, dmitriy, azachesov, abelous, merofeev}@graphics.cs.msu.ru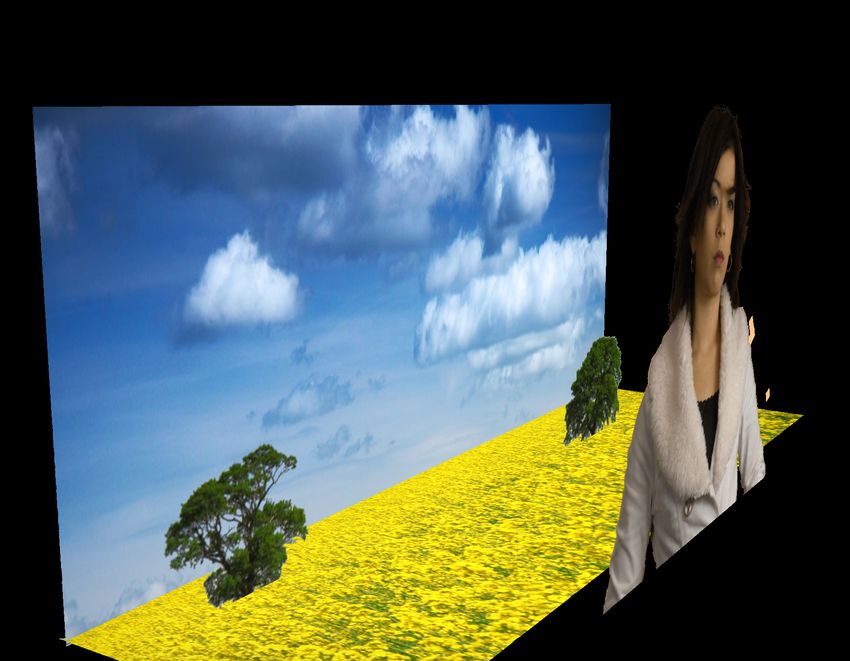
Source Image                                          Depth Map

                                                       DIBR

                    Generated Left View                                Generated Right View

Figure 1: Example of edge-sharpness mismatch introduced during the 2D-to-3D conversion stage due to blurred
edges of the depth map. The sharpness of the monument’s edges differs between the left- and right-eye images.

   The edge-sharpness mismatch artifact is typically caused by the following:

   • Use of a “rubber sheet” technique, defined as warping the pixels surrounding the occlusion regions to
     avoid explicit occlusion filling. In such cases, the edges of the displacement map are blurred and the
     transition between foreground and background regions is smoothed. The region occupied by edge/motion
     blur is either “stretched” or “tucked,” depending on the direction of object displacement. Naturally, this
     approach leads to mismatches in edge sharpness between the views.
   • Lack of proper treatment of semitransparent edges, potentially resulting in edge doubling or ghosting.
   • Simple occlusion-filling techniques leading to stretching artifacts near object edges.

   The cardboard effect is a term referring to an unnatural flattening of objects in perceived visual images; it arises
under certain viewing conditions for stereoscopic videos [2]. Although this artifact may appear in stereoscopic
videos captured by a stereoscopic camera system, it appears more frequently in converted S3D videos. In this
paper we address the problem of depth-map quality by detecting scenes and objects that lack depth volume.
Figure 2 presents an illustration of the cardboard effect.
   In Section 2 of this paper we describe several existing methods that make estimating the quality of converted
S3D videos possible. In Section 3 we present our novel approaches to quality estimation for depth maps and
object boundaries; Section 4 describes our results. Finally, we discuss directions for further work in Sections 5
and 6.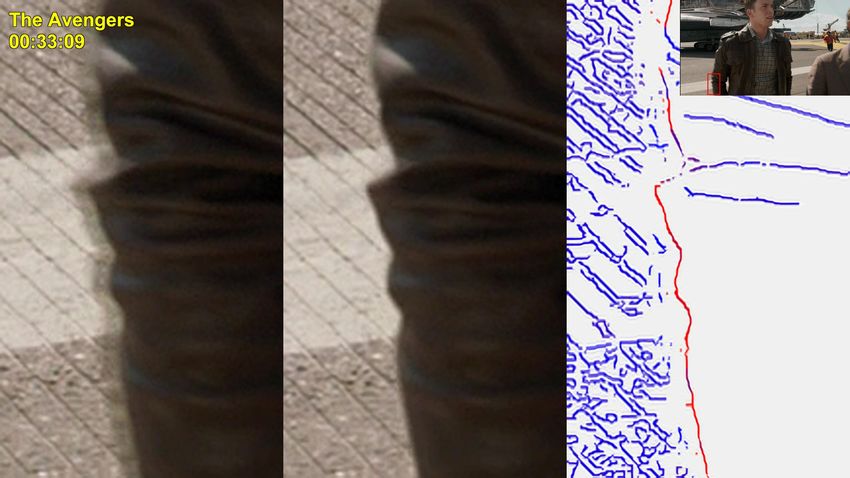
(a) Generated S3D image in anaglyph format                     (b) Actual objects’ volume and disposition

Figure 2: Illustration of the cardboard effect introduced during the 2D-to-3D conversion stage. While objects
in the scene have various disparity (a), the foreground character appears to be flat (b) owing to a lack of depth
information.

                                           2. RELATED WORK
In [3] we presented a number of metrics for estimating the quality of captured S3D videos; these metrics enable
detection of color mismatch, sharpness mismatch, and vertical disparity. Moreover, we described a method for
analyzing horizontal disparity in S3D videos, which is relevant to converted S3D videos as well. However, color
mismatch and vertical disparity rarely occur in converted S3D owing to the nature of a common conversion
pipeline, and sharpness mismatch in converted S3D has nothing to do with the camera system, but happens
because of the warping and interpolation algorithms. Even though all of these artifacts can arise in converted
S3D videos, in [3] we avoided addressing artifacts specific to converted S3D.
   All the existing models for 3D-video quality estimation can be generally divided into two categories:

   • Metrics that aim to achieve good correlation with mean opinion score (MOS) for the whole video sequence,
     and may require some additional information (e.g., the original 2D video, if the input S3D sequence was
     converted from 2D).
   • Metrics that retrieve artifacts of concrete types from the video sequence (e.g., methods proposed in this
     paper).

    One model from the first category for objectively estimating 3D-video quality appears in [4]. Although the
authors took picture quality and visual discomfort into account, analyzing the quality difference between the left
and right views, this model disregards depth-map quality, which plays a significant role in stereoscopic conversion.
For example, the cardboard effect is unlikely to result into quality difference between the stereoscopic views, yet
it does affect the quality of experience.
   There are several metrics designed specially for converted S3D as well. For example, [5] presents the color
and sharpness of edge distortion (CSED) metric, which estimates the color distortion and sharpness distortion of
object edges in views synthesized using the depth-image-based-rendering (DIBR) technique [6]. But the metric
assumes that the reference image, which has the same viewpoint as the generated view under evaluation, is also
available—an assumption that fails to hold in the case of 2D-to-3D conversion.
    A no-reference metric for S3D videos acquired using DIBR also exists and is described in [7]. The approach
uses the concept of an ideal depth estimate, which is a depth map that would generate a distortion-free image
given the same DIBR parameters and source image. It then estimates temporal inconsistencies in the depth
map, as well as spatial and temporal outliers.
(a) Color criterion.          (b) Color criterion.         (c) Texture criterion.       (d) Texture criterion.
Left view                     Right view                   Left view                    Right view
Figure 3: Schemes illustrating the main ideas of the edge-sharpness-mismatch metric. Blue cells are detected
edge pixels, and the red cell is the current pixel. The color criterion is illustrated in (a) and (b). Shaded cells
                  l         r
are pixels from Cobj  and Cobj —that is, sets of candidate pixels for the foreground-object color in the left and
right views, respectively. The texture criterion is illustrated in (c) and (d).

                                          3. PROPOSED METHOD
In this section we present two metrics for quality evaluation of 2D-to-3D conversion: one for edge-sharpness
mismatch and one for the cardboard effect. These metrics are qualitative and can serve only as indicators
of potential problems. Thus, they are only able to detect potentially erroneous scenes and are incapable of
any reliable numerical assessment. Although we are striving to develop quantitative metrics for these types of
problems, much work remains.

3.1 Edge-sharpness mismatch detection
Consider a naı̈ve solution to the problem presented above. Such a solution would perform edge matching between
stereoscopic views and would use a state-of-the-art technique for edge-sharpness estimation [8] to assess edge-
sharpness mismatch. Owing to the high variability of possible edge inconsistencies between stereoscopic views,
however, such naı̈ve approaches often fail. Another major problem is dealing with complex backgrounds and
large occlusion areas. Under such conditions background change often occurs, defined as a significant deviation in
background appearance along a given object edge between stereoscopic views. The arbitrary nature of possible
background changes makes estimating differences in edge appearance quite challenging in such cases. To overcome
this problem we make the following assumption: in regions where background change occurs, edge-sharpness
mismatch is absent. Obviously, this assumption doesn’t always hold, but it greatly simplifies the problem,
essentially transforming it into the problem of edge detection with background change—circumstances in which
we cannot reliably estimate edge-sharpness mismatch.
   Edge-sharpness mismatch detection involves four steps:

   1.   Edge detection and matching between stereoscopic views with outlier rejection
   2.   Estimation of a raw edge-sharpness mismatch map
   3.   Estimation of a background change penalty map
   4.   Refinement of the edge-sharpness mismatch map

   For edge detection in both stereoscopic views, we use the Canny edge detector [9]. Edge matching employs a
block-based approach to estimating a dense disparity map [10]. Edge pixels are considered reliable when they are
successfully matched using a disparity map with sufficiently small displacement error and satisfy the left/right
consistency constraint (LRC) [11]. Further analysis uses only reliably matched edge pixels.
    Then for each pair of successfully matched edge pixels Il (x, y) and Ir (x0 , y) we obtain a raw estimate D(x, y)
of the difference in appearance between views. To do so we apply a simple gradient-based approach: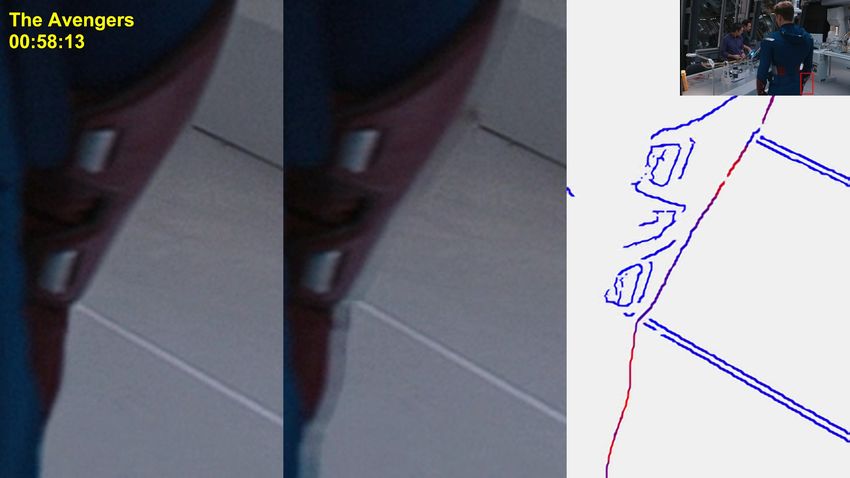
2
                                                       max(k∇Il (x, y)k, k∇Ir (x0 , y)k)

                              Draw (x, y) =                                                                     − 1.                                 (1)
                                                       min(k∇Il (x, y)k, k∇Ir (x0 , y)k)

    The main drawback of this simple estimate is that it yields numerous false positives in regions with background
change near object boundaries. Thus, the crucial step for the algorithm is accurate estimation of the background-
change penalty map, which enables suppression of false positives in such areas (under the assumption that true
positives in these areas are very unlikely). To compute the background-change penalty map Dbg (x, y) we use two
criteria: a color-based criterion, Qc (x, y), that restricts the possible differences in background color between the
views, and a texture-based criterion, Qt (x, y), that detects significant differences in background texture between
the views.
                                       Dbg (x, y) = αQc (x, y) + (1 − α)Qt (x, y).                                (2)

   In our experiments we used α = 0.02.
    Typically, differences in edge appearance between views originate from some type of foreground-object color
leakage into the background. Thus, the background color in one view should be a linear mixture of foreground-
object and background colors from the other view. All other differences in background color near the edge should
be penalized. We propose the following metric implementing this idea (Figures 3(a) and 3(b)):
                                                                                                                                             !
                                                             clobj , clbg , crbg                                  crobj , crbg , clbg

               Qc (x, y) = min       min          error                                 ,     min         error                                  ,   (3)
                                  clobj ∈Cobj
                                          l                                                 crobj ∈Cobj
                                                                                                    r

                                 error(c1 , c2 , c3 ) = min kc3 − (αc1 + (1 − α) c2 ) k.                                                             (4)
                                                              α∈[0,1]

where clbg and crbg are background colors for the left view and right view, respectively. We compute them as
follows:
                                                    (
                                                     cll , if d(cll , crl ) > d(clr , crr )
                                           clbg   =                                         ,                                                        (5)
                                                     clr , otherwise
                                                      (
                                                          crl , if d(cll , crl ) > d(clr , crr )
                                           crbg   =                                              ,                                                   (6)
                                                          crr , otherwise

                                      clr = (gr  Il )(x, y), crr = (gr  Ir )(x0 , y),                                                              (7)

                                       cll = (gl  Il )(x, y), crl = (gl  Ir )(x0 , y).                                                             (8)

where d(c1 , c2 ) denotes the Euclidian distance between colors c1 and c2 in RGB color space. Also, gl and gr are
normalized trimmed√versions of the derivative of the two-dimensional
                                                             √           Gaussian function, G(x, y, σ), defined as
gl (x, y) = max(0, − 2πσG0x (x, y, σ)) and gr (x, y) = max(0, 2πσG0x (x, y, σ)). We used σ = 3.0.
     l         r
   Cobj and Cobj are sets of foreground-object color candidates for the left view and right view, respectively. We
use a small neighborhood of each edge pixel as a set of candidates for the foreground-object color.
   All differences in background texture should be penalized because they generally indicate a background
change. We compare the mean gradient directions weighted by the gradient magnitude in the neighborhoods of
matched edge pixels (Figures 3(c) and 3(d)):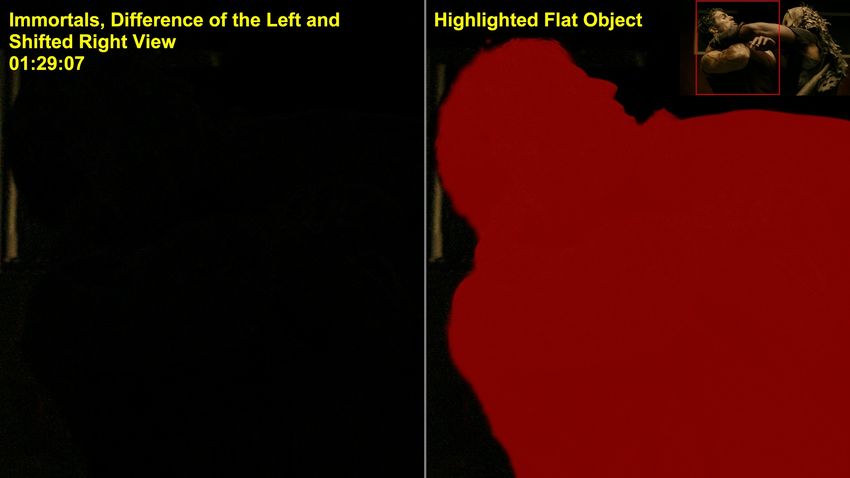
(a) Left view (b) Right view (c) Raw edge-sharpness-mis- (d) Refined edge-sharpness-
match map mismatch map
No mismatch High mismatch
Figure 4: Example from How to Train Your Dragon depicting the effect of refining the edge-sharpness-mismatch
map. Each result is presented as an edge map where detected edge-sharpness mismatch is highlighted in red.
This scene contains no edge-sharpness mismatch, so ideally all edge pixels should be blue.
X X
∇Il (x, y) ∇Ir (x, y)
(x,y)∈Ω0
(x,y)∈Ω
Qt (x, y) = d X , . (9)
X
k∇Il (x, y)k k∇Ir (x, y)k
(x,y)∈Ω (x,y)∈Ω0
where Ω and Ω0 are neighborhoods of matched edge pixels in the left view and right view, respectively.
We compute the final refined estimate of edge-sharpness mismatch as follows:
D(x, y) = Draw (x, y)e−Dbg (x,y) . (10)
Figure 4 presents an example of a refined edge-sharpness-mismatch map. We sum all values in the map
(defined only for successfully matched edge pixels) but ignore very small ones below the noise threshold. Then
we divide the input video into separate scenes using a simple scene-change detection algorithm. The algorithm
outputs scenes with the highest metric values.
3.2 Cardboard-effect estimation
The problem of estimating the cardboard effect can be regarded as a special case of detecting inconsistencies
between the depth map used in 2D-to-3D conversion and the “real” depth map of the scene. This problem
is insoluble for the general case owing to the absence of both a reference depth map and a reliable way to
estimate it. Furthermore, depth maps can vary significantly because of creative choices made during the 2D-to-
3D conversion process. For example, some cardboarded characters can be introduced intentionally to draw the
viewer’s attention to other, more volumetric characters.
Owing to the complexity of the general problem, we restrict our analysis to detection of two simple cases:
flat scenes (complete absence of volume) and flat foreground objects (complete lack of depth details), under the
corollary assumption that no foreground object should be flat—an assumption that obviously doesn’t always
hold (e.g., a road sign). We consider these two cases independently.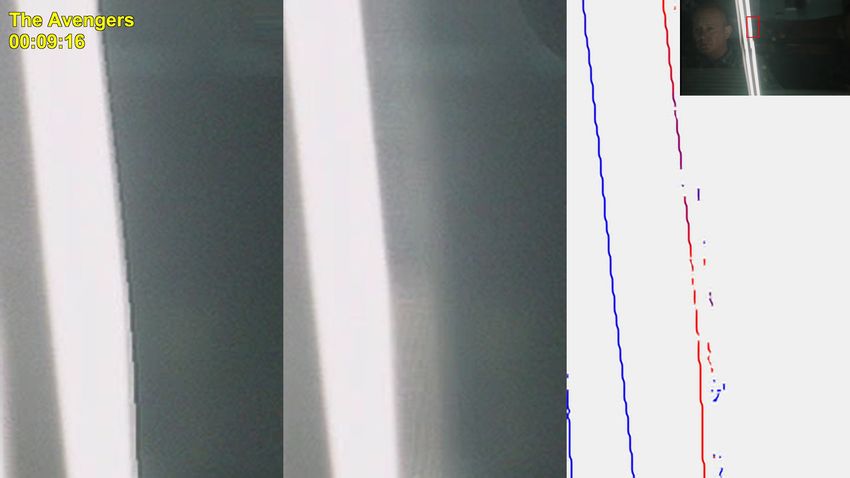
(a) Magnified fragment from (b) Magnified fragment from (c) Raw edge-sharpness-mis- (d) Refined edge-sharpness-
the left view               the right view              match map                   mismatch map

No mismatch                                                                                            High mismatch
Figure 5: Example of a false positive obtained when applying our edge-sharpness mismatch metric to Titanic 3D.
Both criteria for background-change detection fail here. The texture of the background is similar along the edge
in the left and right views. The color of the background changes in a way that is susceptible to edge-sharpness
mismatch.

3.2.1 Flat foreground objects detection
Detection of flat foreground objects involves the following:

  1. Stereo matching
  2. Disparity map segmentation and foreground-object detection
  3. Flatness estimation for each detected foreground object

    To perform stereo matching we use an algorithm identical to that of the edge-sharpness mismatch metric,
resulting in a dense disparity map. The mean-shift algorithm segments the disparity map and extracts as
foreground object masks Mi any sufficiently large segments with negative disparity. Flatness estimation of a
foreground object considers three main aspects: the strength of the object’s texture, the size of the object, and
the ability to reconstruct the object in one view through a simple uniform shift of the other view (i.e., the object’s
disparity map is a constant function). We compute the flatness as follows:
                                                   X
                                           Ci              |Il (x, y) − Ir (x + di , y)|α
                                                (x,y)∈Mi
                                    Fi =                                                    .                    (11)
                                                                 wh
where Ci is the mean gradient magnitude across the object mask Mi , di is the median disparity of the object, w
and h are frame width and height, respectively, and α is a parameter of the algorithm. We used α = 3.
3.2.2 Flat scenes detection
To detect flat scenes, we use an algorithm similar to the one mentioned above. The main difference between
flat-object detection and flat-scene detection is the definition of the term flat. We consider a scene to be flat
if its disparity map is a linear function of pixel position (x, y). Therefore, we perform a linear least-squares
approximation of the disparity map to estimate how well a linear function represents the scene’s disparity map.
The final flatness estimate is
                                           X
                                F =C               |Il (x, y) − Ir (x + dapprox (x, y), y)|α .                   (12)
                                        (x,y)∈Il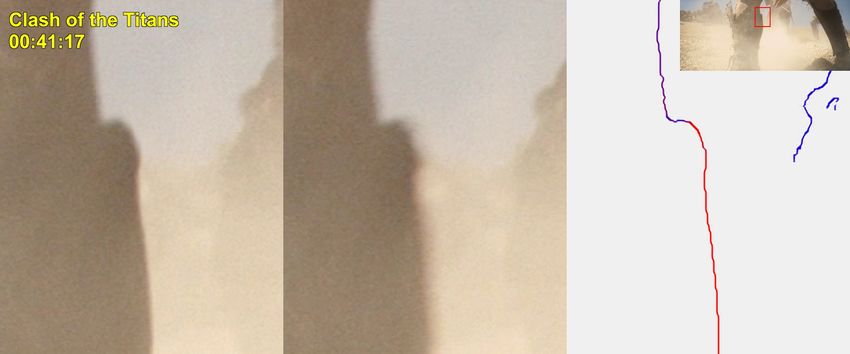
(a) Magnified fragment from the left view            (b) Difference between left view and uniformly shifted right
                                                            view
Figure 6: Example of a false positive obtained when applying our cardboard-effect metric to Shrek. Naturally,
the algorithm detects the flat object as exhibiting the cardboard effect. The black area in the right image shows
the region that is well matched with uniform disparity.

                                 Estimate     Precision     True-positive ratio
                                 Raw            0.30
                                                                     0.48
                                 Refined        0.84
Table 1: Performance of the proposed edge-sharpness mismatch metric estimated for the set of 25 random
frames from Titanic 3D. The true-positive ratio shows the fraction of true positives in the raw estimate that are
preserved in the refined estimate.

where C is the mean gradient magnitude across the whole frame, dapprox (x, y) is the approximate disparity map,
and α is a parameter of the algorithm. We used α = 3.
   The output of the algorithm is a set of scenes with the highest scene-flatness estimates, as well as scenes
containing objects with the highest foreground-object flatness estimates.

                                                   4. RESULTS
Owing to the diversity of possible 2D-to-3D conversion artifacts, an adequate numerical assessment of the prob-
lem’s severity is rather difficult. Since our metrics provide an approximate estimate, the final decision is up to a
human expert, who has to evaluate all the detected problems and decide which issues might be noticeable and
irritating for viewers.
    The significant probability of false positive alerts for both proposed methods is the second reason for requiring
review by a human expert. False positives for the edge-sharpness mismatch metric usually result when the
background-change penalty map fails to properly capture all cases of background change (e.g., Figure 5). To
clarify the performance of the proposed approach we compared our raw estimate of edge-sharpness mismatch
with the refined estimate for 25 random frames from Titanic 3D (Table 1). According to Table 1, our proposed
approach significantly decreases the number of false positives, while also substantially decreasing the number
of true positives. This result means our initial assumption regarding the absence of noticeable edge-sharpness
mismatches in areas with background change doesn’t necessarily hold in all converted films.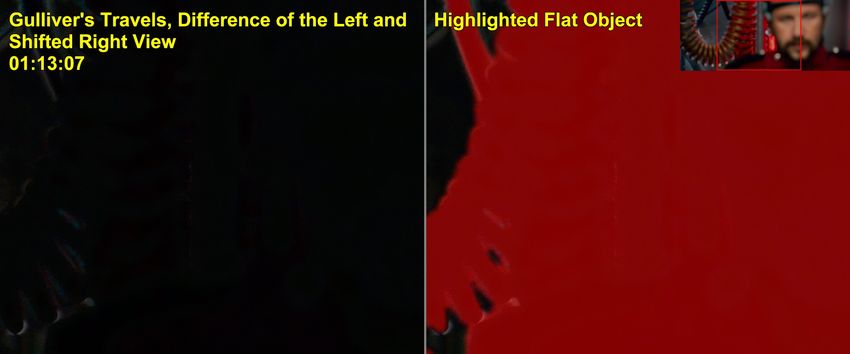
Owing to the absence of a publically available database and ground truth for estimating the cardboard effect,
we have yet to numerically assess our metric’s performance. Such an effort would be especially challenging
because of the lack of research in this field. To our knowledge, whether intentional use of cardboarded characters
in converted S3D films is justified remains an open question. Even ignoring such controversial cases, our metric
produces false positives for naturally flat objects (e.g., Figure 6).
    Despite their shortcomings, however, our metrics enable detection of a substantial number of artifacts in
real converted S3D films. We evaluated 10 Blu-ray 3D releases, having chosen this format because it of-
fers content with the best publicly available quality. Appendix A presents several examples of detected arti-
facts. The complete analysis of these Blu-ray 3D releases is available as two reports on the project web site:
http://compression.ru/video/vqmt3d/report3/ http://compression.ru/video/vqmt3d/report5/
   Processing speeds of the edge-sharpness-mismatch and cardboard-effect metrics are 1.27 and 0.69 seconds
per frame, respectively, using an Intel Core i7 processor running at 2.2GHz. Since we don’t assume any tem-
poral dependencies between results for different frames, processing can be parallelized effectively among several
computers.

                                           5. FURTHER WORK
Our primary goal is to develop a comprehensive set of reliable metrics for evaluating the quality of 2D-to-3D
conversion. Currently available metrics still fail to address many relatively common issues (e.g., structural
deformations, as well as temporal instability of occlusion filling). Another direction of research is to decrease the
number of false positives in these metrics, thereby reducing the amount of manual work.
   Another major topic is subjective testing and development of quantitative metrics that correlate well with
human perception of 2D-to-3D conversion artifacts. The results of human-perception tests may depend on the
type and quality of the display device; also, the results are susceptible to viewers’ visual acuity and their ability
to perceive 3D. This topic should therefore receive separate attention.

                                              6. CONCLUSION
In this paper we presented our method for evaluation of 2D-to-3D conversion quality. We described algorithms
for detecting edge-sharpness mismatch artifacts and the cardboard effect. To demonstrate the utility of our
proposed method, we evaluated several recent Blu-ray 3D releases and presented some of the detected artifacts.
Possible directions of further work include developing new metrics, decreasing the number of false positives in
current metrics, and subjective testing to determine the noticeability of artifacts to viewers.

                                         ACKNOWLEDGMENTS
This work is partially supported by the Intel/Cisco Video Aware Wireless Network (VAWN) Program.

                                                REFERENCES
 [1] ITU-R Recommendation BT.2021, “Subjective methods for the assessment of stereoscopic 3DTV systems,”
     tech. rep. (Aug 2012).
 [2] Boev, A., Hollosi, D., Gotchev, A., and Egiazarian, K., “Classification and simulation of stereoscopic artifacts
     in mobile 3dtv content,” Proc. SPIE 7237, 72371F–72371F–12 (2009).
 [3] Voronov, A., Vatolin, D., Sumin, D., Napadovsky, V., and Borisov, A., “Methodology for stereoscopic
     motion-picture quality assessment,” Proc. SPIE 8648, 864810–864810–14 (2013).
 [4] Yamagishi, K., Kawano, T., and Kawashima, K., “QoE Assessment Methodologies for 3D Video Services,”
     NTT Technical Review (May 2013).
 [5] Shao, H., Cao, X., and Er, G., “Objective quality assessment of depth image based rendering in 3DTV
     system,” in [3DTV Conference: The True Vision - Capture, Transmission and Display of 3D Video, 2009 ],
     1–4 (2009).
 [6] Fehn, C., “A 3D-TV approach using depth-image-based rendering (DIBR),” in [Proc. of VIIP ], 3 (2003).
[7] Solh, M. and AlRegib, G., “A no-reference quality measure for DIBR-based 3D videos,” in [Multimedia and
     Expo (ICME), 2011 IEEE International Conference on ], 1–6, IEEE (2011).
 [8] Bouma, H., Dijk, J., and van Eekeren, A. W. M., “Precise local blur estimation based on the first-order
     derivative,” Proc. SPIE 8399, 839904–839904–8 (2012).
 [9] Canny, J., “A computational approach to edge detection,” Pattern Analysis and Machine Intelligence, IEEE
     Transactions on PAMI-8(6), 679–698 (1986).
[10] Simonyan, K., Grishin, S., Vatolin, D., and Popov, D., “Fast video super-resolution via classification,” in
     [Proceedings of IEEE International Conference on Image Processing ], 349–352 (2008).
[11] Egnal, G., Mintz, M., and Wildes, R. P., “A stereo confidence metric using single view imagery with
     comparison to five alternative approaches,” Image and Vision Computing 22(12), 943 – 957 (2004).
APPENDIX A. EXAMPLES OF DETECTED ARTIFACTS
A.1 Edge-sharpness mismatch
The examples below are horizontally stacked magnified fragments of the left and right views for the frame, as well
as the edge-sharpness mismatch map—an edge map where any detected edge-sharpness mismatch is highlighted
in red.
No mismatch High mismatch
Figure 7: Example of edge-sharpness mismatch detected in Clash of the Titans.
Figure 8: Example of edge-sharpness mismatch detected in The Avengers.No mismatch High mismatch
Figure 9: Example of edge-sharpness mismatch detected in The Avengers.
Figure 10: Example of edge-sharpness mismatch detected in The Avengers.A.2 Cardboard effect
Figure 11: Flat characters detected in Immortals.
Figure 12: Flat character detected in Gulliver’s Travels. Some parts of the background are also located on the
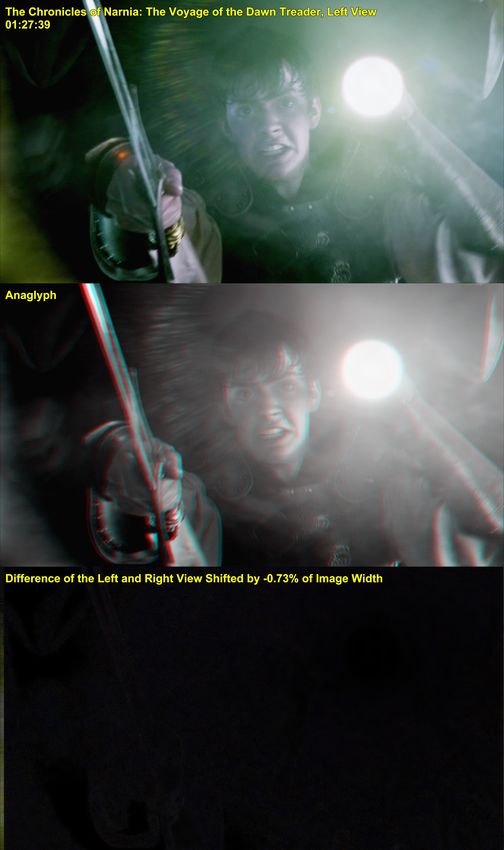
same depth as the character.Figure 13: Flat scene detected in The Chronicles of Narnia: The Voyage of the Dawn Treader.
You can also read