DOTS: DECOUPLING OPERATION AND TOPOLOGY IN DIFFERENTIABLE ARCHITECTURE SEARCH
←
→
Page content transcription
If your browser does not render page correctly, please read the page content below
Under review as a conference paper at ICLR 2021

DOTS: D ECOUPLING O PERATION AND T OPOLOGY                                                      IN
D IFFERENTIABLE A RCHITECTURE S EARCH
 Anonymous authors
 Paper under double-blind review

                                           A BSTRACT
         Differentiable Architecture Search (DARTS) has attracted extensive attention due
         to its efficiency in searching for cell structures. However, DARTS mainly focuses
         on the operation search, leaving the cell topology implicitly depending on the
         searched operation weights. Hence, a problem is raised: can cell topology be
         well represented by the operation weights? The answer is negative because
         we observe that the operation weights fail to indicate the performance of cell
         topology. In this paper, we propose to Decouple the Operation and Topology
         Search (DOTS), which decouples the cell topology representation from the oper-
         ation weights to make an explicit topology search. DOTS is achieved by defin-
         ing an additional cell topology search space besides the original operation search
         space. Within the DOTS framework, we propose group annealing operation search
         and edge annealing topology search to bridge the optimization gap between the
         searched over-parameterized network and the derived child network. DOTS is
         efficient and only costs 0.2 and 1 GPU-day to search the state-of-the-art cell ar-
         chitectures on CIFAR and ImageNet, respectively. By further searching for the
         topology of DARTS’ searched cell, we can improve DARTS’ performance signif-
         icantly. The code will be publicly available.

1   I NTRODUCTION
Neural Architecture Search (NAS) has attracted extensive attention recently for its potential to au-
tomatically find the optimal architecture in a large search space. Previous approaches (Zoph et al.,
2018; Liu et al., 2018b; Real et al., 2019) based on reinforcement learning and evolutionary learning
require a full training process to validate the architecture performance, which consumes hundreds of
GPU days to search. To reduce search time, one-shot methods (Pham et al., 2018) exploit the idea of
weight sharing, which trains the supernet once and derives child architecture performance from the
supernet directly. Recent differentiable architecture search (DARTS) (Liu et al., 2019) also exploits
the weight sharing idea and further reduces the search cost by unifying the supernet training and
optimal child architecture searching.
DARTS represents cell architecture as a directed acyclic graph. Each edge of the graph refers to
candidate operations mixed by learnable operation weights, and each graph node denotes a feature
map transformed by mixed operations. DARTS has two hard pruning processes to derive the cell
architecture from the learned operation weights after searching. The first is operation pruning that
only retains the operation with the largest weight for each edge. The second is edge pruning that
retains two edges with the largest edge importance for each graph node. The two pruning processes
cause inconsistency between search and evaluation because of two problems:
      • Coupling the operation and topology search. The edge importance of the searched cell
        is indicated by the largest operation weight of this edge. However, we observe that the
        operation weight merely indicates the importance of the operation on the specific edge, but
        not the evidence that the edge should be retained in the searched cell. In other words, the
        edge importance indicated by operation weights does not correlate with the stand-alone
        model accuracy, as depicted in Figure 1a.
      • Optimization gap between search and evaluation. In the search process, DARTS sums
        the features encoded by different candidate operations. In the evaluation stage, the candi-
        date operations are hard pruned, except the most important one, leading to an optimization

                                                 1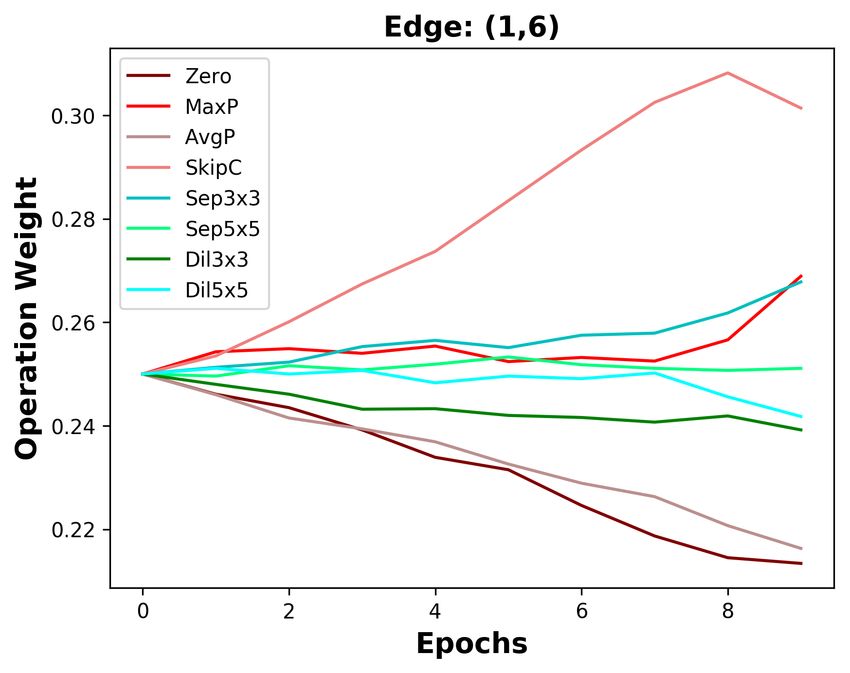
Under review as a conference paper at ICLR 2021

          (a) Operation Weight, CIFAR10                 (b) Edge Combination Weight, CIFAR10

Figure 1: Correlation between edge importance and stand-alone model accuracy. The edge im-
portance is indicated by (a) operation weight α in DARTS and (b) edge combination weight β in
DOTS. We calculate the Kendall Tau metric (Kendall, 1938) to measure the ranking correlation be-
tween the edge importance and stand-alone model accuracy. The experimental setting can be found
in Appendix A.1.

         gap between the searched over-parameterized network and the derived child network. The
         edge pruning encounters a similar optimization gap. Besides, previous works (Chen et al.,
         2019; Li et al., 2019) show that the network depth gap between search and evaluation is
         also an optimization gap that causes performance drop.

This paper addresses the first coupling problem via Decoupling Operation and Topology Search
(DOTS). To decouple the edge importance from operation weights, we define a topology search
space as the pairwise combinations of edges and make continuous relaxation. The overall search
phase is divided into operation search and topology search, in which we update operation weights
and edge combination weights, respectively. We address the second problem of the optimization
gap by annealing the search process. For operation search, we propose group annealing that divides
operation candidates into parameterized and non-parameterized groups. Each group searches and
anneals its operation weights to avoid unfair competition (Chu et al., 2019b). Furthermore, we
propose edge combination annealing that extends the annealing idea to topology search. As a result,
we can further improve DARTS by topology search based on its original searched operations.
We summarize our contributions as follows:

      1. Based on the observation that the edge importance indicated by DARTS’ operation weights
         does not correlate with the stand-alone model accuracy, we propose to decouple the opera-
         tion and topology search (DOTS).
      2. We design group annealing operation search and edge annealing topology search within the
         DOTS framework to bridge the optimization gap.
      3. With the reduction of operation candidates, the topology search is efficient. DOTS only
         costs 0.2 GPU-days to search the state-of-the-art model for CIFAR10/100 (Krizhevsky
         et al., 2009) and 1 GPU-day for ImageNet (Deng et al., 2009).

1.1   R ELATED W ORK

Neural Architecture Search (NAS) is an emerging research field for designing neural networks auto-
matically. Previous methods based on reinforcement learning (Zoph & Le, 2017; Zoph et al., 2018)
and evolutionary algorithm (Xie & Yuille, 2017; Real et al., 2019) consume large computational
overhead. Recent one-shot NAS methods (Brock et al., 2018; Bender et al., 2018; Guo et al., 2019;
Chu et al., 2019a) exploit the idea of weight sharing (Pham et al., 2018), which only trains the su-
pernet once and thus reduces the search cost. Differentiable NAS (DARTS) (Liu et al., 2019) unifies
the supernet training and child architecture searching by continuous relaxation to the architecture
search space, making the search more efficient.
Previous works based on DARTS focus on operation search and try to overcome the instability of
DARTS. Among them, DARTS+ (Liang et al., 2019) and RobustDARTS (Zela et al., 2020) diagnose
DARTS’ failure pattern and present an early stop mechanism. P-DARTS (Chen et al., 2019) adds
dropout regularization (Srivastava et al., 2014) behind skip-connections and manually restricts the

                                                 2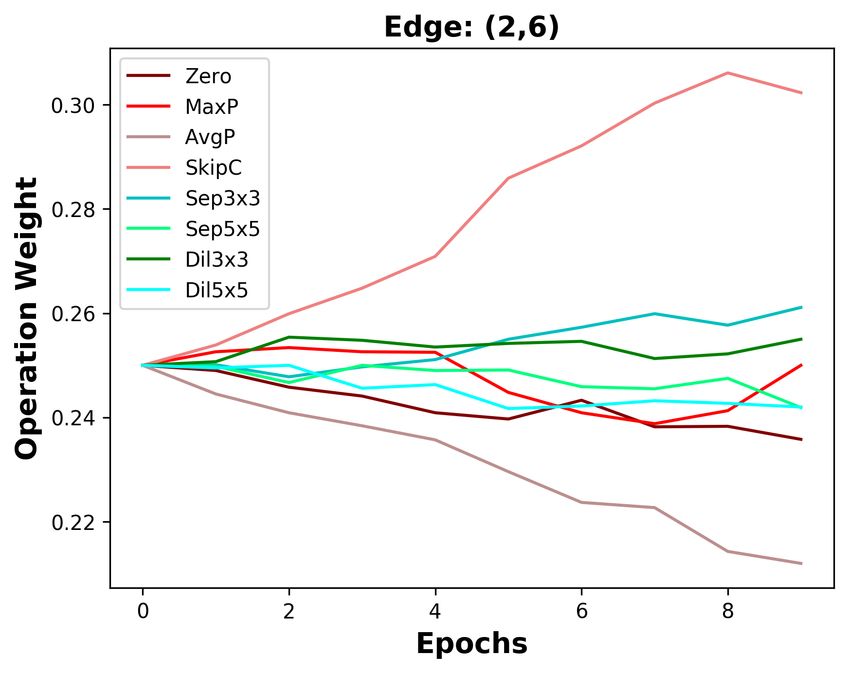
Under review as a conference paper at ICLR 2021

number of skip-connections. FairDARTS (Chu et al., 2019b) argues that DARTS’ collapse comes
from unfair competition among operations. Recent work (Shu et al., 2020) investigates the cell
architecture pattern generated by cell-based NAS and finds that DARTS prefers shallow architectures
due to their fast convergence, motivating us to rethink the topology representation in the DARTS
framework. Our work improves DARTS by decoupling the topology representation from operation
weights and searching for the cell topology explicitly.
P-DARTS (Chen et al., 2019) finds that the depth gap between search and evaluation causes perfor-
mance drop for searched cells. StackNAS (Li et al., 2019) uses the gradient fusion (Sankararaman
et al., 2020) to measure the optimization difficulty between search and evaluation, which provides
a theoretical explanation for the depth gap. Besides the depth gap, another optimization gap also
causes performance drop. It comes from the gap between the over-parameterized network and the
derived child network. ASAP (Noy et al., 2020) and SNAS (Xie et al., 2019) propose operation
weight annealing to gradually bridge the optimization gap. However, both methods only target for
the operation search and only achieve limited performance. In this work, we propose a stable oper-
ation group annealing method and then extend the annealing idea into topology search.

2     D IAGNOSING THE C OUPLING P ROBLEM IN DARTS

2.1   P RELIMINARY OF D IFFERENTIABLE A RCHITECTURE S EARCH

We start by reviewing the baseline algorithm DARTS (Liu et al., 2019). DARTS aims at searching
for the cell, a repeating building block of the neural network. A cell is represented as a directed cyclic
graph with N nodes {xi }N   i=1 , including two input, one output, and several intermediate nodes. Each
node denotes a feature map transformed by graph edges. The j-th intermediate node xj connects
to all its predecessors xi through the edge (i, j). Each edge (i, j) contains candidate operations
weighted by the operation weight α(i,j) , which can be defined as
                                                    X
                                      ō(i,j) (x) =   αo(i,j) o(i,j) (xi ),                            (1)
                                                o∈O

where o(x) ∈ O and O is the operation search space containing eight operations, including
Zero, Skip-Connection, Avg-Pooling, Max-Pooling, Sep3x3Conv, Sep5x5Conv, Dil3x3Conv, and
Dil5x5Conv. The weight for each operation is normalized with softmax:
                                                           0 (i,j)
                                                  exp(α     o        )
                                    αo(i,j) = P                   0 (i,j)
                                                                                ,                     (2)
                                                 o0 ∈O    exp(α      0
                                                                     o
                                                                            )
        0
where α is the unnormalized operation weight. The operation weight is updated with the supernet
training, gradually focusing on the optimal architecture. Once defined the mixed operation ō(i,j) for
edge (i, j), the intermediate node xj is computed from all its predecessors xi :
                                              X
                                         xj =      ō(i,j) (xi ).                                  (3)
                                                i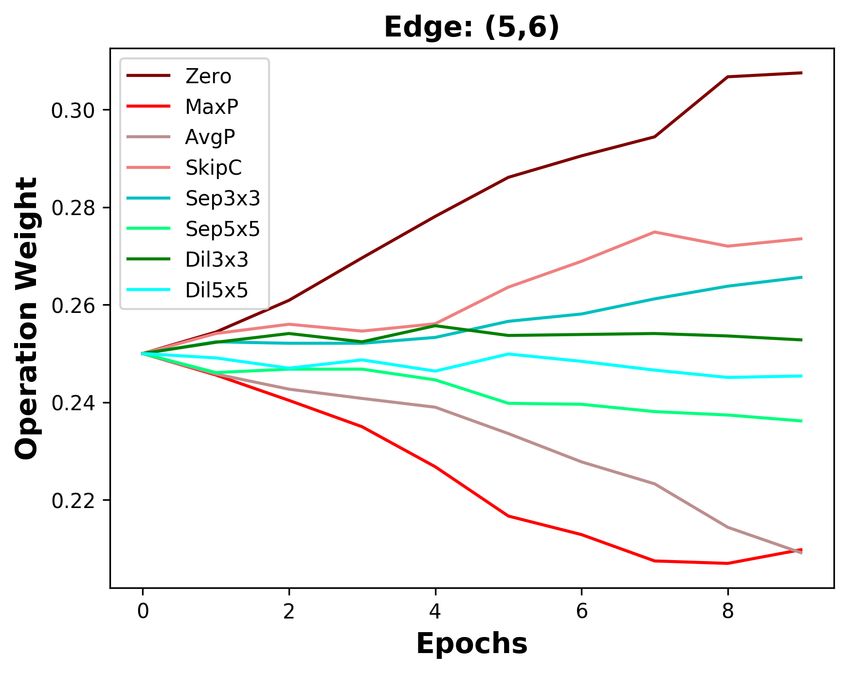
Under review as a conference paper at ICLR 2021

    Operation Search                                                 Topology Search
                                                                                                         12       13       14        23   24   34
                                                                                          4

                                                                                         3
                                                                                    2
                                                                            1
                                                                                                                       1    2        3    4

                                     Group Annealing                                                                   Edge Annealing

Figure 2: Overall pipeline of the proposed DOTS. The DOTS framework consists of group annealing
operation search and edge annealing topology search.

2.1.1     D RAWBACK OF C OUPLING O PERATION AND T OPOLOGY S EARCH
Previous DARTS-based works search for the cell’s operations, while implicitly indicating the edge
importance through the largest operation weight. Then, a question is raised: can the operation
weight well indicate the edge importance? Following DARTS’ policy that retains two edges for
each intermediate node, we enumerate all pairwise edge combinations for the intermediate nodes.
We calculate the Kendall Tau metric (Kendall, 1938) to measure the ranking correlation between the
stand-alone model accuracy and edge importance, as depicted in Figure 1. Figure 1a shows that the
stand-alone model accuracy has no clear ranking correlation with edge importance indicated by the
operation weight. It implies that DARTS’ searched cell is sub-optimal because it cannot converge
to the best cell topology, which is consistent with the finding that DARTS cannot surpass random
search in some cases (Zela et al., 2020). Intuitively, the larger operation weight can only indicate
an operation’s suitability for a specific edge, but does not mean the edge should be retained in the
searched topology. Motivated by this observation, we design edge combination weight to indicate
edge importance. Figure 1b demonstrates that the edge combination weight has a better ranking
correlation with the stand-alone model accuracy.

3     M ETHODOLOGY
The above analyses expose the drawback of coupling the operation and topology search, i.e., the
edge importance indicated by the operation weight does not correlate with the stand-alone model
accuracy. In this section, we try to tackle this problem via decoupling operation and topology search,
as shown in Figure 2. Within the DOTS framework, we propose group annealing operation search
(Section 3.1) and edge annealing topology search (Section 3.2) to bridge the optimization gap.

3.1     G ROUP A NNEALING O PERATION S EARCH

With the same graph representation as DARTS, the operation search aims at searching for the best
candidate operation for each edge. A straightforward solution is to converge to the best operation di-
rectly like DARTS. However, it encounters unfair competition among operations (Chu et al., 2019b).
Hence, skip-connections dominate the searched operations, which is sub-optimal for the subsequent
topology search. To avoid pruning useful operations too early, we propose the group annealing,
which firstly divides operations into two groups based on whether they have learnable parameters
and then makes a continuous relaxation in each operation group. With group annealing, we can
encourage fair competition within each group and avoid unfair competition between groups.
Formally, the operation search space O is divided into two sub-search spaces Op and Of based
on whether an operation has learnable parameters or not. In DARTS’ search space, Op contains
Zero, Skip-Connection, Avg-Pooling, and Max-Pooling, and Of contains Sep3x3Conv, Sep5x5Conv,
Dil3x3Conv, and Dil5x5Conv. We relax these two sub-search spaces as
                                      0 (i,j)                                                         0 (i,j)
                              exp(α    op       /T )                                          exp(α    of       /T )
               αo(i,j)
                  p
                         =P                     0 (i,j)
                                                                 ,        αo(i,j)
                                                                             f
                                                                                    =P                          0 (i,j)
                                                                                                                                 ,              (4)
                          o0p ∈Op   exp(α         o0p
                                                          /T )                           0
                                                                                        of ∈Of   exp(α             0
                                                                                                                  of
                                                                                                                          /T )
                                                     (i,j)               (i,j)
where T is the annealing temperature. αop                    and αof             are the normalized operation weights in the
groups of Op and Of , respectively.

                                                                     4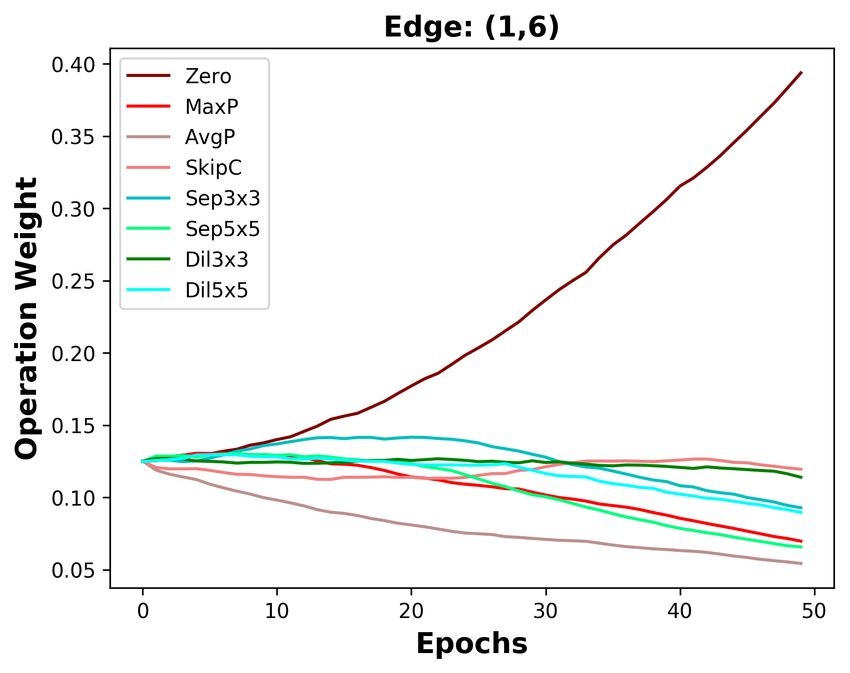
Under review as a conference paper at ICLR 2021

In Section 2.1, we have reviewed that DARTS has two hard pruning processes after searching, which
causes an optimization gap between the searched over-parameterized and derived child networks.
To bridge this optimization gap, we anneal the operation weights during searching. When we have
T → ∞, the operation weights tend to be uniform. When T gradually anneals to 0, the operation
weights tend to be sparse, which is consistent with the hard pruning after searching. We adopt an
exponential schedule for annealing:
                                            T (t) = T0 θt ,                                        (5)
where we start with a high initial temperature T0 that is decayed with the training step t increasing.
After searching, the operation with the largest weight is chosen from each group:
                                                                    (i,j)
                      o(i,j)
                       p     = arg max αo(i,j)
                                          p
                                               ,                   of       = arg max αo(i,j)
                                                                                         f
                                                                                              .    (6)
                                    op ∈Op                                        of ∈Of

After group annealing operation search, the two candidate operations on each edge (i, j) form a new
operation search space On for topology search:
                                                 (i,j)
                             On = {o(i,j)
                                    p     , of           |0 < i < j, 2 < j < N }.                  (7)

Let Ltrain
      cls   and Lval
                  cls be the Cross-Entropy classification loss on the training and validation sets,
respectively, so we can formulate the bi-level optimization with the operation weight α = {αp , αf }
and the network weight w as
                                                    ∗
                                         min Lval
                                              cls (w (α), α),
                                             α
                                                                                                   (8)
                                s.t. w∗ (α) = arg min(Ltrain
                                                       cls (w, α)).
                                                               w

We show the results of On searched by the proposed group annealing operation search in Ap-
pendix B, and we compare it with DARTS’ searched operation candidates in Section 4.3.

3.2   E DGE A NNEALING T OPOLOGY S EARCH

In Section 2.1.1, we have discussed the drawback of coupling operation and topology search. Hence,
we need to decouple the edge importance from operation weights. To achieve this, we define a topol-
ogy search space and make continuous relaxation to it. Furthermore, we propose edge annealing for
topology search to bridge the optimization gap, sharing similar spirits with the group annealing in
operation search.
Formally, the incoming edges for each intermediate node xj connect to all its predecessors. We
aim to retain two important edges, i.e., an edge combination, after topology search. Therefore, the
topology search space Exj for the intermediate node xj can be defined as all its edge combinations:
                               Exj = {h(s, j), (t, j)i |0 < s < t < j},                            (9)
where xs , xt are the predecessors of xj with the order s < t. The topology search space for node xj
                     n!
contains Cnk = k!(n−k)!   candidate combinations, where we have k = 2 and n = j. For each node
xj , we relax its topology search space to continuous, which can be defined as
                                                                   0 xj
                                                     exp(β e /T )
                                    βexj = P                  0 xj    ,                           (10)
                                                  e ∈Ex exp(β e0 /T )
                                                   0
                                                           j

                                                                             x
where T is the annealing temperature for topology search, βe j is the weight for the node xj and edge
combination e. We follow Eq. 1 and Eq. 2 to define the mixed operation ōn and operation weight
αon on the new operation search space On obtained in Eq. 7. The architecture weights in topology
                                             (i,j)                                           x
search contain the operation weight α = {αon } and edge combination weight β = {βe j }. The
feature on the node xj is the weighted sum of all incoming edges:
                                          X
                                    xj =      γ (i,j) · ō(i,j)
                                                          n     (xi ),                            (11)
                                             i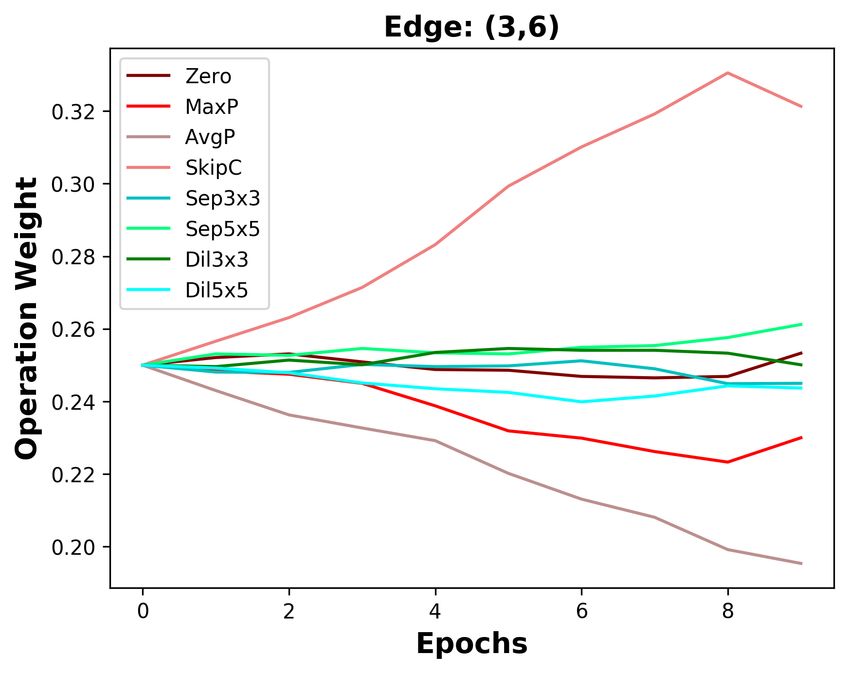
Under review as a conference paper at ICLR 2021

                Table 1: Comparison with state-of-the-art NAS algorithms on CIFAR10.
                                                                Params   Search Cost
    Architecture                                Test Err. (%)                          Search Method
                                                                 (M)     (GPU Days)
    DenseNet-BC (Huang et al., 2017)                3.46         25.6        N/A           N/A
    NASNet-A (Zoph et al., 2018)                    2.65          3.3        1800           RL
    ENAS (Pham et al., 2018)                        2.89          4.6         0.5           RL
    NAONet-WS (Luo et al., 2018)                    3.53          3.1         0.4          NAO
    AmoebaNet-B (Real et al., 2019)              2.55± 0.05       2.8        3150           EA
    Hireachical Evolution (Liu et al., 2018b)    3.75± 0.12      15.7        300            EA
    PNAS (Liu et al., 2018a)                     3.41± 0.09       3.2        225          SMBO
    DARTS (Liu et al., 2019)                        3.00         3.3         0.4            GD
    SNAS (Xie et al., 2019)                         2.85         2.8         1.5            GD
    GDAS (Dong & Yang, 2019)                        2.93         2.5         0.2            GD
    P-DARTS (Chen et al., 2019)                     2.50         3.4         0.3            GD
    FairDARTS (Chu et al., 2019b)                   2.54         2.8         0.4            GD
    PC-DARTS (Xu et al., 2020)                  2.57 ± 0.07      3.6         0.1            GD
    DropNAS (Hong et al., 2020)                 2.58 ± 0.14      4.1         0.6            GD
    MergeNAS (Wang et al., 2020)                2.73 ± 0.02      2.9         0.2            GD
    ASAP (Noy et al., 2020)                     2.68 ± 0.11      2.5         0.2            GD
    SDARTS-ADV (Chen & Hsieh, 2020)             2.61 ± 0.02      3.3         1.3            GD
    DARTS- (Chu et al., 2020)                   2.59 ± 0.08      3.5         0.4            GD
    DOTS                                         2.45 ± 0.04     4.2         0.2            GD

weight α and edge combination weight β with the exponential schedule defined in Eq. 5. We mainly
focus on the topology search in this phase, so we adopt a low initial temperature T0 for annealing
operation weight αon , making the operation on each edge almost fixed in the first few epochs.
DARTS uses bi-level optimization to avoid overfitting (Liu et al., 2019). However, Li et al. (2019)
shows that one-level optimization is more stable and accurate than bi-level optimization. The topol-
ogy search is performed in a reduced operation search space, which eliminates the risk of overfitting.
Therefore, we use one-level optimization for updating both the network weight w and the architec-
ture weight φ = {α, β}, which can be formulated as
                                  wt = wt−1 − ηt ∂w Ltrain (wt−1 , φt−1 ),
                                                                                                  (12)
                                  φt = φt−1 − δt ∂w Ltrain (wt−1 , φt−1 ),
where ηt and δt are the learning rates of the network weight and architecture weight, respectively.

4     E XPERIMENT
4.1     E VALUATION ON THE CIFAR10 DATASET

Search Settings. The whole search process on CIFAR10 (Krizhevsky et al., 2009) takes 60 epochs,
i.e., 25 epochs for the operation search stage and 35 for the topology search stage. We pretrain
network weights in the first 15 epochs of both stages by only updating network weights. The network
is composed of 8 cells for operation search and 17 cells for topology search. The initial temperature
T0 is 10 for both stages, while the minimum temperature for operation search and topology search
is 0.2 and 0.02, respectively. The search process costs 4.9 hours on one NVIDIA Quadro RTX 8000
GPU. More detailed search settings can be found in Appendix A.2.

Evaluation Settings. The evaluation settings follow DARTS (Liu et al., 2019). The network is
composed of 20 cells (18 normal cells and 2 reduction cells) and the initial number of channels
is 36. We train the network from scratch for 600 epochs with a batch size of 96. The network
is optimized via the SGD optimizer with an initial learning rate of 0.025 (cosine annealing to 0),
momentum of 0.9, weight decay of 3e-4, and gradient clipping at 5. Cutout and drop path with a
rate of 0.2 are used for preventing from overfitting. We follow DARTS to run the evaluation five
times and report the average results of the searched cell.

                                                       6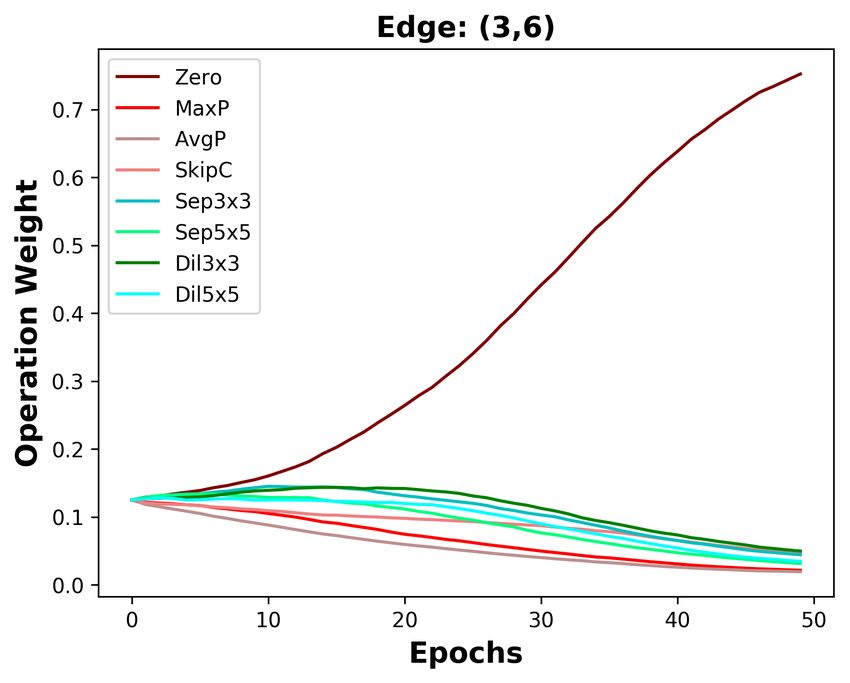
Under review as a conference paper at ICLR 2021

Table 2: Comparison with state-of-the-art NAS algorithms on ImageNet. CIFAR10/ImageNet
means the cell architecture is searched on CIFAR10 or ImageNet.
                                                  Test Err. (%)   Params   Multi-Add   Search Cost
 Architecture                                                                                        Search Method
                                                  top-1 top-5      (M)       (M)       (GPU-days)
 Inception-v1 (Szegedy et al., 2015)              30.2    10.1     6.6       1448         N/A            N/A
 MobileNet (Howard et al., 2017)                  29.4    10.5     4.2       569          N/A            N/A
 ShuffleNet 2× (v1) (Zhang et al., 2018)          26.4    10.2     5.4       524          N/A            N/A
 ShuffleNet 2× (v2) (Ma et al., 2018)             25.1     7.6     7.4       591          N/A            N/A
 NASNet-A (Zoph et al., 2018)                     26.0    8.4      5.3        564         1800           RL
 AmoebaNet-C (Real et al., 2019)                  24.3    7.6      6.4        570         3150           EA
 PNAS (Liu et al., 2018a)                         25.8    8.1      5.1        588          225          SMBO
 MnasNet-92 (Tan et al., 2019)                    25.2    8.0      4.4        388         1667           RL
 DARTS (2nd order) (CIFAR10) (Liu et al., 2019)   26.7    8.7      4.7        574          4.0            GD
 SNAS (CIFAR10) (Xie et al., 2019)                27.3    9.2      4.3        522          1.5            GD
 P-DARTS (CIFAR10) (Chen et al., 2019)            24.4    7.4      4.9        557          0.3            GD
 GDAS (Dong & Yang, 2019)                         26.0    8.5      5.3        581          0.2            GD
 FairDARTS (CIFAR10) (Chu et al., 2019b)          24.9    7.5      4.8        541          0.4            GD
 PC-DARTS (CIFAR10) (Xu et al., 2020)             25.1    7.8      5.3        586          0.1            GD
 SDARTS-ADV (CIFAR10) (Chen & Hsieh, 2020)        25.2    7.8      5.4        594          1.3            GD
 DOTS (CIFAR10)                                   24.4    7.5      5.0        557          0.2            GD
 ProxylessNAS (ImageNet) (Cai et al., 2019)       24.9    7.5      7.1        465          8.3            GD
 FairDARTS (ImageNet) (Chu et al., 2019b)         24.4    7.4      4.3        440           3             GD
 PC-DARTS (ImageNet) (Xu et al., 2020)            24.2    7.3      5.3        597          3.8            GD
 DOTS (ImageNet)                                  24.0    7.2      5.3        596          1.0            GD

Main Results. The evaluation results on CIFAR10 are shown in Table 1 (The evaluation results on
CIFAR100 can be found in Appendix C). The DOTS’ search cost of 0.2 GPU-Days is more efficient
than that of P-DARTS, where both methods search for a deeper network to bridge the depth gap.
ASAP (Noy et al., 2020) proposes the operation annealing and pruning, but it suffers from unfair
operation competition so that skip-connections dominate the searched cell. We propose the group
annealing operation search and extend the annealing idea to topology search, decreasing ASAP top-1
error by 0.23%. The searched cells are shown in Figure 4 in the appendix.

4.2   E VALUATION ON THE I MAGE N ET DATASET

Search Settings. We randomly sample 10% and 2.5% images from ImageNet (Deng et al., 2009)
to build the training and validation sets, following PC-DARTS (Xu et al., 2020). For the bi-level op-
timization, the training set and the validation set are used to update network weights and architecture
weights, respectively. For the one-level optimization, both sets are used to update network weights
and architecture weights simultaneously. The whole search process takes 60 epochs, equally divided
into the operation search and topology search stages, where the first 15 epochs of both stages are
used to pretrain the network weights. The network is composed of 8 cells for operation search and
14 cells for topology search. The initial temperature T0 is 10 for both stages, while the minimum
temperature for operation search and topology search is 0.1 and 0.01, respectively. The search pro-
cess costs 11.6 hours on two NVIDIA Quadro RTX 8000 GPUs. More detailed search settings can
be found in Appendix A.2.

Evaluation Settings. We use the mobile setting, where the input image size is set to 224×224, and
the number of multiply-add operations is restricted to be fewer than 600M. The evaluation settings
follow PC-DARTS (Chen et al., 2019). The network consists of 14 cells (12 normal cells and 2
reduction cells) with an initial number of channels of 46. We train the network from scratch for 250
epochs with a batch size of 1024. The SGD optimizer with an initial learning rate of 0.5 (warm
up in the first 5 epochs and cosine annealing to 0), momentum of 0.9, and weight decay of 3e-5
is used. Additional enhancements follow P-DARTS and PC-DARTS, including label smoothing
and an auxiliary loss tower. We evaluate both the cell directly searched on ImageNet and the cell
transferred from CIFAR10.

Main Results. The evaluation results are summarized in Table 2. Most gradient-based methods
search on a proxy dataset, e.g., CIFAR, and transfer the searched cell to ImageNet because their
search cost on ImageNet is prohibitive. In contrast, DOTS can search on ImageNet proxylessly, and
requires the least search cost (1 GPU-Day). DOTS decreases the top-1 error of PC-DARTS by 0.2.
The searched cells are shown in Figure 6 in the appendix.

                                                          7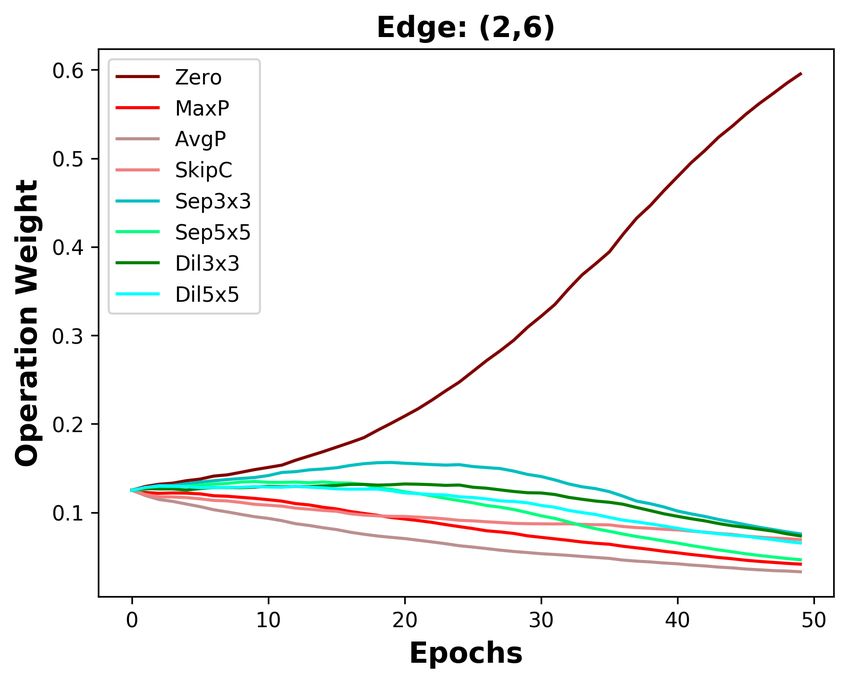
Under review as a conference paper at ICLR 2021

 Table 3: Ablation study for group annealing            Table 4: Influence of one-level (OL) and bi-
 and edge annealing.                                    level (BL) optimization for different stages.
                                        CIFAR10                                               CIFAR10
    Group Annealing    Edge Annealing                    Operation Search   Topology Search
                                        Test Err.                                             Test Err.
          7                  7          2.76±0.09              OL                 OL          2.54 ±0.06
          3                  7          2.70±0.11              OL                 BL          2.59±0.12
          7                  3          2.57±0.06              BL                 OL          2.45±0.04
          3                  3          2.45±0.04              BL                 BL          2.66±0.07

 Table 5: Improving DARTS’ operation search             Table 6: Influence of the number of the
 by topology search.                                    searched cell in topology search.
                                 CIFAR10                                     CIFAR10      Search Cost
        Architecture                                      Number of cells
                                 Test Err.                                   Test Err.    (GPU-days)
        DARTS                    2.96±0.12                       8          2.62 ±0.06        0.14
        DARTS+EATS               2.60±0.09                      14          2.51 ±0.03        0.18
        DOTS (GAOS+EATS)         2.45±0.04                      17          2.45 ±0.04        0.20

4.3   A BLATION S TUDY

Influence of Annealing. We evaluate the improvement brought by the proposed annealing tech-
nique, i.e., group annealing and edge annealing. From results in Table 3, the reduction on top-1
error brought by edge annealing is 0.25% (2.70% to 2.45%), and that brought by group annealing
is 0.12% (2.57% to 2.45%). The improvement of group annealing is smaller than edge annealing.
This is because the former divides the operations into parameterized and non-parameterized groups,
which ensures that essential candidate operations within each group are retained.

Influence of the Optimization Level. DARTS (Liu et al., 2019) finds that architecture weights are
easy to overfit with one-level optimization, but one-level optimization is found to be stable in Stac-
Nas (Li et al., 2019). In DOTS, the topology search is performed in a reduced search space, which
is less risk of overfitting. As the results in Table 4, one-level optimization has better performance
(2.45% vs. 2.66%) than bi-level optimization for searching topology.

Improving DARTS’ Operation Search. Section 2.1.1 discusses that DARTS can not converge
to the optimal topology because it couples the operation and topology search. Treated DARTS as
an operation search method, we show in Table 5 that DARTS’ results can be improved (2.96% vs.
2.60%) by incorporating the proposed edge annealing topology search (EATS). Meantime, replacing
the candidate operation searched by DARTS with that searched by the proposed group annealing
operation search (GAOS) further improves the performance (2.60% vs. 2.45%).

Bridging the Depth Gap. With the reduction of candidate operations in topology search, we can
stack more layers to bridge the depth gap for searching better topology with slight memory cost.
Table 6 shows that the performance improves with the reduction of the depth gap. In our work, we
use 17 layers for searching topology in CIFAR without further clarification.

5     C ONCLUSION

We have introduced DOTS that decouples operation search and topology search in differentiable
neural architecture search, based on the observation that the edge importance indicated by operation
weights does not correlate with the stand-alone model accuracy. Specifically, we define the cell
topology search space and make it continuous by introducing edge combination weights. The edge
importance indicated by edge combination weights strongly correlates with stand-alone model ac-
curacy. Within the DOTS framework, we propose group annealing and edge combination annealing
to bridge the optimization gap. Thanks to the reduced candidate operations in topology search, we
can stack more cells to bridge the depth gap with slight memory cost. DOTS costs 0.2 and 1 GPU-
days to search the state-of-the-art architectures on CIFAR and ImageNet, respectively. We improve
DARTS’ searched cell by further searching its topology, showing the effectiveness of DOTS.

                                                    8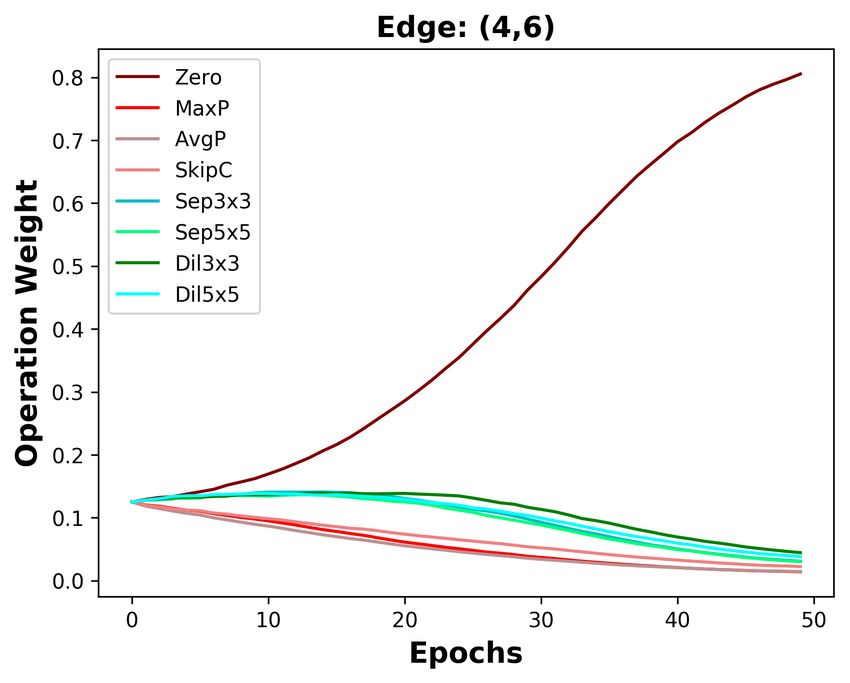
Under review as a conference paper at ICLR 2021

R EFERENCES
Gabriel Bender, Pieter-Jan Kindermans, Barret Zoph, Vijay Vasudevan, and Quoc V. Le. Under-
  standing and simplifying one-shot architecture search. In ICML, pp. 549–558, 2018.
Andrew Brock, Theo Lim, J.M. Ritchie, and Nick Weston. SMASH: One-shot model architecture
  search through hypernetworks. In ICLR, 2018.
Han Cai, Ligeng Zhu, and Song Han. ProxylessNAS: Dsearchirect neural architecture search on
  target task and hardware. In ICLR, 2019.
Xiangning Chen and Cho-Jui Hsieh. Stabilizing differentiable architecture search via perturbation-
  based regularization. In ICML, 2020.
Xin Chen, Lingxi Xie, Jun Wu, and Qi Tian. Progressive differentiable architecture search: Bridging
  the depth gap between search and evaluation. In IEEE ICCV, pp. 1294–1303, 2019.
Xiangxiang Chu, Bo Zhang, Ruijun Xu, and Jixiang Li. Fairnas: Rethinking evaluation fairness of
  weight sharing neural architecture search. arXiv preprint arXiv:1907.01845, 2019a.
Xiangxiang Chu, Tianbao Zhou, Bo Zhang, and Jixiang Li. Fair darts: Eliminating unfair advantages
  in differentiable architecture search. arXiv preprint arXiv:1911.12126, 2019b.
Xiangxiang Chu, Xiaoxing Wang, Bo Zhang, Shun Lu, Xiaolin Wei, and Junchi Yan. Darts-: Ro-
  bustly stepping out of performance collapse without indicators. arXiv preprint arXiv:2009.01027,
  2020.
Jia Deng, Wei Dong, Richard Socher, Li-Jia Li, Kai Li, and Li Fei-Fei. Imagenet: A large-scale
   hierarchical image database. In IEEE CVPR, pp. 248–255, 2009.
Xuanyi Dong and Yi Yang. Searching for a robust neural architecture in four gpu hours. In IEEE
  CVPR, pp. 1761–1770, 2019.
Zichao Guo, Xiangyu Zhang, Haoyuan Mu, Wen Heng, Zechun Liu, Yichen Wei, and Jian
  Sun. Single path one-shot neural architecture search with uniform sampling. arXiv preprint
  arXiv:1904.00420, 2019.
Kaiming He, Xiangyu Zhang, Shaoqing Ren, and Jian Sun. Deep residual learning for image recog-
  nition. In IEEE CVPR, pp. 770–778, 2016.
Weijun Hong, Guilin Li, Weinan Zhang, Ruiming Tang, Yunhe Wang, Zhenguo Li, and Yong Yu.
 DropNAS: Grouped operation dropout for differentiable architecture search. In IJCAI, pp. 2326–
 2332, 2020.
Andrew G Howard, Menglong Zhu, Bo Chen, Dmitry Kalenichenko, Weijun Wang, Tobias Weyand,
  Marco Andreetto, and Hartwig Adam. Mobilenets: Efficient convolutional neural networks for
  mobile vision applications. arXiv preprint arXiv:1704.04861, 2017.
Gao Huang, Zhuang Liu, Laurens Van Der Maaten, and Kilian Q Weinberger. Densely connected
  convolutional networks. In IEEE CVPR, pp. 4700–4708, 2017.
Maurice G Kendall. A new measure of rank correlation. Biometrika, 30(1/2):81–93, 1938.
Alex Krizhevsky et al. Learning multiple layers of features from tiny images. 2009.
Guilin Li, Xing Zhang, Zitong Wang, Zhenguo Li, and Tong Zhang. StacNAS: Towards sta-
  ble and consistent optimization for differentiable neural architecture search. arXiv preprint
  arXiv:1909.11926, 2019.
Hanwen Liang, Shifeng Zhang, Jiacheng Sun, Xingqiu He, Weiran Huang, Kechen Zhuang, and
  Zhenguo Li. Darts+: Improved differentiable architecture search with early stopping. arXiv
  preprint arXiv:1909.06035, 2019.
Chenxi Liu, Barret Zoph, Maxim Neumann, Jonathon Shlens, Wei Hua, Li-Jia Li, Li Fei-Fei, Alan
  Yuille, Jonathan Huang, and Kevin Murphy. Progressive neural architecture search. In ECCV, pp.
  19–34, 2018a.

                                                9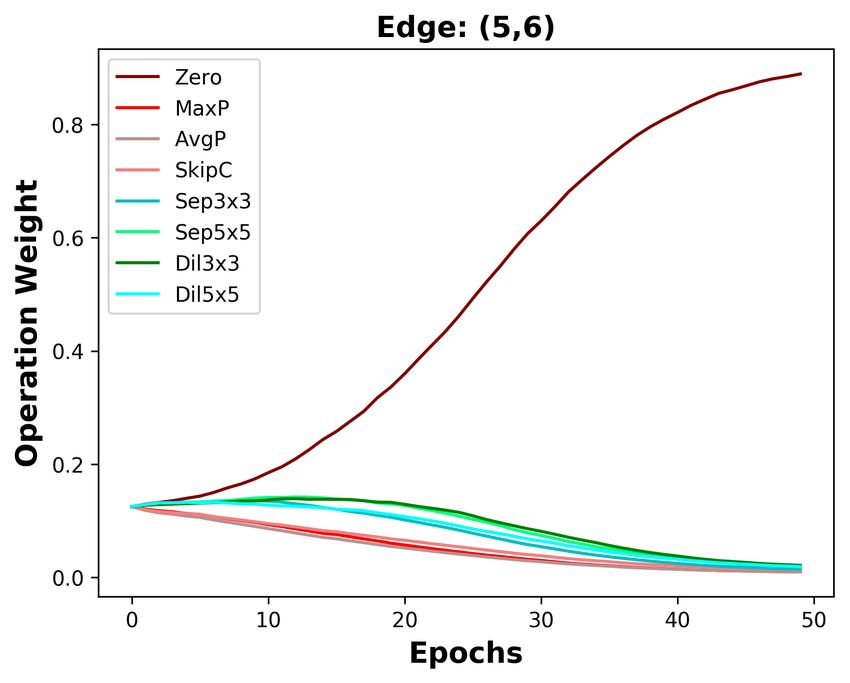
Under review as a conference paper at ICLR 2021

Hanxiao Liu, Karen Simonyan, Oriol Vinyals, Chrisantha Fernando, and Koray Kavukcuoglu. Hi-
  erarchical representations for efficient architecture search. In ICLR, 2018b.
Hanxiao Liu, Karen Simonyan, and Yiming Yang. DARTS: Differentiable architecture search. In
  ICLR, 2019.
Renqian Luo, Fei Tian, Tao Qin, Enhong Chen, and Tie-Yan Liu. Neural architecture optimization.
  In NIPS, pp. 7816–7827, 2018.
Ningning Ma, Xiangyu Zhang, Hai-Tao Zheng, and Jian Sun. Shufflenet v2: Practical guidelines for
  efficient cnn architecture design. In ECCV, pp. 116–131, 2018.
Asaf Noy, Niv Nayman, Tal Ridnik, Nadav Zamir, Sivan Doveh, Itamar Friedman, Raja Giryes, and
  Lihi Zelnik. Asap: Architecture search, anneal and prune. In AISTATS, pp. 493–503, 2020.
Hieu Pham, Melody Y. Guan, Barret Zoph, Quoc V. Le, and Jeff Dean. Efficient neural architecture
  search via parameter sharing. In ICML, 2018.
Esteban Real, Alok Aggarwal, Yanping Huang, and Quoc V Le. Regularized evolution for image
  classifier architecture search. In AAAI, volume 33, pp. 4780–4789, 2019.
Karthik A Sankararaman, Soham De, Zheng Xu, W Ronny Huang, and Tom Goldstein. The impact
  of neural network overparameterization on gradient confusion and stochastic gradient descent. In
  ICML, 2020.
Yao Shu, Wei Wang, and Shaofeng Cai. Understanding architectures learnt by cell-based neural
  architecture search. In ICLR, 2020.
Nitish Srivastava, Geoffrey Hinton, Alex Krizhevsky, Ilya Sutskever, and Ruslan Salakhutdinov.
  Dropout: a simple way to prevent neural networks from overfitting. JMLR, 15(1):1929–1958,
  2014.
Christian Szegedy, Wei Liu, Yangqing Jia, Pierre Sermanet, Scott Reed, Dragomir Anguelov, Du-
  mitru Erhan, Vincent Vanhoucke, and Andrew Rabinovich. Going deeper with convolutions. In
  IEEE CVPR, pp. 1–9, 2015.
Mingxing Tan, Bo Chen, Ruoming Pang, Vijay Vasudevan, Mark Sandler, Andrew Howard, and
 Quoc V Le. Mnasnet: Platform-aware neural architecture search for mobile. In IEEE CVPR, pp.
 2820–2828, 2019.
Xiaoxing Wang, Chao Xue, Junchi Yan, Xiaokang Yang, Yonggang Hu, and Kewei Sun. MergeNAS:
  Merge operations into one for differentiable architecture search. In IJCAI, pp. 3065–3072, 2020.
Lingxi Xie and Alan Yuille. Genetic cnn. In IEEE CVPR, pp. 1379–1388, 2017.
Sirui Xie, Hehui Zheng, Chunxiao Liu, and Liang Lin. SNAS: stochastic neural architecture search.
  In ICLR, 2019.
Yuhui Xu, Lingxi Xie, Xiaopeng Zhang, Xin Chen, Guo-Jun Qi, Qi Tian, and Hongkai Xiong. PC-
  DARTS: Partial channel connections for memory-efficient architecture search. In ICLR, 2020.
Arber Zela, Thomas Elsken, Tonmoy Saikia, Yassine Marrakchi, Thomas Brox, and Frank Hutter.
  Understanding and robustifying differentiable architecture search. In ICLR, 2020.
Xiangyu Zhang, Xinyu Zhou, Mengxiao Lin, and Jian Sun. Shufflenet: An extremely efficient
  convolutional neural network for mobile devices. In IEEE CVPR, pp. 6848–6856, 2018.
Barret Zoph and Quoc V Le. Neural architecture search with reinforcement learning. In ICLR, 2017.
Barret Zoph, Vijay Vasudevan, Jonathon Shlens, and Quoc V Le. Learning transferable architectures
  for scalable image recognition. In IEEE CVPR, pp. 8697–8710, 2018.

                                               10
Under review as a conference paper at ICLR 2021
A D ETAILED E XPERIMENTAL S ETTINGS
A.1 C ORRELATION BETWEEN E DGE I MPORTANCE AND M ODEL ACCURACY
The following is the detailed settings for calculating the correlation between edge importance and
model accuracy in Figure 1. We use the official public code of DARTS to search on CIFAR10.
After searching, we enumerate all pairwise combinations of 5 edges of the last intermediate node,
resulting in total 10 edge combinations. For DARTS, edge importance is indicated by the largest
operation weight (excluding the Zero operation) on this edge. We sum its two edge importance as
the importance of an edge combination. In contrast, the edge combination weight of DOTS can
directly represent the importance of an edge combination. The stand-alone model is trained with
the same settings in Section A.2, except that we reduce the number of training epochs to 300. The
results are depicted in Figure 1.
A.2 D ETAILED S EARCH S ETTINGS FOR B ENCHMARKING
CIFAR. The whole search process takes 60 epochs, i.e., 25 epochs for the operation search stage
and 35 epochs for the topology search stage. We pretrain the first 15 epochs of both two stages
by only updating network weights. The SGD optimizer is adopted to optimize the network weight
w with an initial learning rate of 0.025 (cosine decaying to 0.001 in 60 epochs), weight decay of
3e-4, and momentum of 0.9. For architecture weights α and β, we use the Adam optimizer with
a constant learning weight of 1e-4 and weight decay of 1e-3 for both stages. We set T0 = 10 and
θ = 0.65 in Eq. 5 for annealing operation weights, while we set T0 = 10 and θ = 0.72 for annealing
edge combination weights. The temperature ends at 0.2 and 0.02 for operation search and topology
search, respectively.
ImageNet. The search process of ImageNet takes 60 epochs, where both operation search and
topology search stages take 30 epochs separately. Both stages pretrain for 15 epochs. The SGD
optimizer is used to optimize the network weight w with an initial learning rate of 0.5 (cosine
decaying to 0 in 60 epochs), weight decay of 3e-4, and momentum of 0.9. For the architecture
parameters α, we use the Adam optimizer with a constant learning weight of 6e-3 and weight decay
of 1e-3 for both stages. We set T0 = 10 and θ = 0.75 in Eq. 5 for annealing operation weights,
while we set T0 = 10 and θ = 0.64 for annealing edge combination weights. The temperature ends
at 0.1 and 0.01 for operation search and topology search, respectively.
B D ISCUSSION ABOUT THE DIFFERENCES BETWEEN DARTS AND DOTS
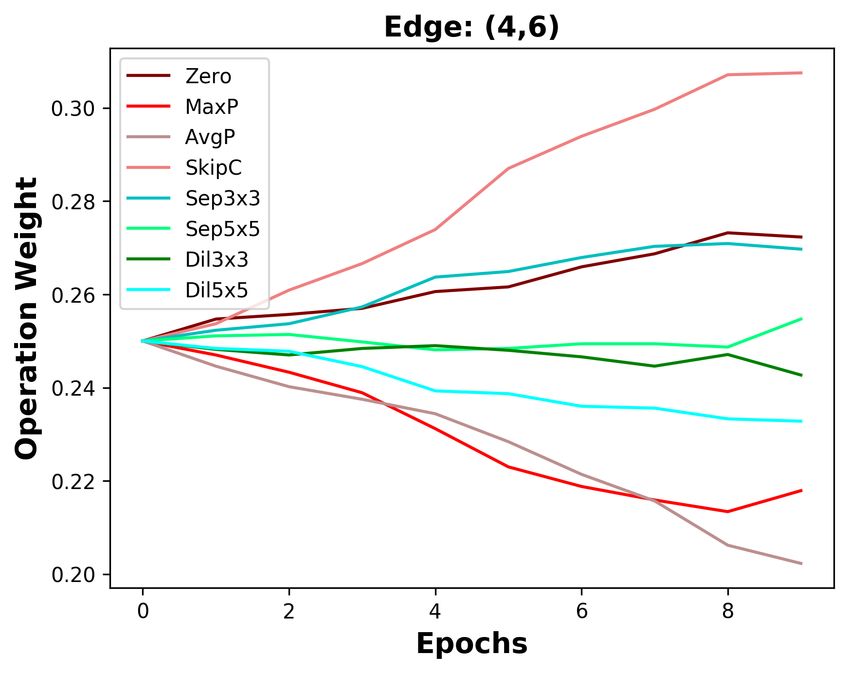
We analyze the five edges connected to the last intermediate node. As depicted in Figure 3a, the
operation weights are affected by the Zero operation in DARTS. The weight of the Zero operation
ends at 0.4 on the shallow edge (0, 5), while it increases to 0.9 on the deepest edge (4, 5). With
the increasing weight of the Zero operation, the weights of other operations on five edges are all de-
creasing. Since the operation weights on shallow edges decrease more slowly, the operation weights
on shallow edges are larger than that on deep edges. Based on DARTS’ policy that edge importance
is the largest operation weight (except the Zero operation), the two shallowest edges are always re-
tained. By decoupling operation search and topology search, the instability of operation search has
no impact on choosing the optimal edges. As the result in Section 4.3, we do not change DARTS’
searched operations but re-search its topology, decreasing DARTS’ top-1 error by 0.36%.
Since DARTS’ operation search is not stable, we aim to design a stable operation search method, i.e.,
group annealing operation search. As depicted in Figure 3b, we divide the candidate operations into
two groups. The Zero operation competes with other non-parameterized operations and has no clear
advantage, except on the deepest edge. Whatever the non-parameterized operation weights evolve, it
will not affect the parameterized operation weights. In a word, we encourage fair competition within
each group and avoid unfair competition between groups, making operation search more stable. The
candidate operations searched by group annealing operation search are listed in Table 7, Table 8, and
Table 9. By replacing DARTS’ operation search with group annealing operation search, we further
decrease the top-1 error by 0.15%.
11Under review as a conference paper at ICLR 2021
(a) DARTS (b) DOTS
Figure 3: Operation weight evolution during training in DARTS and DOTS. For DOTS, we plot the
operation weights without annealing.
12Under review as a conference paper at ICLR 2021
Table 7: The operations retained for each group after operation search on CIFAR10.
EdgeID 1 2 3 4 5 6 7
OP Group 1 SkipC SkipC SkipC SkipC SkipC SkipC SkipC
OP Group 2 Sep3x3 Sep3x3 Sep3x3 Sep3x3 Sep3x3 Dil3x3 Sep3x3
EdgeID 8 9 10 11 12 13 14
OP Group 1 SkipC Zero SkipC SkipC SkipC SkipC Zero
OP Group 2 Sep5x5 Dil5x5 Sep3x3 Sep3x3 Sep5x5 Sep3x3 Sep3x3
(a) Normal Cell
EdgeID 1 2 3 4 5 6 7
OP Group 1 AvgP Zero AvgP AvgP SkipC AvgP AvgP
OP Group 2 Dil5x5 Dil3x3 Sep5x5 Dil3x3 Dil5x5 Dil3x3 Dil5x5
EdgeID 8 9 10 11 12 13 14
OP Group 1 SkipC Zero AvgP AvgP SkipC SkipC Zero
OP Group 2 Sep5x5 Sep3x3 Dil3x3 Sep3x3 Dil5x5 Dil5x5 Sep5x5
(b) Reduction Cell
Table 8: The operations retained for each group after operation search on CIFAR100.
EdgeID 1 2 3 4 5 6 7
OP Group 1 SkipC SkipC SkipC SkipC SkipC SkipC SkipC
OP Group 2 Sep3x3 Sep3x3 Sep3x3 Sep3x3 Dil5x5 Sep5x5 Sep3x3
EdgeID 8 9 10 11 12 13 14
OP Group 1 SkipC Zero SkipC SkipC SkipC SkipC Zero
OP Group 2 Sep5x5 Sep3x3 Sep5x5 Dil5x5 Sep3x3 Dil3x3 Dil3x3
(a) Normal Cell
EdgeID 1 2 3 4 5 6 7
OP Group 1 SkipC Zero AvgP MaxP SkipC AvgP MaxP
OP Group 2 Sep3x3 Sep3x3 Sep3x3 Dil5x5 Dil5x5 Dil5x5 Sep3x3
EdgeID 8 9 10 11 12 13 14
OP Group 1 SkipC Zero AvgP MaxP SkipC SkipC Zero
OP Group 2 Dil5x5 Dil5x5 Sep3x3 Sep3x3 Dil5x5 Dil5x5 Dil5x5
(b) Reduction Cell
Table 9: The operations retained for each group after operation search on ImageNet.
EdgeID 1 2 3 4 5 6 7
OP Group 1 SkipC SkipC SkipC SkipC Zero Zero SkipC
OP Group 2 Dil5x5 Dil3x3 Sep3x3 Sep3x3 Sep3x3 Sep3x3 Sep3x3
EdgeID 8 9 10 11 12 13 14
OP Group 1 SkipC Zero Zero SkipC Zero Zero Zero
OP Group 2 Sep3x3 Sep3x3 Sep3x3 Sep5x5 Sep3x3 Dil5x5 Sep3x3
(a) Normal Cell
EdgeID 1 2 3 4 5 6 7
OP Group 1 Zero SkipC Zero SkipC Zero MaxP AvgP
OP Group 2 Sep5x5 Sep3x3 Sep3x3 Sep5x5 Dil5x5 Sep3x3 Sep5x5
EdgeID 8 9 10 11 12 13 14
OP Group 1 Zero Zero MaxP MaxP SkipC Zero Zero
OP Group 2 Sep5x5 Dil5x5 Sep3x3 Dil3x3 Sep3x3 Sep3x3 Sep3x3
(b) Reduction Cell
13Under review as a conference paper at ICLR 2021
(a) Normal Cell (b) Reduction Cell
Figure 4: Normal cell and reduction cell found by DOTS on CIFAR10.
(a) Normal Cell (b) Reduction Cell
Figure 5: Normal cell and reduction cell found by DOTS on CIFAR100.
(a) Normal Cell (b) Reduction Cell
Figure 6: Normal cell and reduction cell found by DOTS on ImageNet.
Table 10: Comparison with state-of-the-art NAS algorithms on CIFAR100. † marks the results
reported by Chu et al. (2020), and ‡ marks the results taken from the original papers.
Params Search Cost
Architecture Test Err. (%) (M) (GPU Days) Search Method
ResNet (He et al., 2016) 22.10† 1.7 N/A N/A
DenseNet-BC (Huang et al., 2017) 17.18† 25.6 N/A N/A
AmoebaNet (Real et al., 2019) 18.93† 3.1 3150 EA
PNAS (Liu et al., 2018a) 19.53† 3.2 150 SMBO
ENAS (Pham et al., 2018) 19.43† 4.6 0.45 RL
DARTS (2nd) (Liu et al., 2019) 17.54† 3.4 1 GD
GDAS (Dong & Yang, 2019) 18.38† 3.4 0.2 GD
P-DARTS (Chen et al., 2019) 17.49† 3.6 0.3 GD
DropNAS (Hong et al., 2020) 16.39‡ 4.4 0.7 GD
DARTS- (Chu et al., 2020) 17.16‡ 3.4 0.4 GD
DOTS 15.75 4.2 0.2 GD
C A DDITIONAL B ENCHMARKING R ESULTS
We benchmark DOTS on CIFAR100 in Table 10. The search setting and the evaluation setting is the
same as that on CIFAR10. DOTS decreases the top-1 error of DropNAS by 0.64% and reduces the
search cost by 0.5 GPU-Days. We visualize the searched cells in Figure 4, Figure 5, and Figure 6.
14You can also read