Efficient Extraction of Information from Correlation Matrix for Product Design using an Integrated QFD-DEMATEL Method - CAD Journal
←
→
Page content transcription
If your browser does not render page correctly, please read the page content below
1131

 Efficient Extraction of Information from Correlation Matrix for
 Product Design using an Integrated QFD-DEMATEL Method

 Hamid Reza Fazeli1 and Qingjin Peng2

 1University of Manitoba, fazelihr@myumanitoba.ca
 2University of Manitoba, Qingjin.Peng@umanitoba.ca

 Corresponding author: Qingjin Peng, Qingjin.Peng@umanitoba.ca

 Abstract. Decision of importance rating of technical requirements in House of Quality
 is very important in the quality function deployment process of product design. The
 correlation matrix in the roof of House of Quality is seldom used by designers as it is
 difficult to quantify interactions of technical requirements. Although there are a few
 studies addressed effects of the correlation matrix of House of Quality, very few of
 them discussed a systematic evaluation for interactions of technical requirements
 using information of the roof part in House of Quality. A significant gap exists in the
 efficient extraction of information from the correlation matrix. This paper introduces
 a method for analyzing the roof data of House of Quality to extract additional
 information of correlations between technical requirements based on the decision-
 making trial and evaluation laboratory, analytic network process, and quality function
 deployment. A case study of designing a hand rehabilitation device is presented to
 demonstrate advantages of the proposed method.

 Keywords: Product design, House of quality (HOQ), DEMATEL, Quality function
 deployment (QFD), Correlation matrix.
 DOI: https://doi.org/10.14733/cadaps.2021.1131-1145

1 INTRODUCTION
The global competitive market requires products to meet the high customer satisfaction, low
production cost and short product development cycle [16]. Product functions are decided in the
design stage. A variety of design concepts can be proposed for the product functions to meet
customer requirements (CRs) based on design constraints. Quality Function Deployment (QFD) is an
approach for mapping CRs to technical requirements (TRs) and guiding designers to search product
solutions. The International Organization for Standardization (ISO) defines QFD in the ISO 16355
standard as a method to assure customer satisfaction by designing products in different levels and
perspectives [24]. QFD usually consists of two major processes, extracting voice of customers and
transferring TRs to product attributes [17]. The QFD decomposition provides valuable information
for product design to convert CRs into a measurable process of implementation of product functions.

 Computer-Aided Design & Applications, 18(5), 2021, 1131-1145
 © 2021 CAD Solutions, LLC, http://www.cad-journal.net
1132

 House of Quality (HOQ) is an essential mapping tool in QFD for designers to find TRs of design
concepts and their importance weights. Using HOQ, relations of CRs and TRs can be identified to
analyze their effects [14]. Relationship matrix and correlation matrix are two key parts in HOQ
templates. The relationship matrix for TRs and CRs is used to find importance weight of TRs.
Moreover, effects of TRs on each other are represented in a correlation matrix which is a triangle-
shaped 'roof' of HOQ. As HOQ is applied in a hierarchy structure of QFD, weights of TRs have a big
impact on design solutions. Inaccurate data in HOQ can lead to an error propagation into other QFD
matrices and undesirable products [18]. A considerable amount of research has been conducted for
improving the HOQ template and data analysis. However, most of the existing studies focused on
enhancing the relationship matrix in HOQ to find the importance weight of TRs [13]. For example,
QFD was integrated with methods of Information Entropy [21], Fuzzy Logic [10, 11], Kano [4], and
AHP [23, 26].
 A variety of models of the data relationship in HOQ have been suggested. The correlation matrix
in the roof of HOQ is seldom used by designers as it is difficult to quantify interactions of TRs [8]. In
most of HOQ approaches, designers focus on mapping CRs to related TRs and decide importance
weights by relations between CRs and TRs. However, data in the correlation matrix are not
considered during this process. As some of TRs may not be mutually exclusive in a design solution,
it is necessary to model TR interactions in the design process. Generally, relations in the roof matrix
are represented with signs or numbers for the degree of correlations between TRs. However,
information based on this representation is not clear enough to provide designers details in
considering all of TRs interactions [8]. Some methods, such as the Wasserman normalization for
incorporating TRs interactions in determining importance weights, may produce an unacceptable
outcome [7]. Another problem in the roof part of HOQ is that the intersection between two TRs
shows only their effect degree, we cannot conclude whether they have the same effect on each
other. For example, a TR may have a strong effect on another TR, but it doesn’t necessarily mean
that the reverse is the same.
 Most of previous research on the roof part of HOQ focused on solving conflicts between technical
details using methods like theory of innovation problem solving (TRIZ) [28] and data envelopment
analysis (DEA) [29]. A few studies were applied effects of the correlation matrix with TRs’ weights
to select TRs. For example, a weighted average method was used to prioritize and rank TRs [20].
But if TRs have an equal strength of correlations, their weights will remain the same. In another
research, a method was introduced to search correlations between TRs for importance weights [6].
In this work, by adding all of correlation values located at each intersection of TRs, the average
weight was decided by multiplying weights in the relationship matrix to re-prioritize TRs. But this
method decides correlation coefficients at the criterion level, not the sub-criterion level. In another
study, an improved QFD framework was presented for the service quality management [3]. An
integrated QFD-AHP-ANP approach was introduced for analysis of relations and correlations of TRs.
In the proposed integrated framework, an analytic hierarchy process (AHP) method was used for
analysis of the relationship matrix, and an analytic network process (ANP) was applied for modeling
interdependence of TRs in the roof part of HOQ. However, this method was reported time-consuming
as it requires many pairwise comparisons in the process. A similar study used the ANP approach for
investigating inner dependencies and relations within HOQ to decide overall weights of TRs [2]. A
recent study proposed an approach for resolving contradictions of CRs using TRIZ tools and adjusting
TRs’ weights in HOQ [19]. A side roof was added to a HOQ template for finding contradictions among
CRs. Information in the roof part of HOQ was used for TRs re-prioritization. Signs were used to show
correlations among TRs, but the impact of differences of correlation values was not investigated.
Correlation values were suggested to use instead of conventional signs in the roof part of HOQ.
Therefore, it is necessary to quantify whether a TR has more effect than others.
 Although there are a few studies addressed effects of the correlation matrix of HOQ on the QFD
process, based on our knowledge, none of them provides a systematic method to decide TRs
interactions and their influence on each other for design solutions using information of the roof part
in HOQ. Moreover, even literature on the prioritization of TRs is vast, a significant gap exists in the
efficient extraction of information from the correlation matrix. To improve the above-mentioned

 Computer-Aided Design & Applications, 18(5), 2021, 1131-1145
 © 2021 CAD Solutions, LLC, http://www.cad-journal.net
1133

limitations, this paper introduces a method for analyzing the roof data of HOQ to extract additional
information of correlations between TRs. The method integrates the decision-making trial and
evaluation laboratory (DEMATEL), analytic network process, and QFD to model interrelations of TRs.
DEMATEL is used for understanding of the correlation and interdependence of TRs through analysis
of TRs in cause and effect relations. The final weight is obtained from an ANP super-matrix. The
main contribution of our method is the integration of DEMATEL-based analytic network process with
QFD to analyze data in the roof part of HOQ and decide final weights of TRs. Handling correlations
in HOQ with DEAMETL to evaluate relations between TRs and establishing direct and indirect causal
relationships and influence levels are also novel to the literature. Another contribution of this work
is the DEMATEL-based analytic network process to efficiently model interrelations among TRs and
remove time-consuming pairwise comparisons.
 The following section presents a framework of the proposed method to derive influential weights
of TRs. Design of a hand rehabilitation device in the case study verifies the proposed method in
Section 3, followed by conclusions and further work in Section 4.

2 PROPOSED METHOD
2.1 Quality Function Deployment (QFD)
QFD is a structured approach to transform qualitative customers’ requirements into quantitative
product characteristics and map product functions into design concepts. From a technical viewpoint,
HOQ as a tool of QFD applies forms of the matrix and table to translate voice of customers into
design solutions [12]. A general form of HOQ is shown in Figure 1.

 (D) Correlation Matrix

 (B) Technical Requirements (TRs)

 TR 1 TR 2 ... ... ... TR n

 CR 1
 Competitive
 Requirements (CRs)

 Benchmarking
 CR 2

 ...
 Product 2
 Product 1

 ...

 (C) Relationship Matrix
 ...
 (A) Customer

 ...

 CR m

 W1 W2 ... ... ... Wn

 (E) Relative Weight

 Figure 1: A general form of HOQ.

HOQ provides a tool to establish relationships between CRs (Whats) and TRs (Hows) by a
combination of following matrices: (A) Whats matrix, (B) Hows matrix, (C) Central relationship

 Computer-Aided Design & Applications, 18(5), 2021, 1131-1145
 © 2021 CAD Solutions, LLC, http://www.cad-journal.net
1134

matrix between WHATs and HOWs, (D) Interrelationship matrix among HOWs, and (E) Matrix of
weights of HOWs. In the relationship matrix, a scaling system (such as 1-3-9) is usually employed
to represent the degree of strength (weak–medium–strong) between each pair of CRs and TRs [27].
The importance weight of each TR can be obtained from the relationship matrix and CRs weight as
follows.

 = ∑ . (2.1)
 =1
where signifies the weight of and ∑ = 1 ; is the relation value between and and
is the number of CRs. can be normalized for each TR as follows.

 = (1.2)
 ∑ =1

where is the number of TRs. Based on calculated , the relative technical importance can be used
for prioritization of TRs. Although Equation (2.2) can be used to decide the importance weight of TRs
based on the relationship matrix of HOQ, the solution is inaccurate as dependencies among TRs are
not considered. In general, in most of HOQ templates, it is assumed that TRs are mutually
independent. But this assumption is not practical in real design problems. As a result, the technical
correlation matrix (the triangular shaped matrix shown in Figure 1) between each pair of TRs should
be taken into account in the calculation of normalized weights of TRs. In the following section, a
method is proposed to solve this problem based on combined ANP and DEMATEL.

2.2 Decision Making Trial and Evaluation Laboratory (DEMATEL)
DEMATEL provides a comprehensive process to obtain a structural model of casual relationships
among criteria in complex decision-making problems [22]. Comparing with other techniques like
AHP, it has advantages such as modeling interdependence between factors via the causal diagram,
which is ignored in traditional methods [15]. This research applies the DEMATEL technique to
evaluate interdependent relationships between TRs in HOQ and divide them into cause and effect
groups.
 Figure 2 shows two forms of the correlation matrix in HOQ. In a common HOQ as shown in Figure
1, it is assumed that TRs have the equal effect in intersections of the correlation matrix, which results
in a triangular shape of the roof. However, this simplified assumption affects the TRs selection in
design. For real-world design problems, a square-shaped form of the roof is suggested for
considering unequal mutual interactions. The suggested form is a non-symmetric square matrix that
includes design information from both directions of correlations. Data can be collected from users
and experts to indicate degrees of the direct effect of TRs on each other in the correlation matrix
with a scale range such as from 0 for no effect to 4 for very high effect. An initial matrix A can be
formed either by converting the triangular shape correlation matrix into a symmetric square matrix
or using a non-symmetric square matrix as follows.

 11 ⋯ 1 ⋯ 1
 ⋮ ⋮ ⋮
 = 1 ⋯ ⋯ (2.3)
 ⋮ ⋮ ⋮
 [ 1 ⋯ ⋯ ]

N is a normalized initial influence-relation matrix which is shaped by normalizing average matrix A.
 = × , >0 (2.2)

 Computer-Aided Design & Applications, 18(5), 2021, 1131-1145
 © 2021 CAD Solutions, LLC, http://www.cad-journal.net
1135

or
 [ ]
 ×
 = [ ]
 ×
 , > 0, , {1,2, … , } (2.3)

Where the value s can be obtained as follows.
 1
 =
 (∑ =1 , ∑ =1 )

 (2.4)

 lim = [0] × , 0 ≤ ≤ 1 (2.5)
 →∞

 TR 1

 TR 2

 ...

 Correlation Matrix
 Correlation Matrix ...

 ...
 TR 1 TR 2 ... ... ... TR n

 TR m

 TR 1 TR 2 ... ... ... TR n

 (a) (b)
 Figure 2: Two forms of the correlation matrix in HOQ.

 The total influence matrix T is an n × n matrix as follows.

 = + 2 + ⋯ +
 = ( + + 2 + ⋯ + −1 )
 (2.6)
 = ( + + 2 + ⋯ + −1 )( − )( − )−1
 = ( − )−1 , ℎ lim = [0] ×
 →∞

where is an × matrix. The sum of columns and rows in total influence matrix T can be
characterized as R and C vectors as follows.

 = [ ] ×1 = (∑ ) (2.7)
 =1
 ×1
 ′
 ′
 = [ ]
 1×
 = (∑ ) (2.8)
 =1 1×
where is a member of vector R, is a member of vector C, and tij represents each member of total
influence matrix T. In the following section, ANP and its process are presented to solve
interdependence among TRs generated by the DEMATEL to form a super matrix.

 Computer-Aided Design & Applications, 18(5), 2021, 1131-1145
 © 2021 CAD Solutions, LLC, http://www.cad-journal.net
1136 2.3 Analytic Network Process (ANP) ANP is a decision-making technique to systematically model all kinds of dependence among criteria by considering all relations as networks [9]. We use it to analyze the total influence matrix formed by DEMATEL. TRs with same characteristics in a large HOQ can be grouped into small sized clusters based on similar criteria. For example, we can form a cost sub-matrix including manufacturing cost and operation cost. In small HOQs, each TR can be considered as a separate dimension. Figure 3 shows a detail algorithm of the proposed method. The structure of the total-influenced matrix for sub-criterion is shown below. Proposed Algorithm Input: Modified correlation matrix = [ ] , = 1,2, … , (Number of × respondents) Output: Improved weights of TRs 1: = 1 2: for = 2 3: ( ) = + 4: end for 5: = ⁄ //Calculating the initial average matrix 6: for = 1 7: ( ) = ( ) 8: end for 9: for = 1 10: Q( ) = ( ) 11: end for 12: = /max ( , ) //Calculating normalized initial average matrix 13: = ( − )−1 //Calculating the total influence matrix 14: for = 1 15: ( ) = ( ) 16: end for 17: for = 1 18: R( ) = ( ) 19: end for 20: for each ∈ 21: = ∑ =1 22: = //Calculating normalized total influence-relation matrix 23: end 24: = ( )′ //Obtaining unweighted super matrix 25: for each ∈ ∑ =1 ∑ =1 26: = × 27: end 28: Construct total influence-relation matrix of criteria 29: Calculate normalized total influence-relation matrix 30: = × //Calculating weighted super matrix 31: ℎ < //Calculating weighted super matrix 32: = ( )′ //Obtaining unweighted super matrix 33: ℎ = ( ) //Obtaining unweighted super matrix →∞ 34: end Figure 3: Proposed algorithm for calculating influential weights of TRs. Computer-Aided Design & Applications, 18(5), 2021, 1131-1145 © 2021 CAD Solutions, LLC, http://www.cad-journal.net
1137

 1 … …

 11 11 … 1 1 … 1 … … 1 …
 ⋮
 1
 1 1 1 11 ⋯ ⋯ 1
 ⋮
 = ⋮ 1 ⋮ ⋮ ⋮ (2.9)
 ⋮
 1
 ⋯ ⋯
 ⋮
 ⋮ 1 ⋮ ⋮ ⋮
 ⋮
 [ 1 ⋯

 ⋯ ]

where symbolizes the th criterion; represents the th sub-criterion in the th criterion. In
order to use this matrix to decide the inner dependency, it should be first normalized and then
transposed. Each sub-criterion can be normalized as follows.
 1

 11 11
 = ∑ , = 1,2, … 1 (2.10)
 =1

 11
 11
 11
 1
 11
 1 1
 ⋯ ⋯
 11
 1 11
 1 11
 1

 ⋮ ⋮ ⋮

 11 11

 11
 1
 11 = 1
 ⋯ ⋯ (2.11)
 11
 11
 11

 ⋮ ⋮ ⋮

 11
 1 1
 11
 1
 11
 1 1
 11 ⋯ ⋯
 [ 1 11
 1 11
 1 ]

 After normalizing matrix , a new matrix is obtained as Equation (2.14).

 1 … …

 11 11 … 1 1 … 1 … … 1 …
 ⋮
 1
 1 1 1 11 ⋯ ⋯ 1
 ⋮
 = ⋮ 1 ⋮ ⋮ ⋮ (2.12)
 ⋮
 1
 ⋯ ⋯
 ⋮
 ⋮ 1 ⋮ ⋮ ⋮
 ⋮
 [ 1 ⋯

 ⋯ ]

 Computer-Aided Design & Applications, 18(5), 2021, 1131-1145
 © 2021 CAD Solutions, LLC, http://www.cad-journal.net
1138

Unweighted super matrix Q is a transpose of normalized total influence-relation matrix .

 = ( )′ (2.13)

The weighted super matrix is calculated by multiplying the normalized total influence-relation matrix
of dimensions and unweighted super matrix as follows.

 = × (2.14)

The weighted super matrix is then limited to a large power until it converges in a stable super-
matrix. Influential weights are then used in HOQ to obtain the final weight of TRs.

 ℎ = lim ( ) (2.15)
 →∞

3 CASE STUDY
3.1 Design of a Hand Rehabilitation Device
Design of rehabilitation devices is a complex decision-making process as different assumptions and
constraints have to be considered. In this case study, CRs and their weights were collected from
literature [5]. Figure 4 shows a HOQ of the design problem. Its left column shows CRs with their
weights. In order to meet these requirements and quantify quality characteristics of design concepts,
13 TRs were identified based on benchmarking products [1, 25]. The relationship matrix in the HOQ
provides relations of CRs and TRs. Only this matrix is used to decide importance weights of TRs in
the traditional HOQ template. However, there may be some TRs with close correlations to affect each
other for the design solution. For example, the deriving method has a big impact on the device noise
and motion velocity of the structure. It is not enough to decide TRs’ weights based on TRs interactions
with CRs only. It is therefore necessary to find interrelations of TRs using the correlation matrix in
the roof of HOQ.

3.2 TRs Weights based on Different Roof Shapes
Two scenarios are investigated to compare with the traditional HOQ method. The first one uses the
triangular shape roof of HOQ as shown in Figure 4 to form a symmetric initial correlation matrix. The
second uses a square asymmetric correlation matrix as shown in Table 1. After normalizing the initial
data, total-influenced matrix can be formed using Equation (2.11) for both cases. In matrix Tc, D
and R are calculated by adding elements of each row and column in the matrix, respectively.
Elements of each row (D) are added for each TR to find its effectiveness on other TRs. Elements of
each column (R) are added for each TR to find the total effects (both direct and indirect) received
from other factors, or effectiveness of variables. These parameters show effects of TRs on each other.
Figure 5 shows prominence-causal relations of TRs obtained by the total influence-relation matrix Tc
for both cases, where the horizontal vector (D+R) is amount of TR interactions. In other words, it
shows amount of TR interactions and a central role of each TR. The vertical vector (D-R) indicates
the effect power of each TR. Therefore, a positive (D-R) shows the causal parameter, otherwise, the
parameter receives influence from other TRs. For the first scenario, as the initial matrix is symmetric,
all of D-R values are zero, meaning that TRs have the same effect on each other. The horizontal axis
however shows important TRs. For the second scenario, it can be concluded that the structure type
has a big impact on other TRs, motion velocities and structure size have effects from other TRs.

 Computer-Aided Design & Applications, 18(5), 2021, 1131-1145
 © 2021 CAD Solutions, LLC, http://www.cad-journal.net
1139

 Correlations

 Positive +
 1
 Negative −
 1
 No Correlation

 Relationships 1 1 4 1
 Strong ●
 Moderate ○ 2 3
 Weak ▽ 1 1 1
 4
 Direction of Improvement
 2 2 1 1
 Maximize ▲
 2 1 1
 Target ◇
 2 1 1 2 3 1 1
 Minimize ▼
 2 1 1 1 1 1 3 1

 Column # 1 2 3 4 5 6 7 8 9 10 11 12 13

 Range of Motion (ROM)
 Requirements
 Technical

 Degrees of freedom

 Component noise
 Motion velocities
 Adjustable Parts
 Maximum Relationship

 Component type
 Driving method

 Control method
 Structure type
 Customer Importance

 Structure size

 Material type
 Applied force
 Sensor type
 Relative Weight

 Competitor #1

 Competitor #2

 Competitor #3
 Weight Chart

 Customer
 Requirements
 Row #

 Row #
 (Explicit and 0 1 2 3 4 5
 Implicit)

 1 |||| 10% 7 5 Light weight 3 5 5 1 1 3 3 5 5 3 1 5 1

 2 ||||| 11% 8 5 Low price 1 3 3 5 3 3 5 3 1 4 2

 3 |||| 8% 6 5 Easy to use 3 5 3 5 3 3 5 3 4 4 3 3

 4 || 5% 4 9 Easy to Carry 5 9 5 3 3 2 5 4

 6 |||||| 12% 9 5 Safe 5 3 1 5 5 3 3 1 3 5 5 3 6

 7 || 4% 3 9 Low noise 5 9 3 2 3 7

 8 |||| 10% 7 9 Data record and process 9 7 1 4 5 2 8

 9 |||| 10% 7 9 Adaptable to different hand size 5 3 9 5 1 5 5 4 9

 Competitor #1
 10 |||| 8% 6 7 Different injury recovery 5 1 5 3 7 3 3 5 5 4 10
 Competitor #2
 11 | 3% 2 7 Aesthetics 7 1 5 4 5 4 11
 Competitor #3
 12 |||| 8% 6 3 Long operation time 3 1 3 2 4 12

 13 ||||| 11% 8 9 Accurate movements 3 5 5 7 9 1 1 3 3 2 4 3 14
 degrees/se
1140

 Column # 1 2 3 4 5 6 7 8 9 10 11 12 13

 Range of Motion (ROM)
 Degrees of freedom

 Applied velocities

 Component noise
 Adjustable Parts

 Component type
 Driving method

 Control method
 Structure type

 Structure size

 Material type
 Applied force
 Sensor type
Row #

 1 Structure type 0 0.15 0.1 0.05 0 0.2 0.05 0.15 0.05 0.05 0 0 0.05

 2 Structure size 0 0 0.1 0.05 0.05 0 0 0 0 0 0 0 0

 3 Driving method 0.1 0 0 0 0 0 0.15 0.05 0.1 0.15 0.05 0.2 0.1

 4 Adjustable Parts 0.15 0.1 0 0 0 0.05 0 0 0 0 0 0 0.05

 5 Sensor type 0.1 0.05 0 0 0 0 0.15 0 0 0 0 0 0

 6 Degrees of freedom 0.2 0.15 0 0.05 0.1 0 0.05 0.1 0 0.05 0 0 0

 7 Control method 0.1 0 0.1 0 0.05 0 0 0.05 0.1 0.1 0 0 0.05

 8 Range of Motion (ROM)0.15 0.1 0.05 0 0 0.15 0.05 0 0.05 0 0 0 0

 9 Applied velocities 0 0 0.05 0 0.05 0 0 0 0 0 0 0.05 0

10 Applied force 0.1 0 0.1 0 0 0.05 0.05 0 0 0 0.15 0 0.05

11 Material type 0 0.1 0 0 0 0 0 0 0 0.05 0 0 0.05

12 Component noise 0 0 0.2 0 0 0 0 0 0 0 0.05 0 0

13 Component type 0.1 0.15 0 0.05 0 0 0.05 0 0 0 0.05 0.05 0

 Table 1: Normalized square shaped correlation matrix.

 Figure 5: DEMATEL prominence-causal relationship of TRs.

 Computer-Aided Design & Applications, 18(5), 2021, 1131-1145
 © 2021 CAD Solutions, LLC, http://www.cad-journal.net
1141

 Column # 1 2 3 4 5 6 7 8 9 10 11 12 13

 Range of Motion (ROM)
 Degrees of freedom

 Applied velocities

 Component noise
 Adjustable Parts

 Component type
 Driving method

 Control method
 Structure type

 Structure size

 Material type
 Applied force
 Sensor type
 Row #

 1 Structure type 0.10088 0.2075 0.12884 0.28199 0.20827 0.22451 0.16526 0.23564 0.07896 0.15297 0.07368 0.06312 0.17593

 2 Structure size 0.10649 0.05735 0.0659 0.12772 0.1115 0.11933 0.04814 0.09462 0.03424 0.04756 0.10124 0.03502 0.09561

 3 Driving method 0.08405 0.08377 0.07375 0.04906 0.05145 0.0502 0.13151 0.08458 0.16074 0.17605 0.14526 0.33131 0.11156

 4 Adjustable Parts 0.08879 0.07836 0.02368 0.05082 0.03753 0.07176 0.02979 0.04236 0.01448 0.02803 0.01958 0.0147 0.08263

 5 Sensor type 0.06807 0.07101 0.02578 0.03896 0.04469 0.068 0.11229 0.04017 0.12768 0.02602 0.01572 0.01553 0.02908

 Degrees of
 6 0.13906 0.14402 0.04766 0.14116 0.12885 0.0793 0.09783 0.17936 0.04699 0.08659 0.03825 0.02379 0.05597
 freedom

 7 Control method 0.08106 0.046 0.09889 0.0464 0.16851 0.07747 0.05122 0.08409 0.14667 0.08438 0.0383 0.0476 0.08983

 Range of Motion
 8 0.13021 0.10188 0.07164 0.07433 0.06791 0.16001 0.09473 0.07477 0.13876 0.0498 0.02951 0.03459 0.04931
 (ROM)
 Applied
 9 0.01591 0.01344 0.04965 0.00927 0.07871 0.01529 0.06025 0.0506 0.02951 0.01566 0.0139 0.09246 0.01486
 velocities

 10 Applied force 0.07566 0.04584 0.13349 0.04404 0.03938 0.06915 0.08509 0.04458 0.03844 0.06391 0.25864 0.06683 0.09882

 11 Material type 0.02109 0.05648 0.06375 0.01781 0.01377 0.01768 0.02235 0.01529 0.01975 0.1497 0.05153 0.10257 0.07851

 Component
 12 0.01848 0.01997 0.14868 0.01367 0.01391 0.01124 0.02841 0.01833 0.13433 0.03955 0.10488 0.06771 0.07681
 noise

 13 Component type 0.07024 0.07438 0.06828 0.10478 0.03552 0.03608 0.07312 0.03563 0.02944 0.07977 0.1095 0.10476 0.04107

 Table 2: Unweighted super matrix of the device of scenario one.

 Column # 1 2 3 4 5 6 7 8 9 10 11 12 13
 Range of Motion (ROM)
 Degrees of freedom

 Applied velocities

 Component noise
 Adjustable Parts

 Component type
 Driving method

 Control method
 Structure type

 Structure size

 Material type
 Applied force
 Sensor type
Row #

 1 Structure type 0.10192 0.27207 0.12953 0.2859 0.31041 0.2149 0.17368 0.20878 0.05912 0.1706 0.09049 0.065 0.19899

 2 Structure size 0.14196 0.06365 0.04854 0.20918 0.17908 0.15531 0.05239 0.12502 0.02726 0.06495 0.34152 0.03278 0.23931

 3 Driving method 0.09819 0.1777 0.06387 0.05238 0.06222 0.05135 0.14929 0.07891 0.2558 0.14276 0.05596 0.42431 0.06089

 4 Adjustable Parts 0.05999 0.09079 0.0215 0.03582 0.0303 0.06496 0.02323 0.08967 0.00836 0.02201 0.02817 0.01115 0.08777

 5 Sensor type 0.0237 0.07743 0.01181 0.02167 0.02036 0.07825 0.06569 0.02468 0.20456 0.01487 0.01793 0.00619 0.01807

 Degrees of
 6 0.15325 0.05965 0.04054 0.12731 0.06344 0.06297 0.04624 0.14292 0.01614 0.09069 0.0262 0.02029 0.04395
 freedom

 7 Control method 0.06139 0.03339 0.06153 0.03126 0.14632 0.06607 0.03345 0.08997 0.02796 0.07987 0.02383 0.03035 0.08209

 Range of Motion
 8 0.16426 0.07149 0.1039 0.07454 0.07359 0.17809 0.10307 0.06894 0.03502 0.05877 0.0251 0.05084 0.04899
 (ROM)
 Applied
 9 0.05898 0.03488 0.09217 0.02509 0.03644 0.03358 0.13622 0.09157 0.02903 0.03056 0.01251 0.04483 0.02429
 velocities

10 Applied force 0.05378 0.03805 0.12171 0.02547 0.02978 0.05235 0.08269 0.02863 0.03739 0.03925 0.16324 0.06322 0.02417

11 Material type 0.01368 0.01491 0.06184 0.00961 0.00798 0.01002 0.02126 0.00863 0.02669 0.17264 0.03043 0.12867 0.07226

 Component
12 0.02082 0.03247 0.15355 0.01346 0.01302 0.01084 0.03385 0.01798 0.24471 0.02859 0.01684 0.07458 0.07475
 noise

13 Component type 0.04805 0.03353 0.0895 0.08833 0.02705 0.02129 0.07895 0.02431 0.02796 0.08444 0.16779 0.04779 0.02446

 Table 3: Unweighted super matrix of the device of scenario two.

 Computer-Aided Design & Applications, 18(5), 2021, 1131-1145
 © 2021 CAD Solutions, LLC, http://www.cad-journal.net
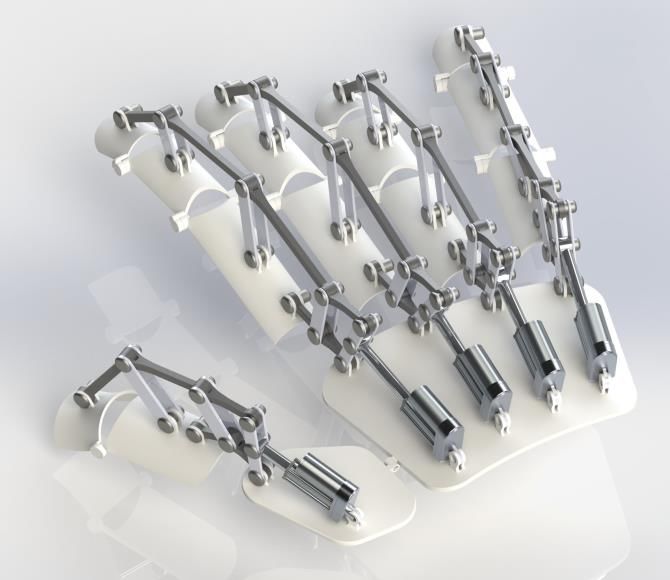
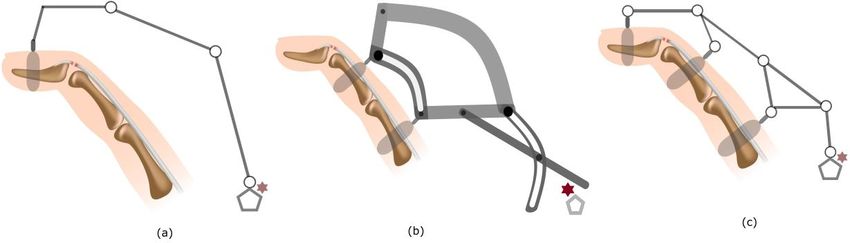
1142

 The modified weights can help designers to choose components and subsystems in a more
accurate way in decision-making of the conceptual design. These weights can be used in a sequence
of HOQs during the QFD process. For example, for selecting a structure type of the rehabilitation
device, designers usually consider factors like the range of motion (ROM), degree of freedom (DOF),
component size, etc. These factors can guide designers to select the right structure according to TRs
weights. Figure 6 shows three different structure solutions based on different weights using the
traditional HOQ, triangle-shaped correlation matrix, and square-shaped correlation matrix,
respectively.
 In results of using the traditional HOQ, weights of structure type and ROM of finger bones lead
to a light finger structure as illustrated in Figure 6 (a). In Scenario 1 (Figure 6 (b)), the weight of
ROM is increased for a heavier finger structure with more ROM. As weights of ROM and structure
type are highest in Scenario 2, the device structure is improved to meet these requirements (Figure
6 (c)). Compared to structures in Figures 6 (a) and (b), this finger structure can cover more ROM,
however, it increases the weight of structure. In all of three cases shown in Figure 6, weights of DOF
are very close. Therefore, all finger structure concepts have only one DOF. The finger structure is
one of the components in hand rehabilitation devices and there are other components like actuator,
motion sensors, etc. to be decided. The selection procedure should be processed similarly using HOQ
to map TRs into component levels and the final concept in a QFD process. The final concept of a
hand rehabilitation device with electromagnetic actuators according to TRs weights from the square
asymmetric correlation matrix is shown in Figure 7. TR 6: Degrees of freedom

 TR 12: Component noise

 TR 13: Component type
 TR 9: Motion velocities
 TR 4: Adjustable Parts

 TR 8: Range of Motion
 TR 3: Driving method

 TR 7: Control method

 TR 11: Material type
 TR 1: Structure type

 TR 10: Applied force
 TR 2: Structure size

 TR 5: Sensor type

 (ROM)

 Traditional HOQ 0.12216 0.09659 0.10284 0.07898 0.08864 0.07386 0.11818 0.06818 0.03409 0.05114 0.03352 0.0375 0.09432

 Scenario 1 (triangle shape
 0.14642 0.08738 0.11593 0.06194 0.06682 0.08963 0.09439 0.07621 0.03245 0.06224 0.03828 0.04091 0.07601
 correlation matrix)
 Scenario 2 (square shape
 0.14757 0.1083 0.11465 0.06406 0.06316 0.07816 0.08517 0.08207 0.04436 0.05576 0.03694 0.04678 0.07302
 correlation matrix)

 Table 4: TRs weights based on the proposed method and traditional approach.

Figure 6: Different structures based on solutions of weights. a) traditional HOQ. b) triangle-shaped
correlation matrix. c) square-shaped correlation matrix.

 Computer-Aided Design & Applications, 18(5), 2021, 1131-1145
 © 2021 CAD Solutions, LLC, http://www.cad-journal.net
1143

Figure 7: The hand rehabilitation device based on the proposed method using the square asymmetric
correlation matrix.

4 CONCLUSIONS
The prioritization of TRs is vital in the QFD process to maximize CRs for a competitive product. This
paper introduced an integrated approach of DEMATEL, ANP, and QFD methods for modeling TRs
correlations in HOQ to decide TR’s weights in product design. It is identified that TRs interactions
cannot be fully considered using the triangular shape correlation matrix in the traditional HOQ. A
square roof of the HOQ template is recommended. The proposed method can model the influence
and interdependence among TRs, which is neglected in the traditional QFD methods. One advantage
of the proposed method is that it doesn’t need the lengthy data process of pairwise comparisons.
The method provides a systematic tool for analyzing interrelations among TRs via prominence-causal
relationships. The case study of design for a hand rehabilitation device verified the proposed method.
It shows that the importance weights of TRs can be updated by considering correlations among the
TRs in the roof part of HOQ. The proposed method can be easily adjusted to solve other design
problems where there are correlations among TRs. In this study, CRs were assumed uncorrelated
each other and they were mutually independent. The impact of correlations of CRs will be a subject
for the future research. It is also recommended to use correlation values instead of conventional
signs in HOQ templates.

ACKNOWLEDGMENTS
The authors wish to acknowledge that this research has been supported by the Discovery Grants
from the Natural Sciences and Engineering Research Council (NSERC) of Canada, University of
Manitoba Graduate Fellowship (UMGF), and the Graduate Enhancement of Tri-Council Stipends
(GETS) program from the University of Manitoba.

Hamid Reza Fazeli, https://orcid.org/0000-0003-1516-0202
Qingjin Peng, https://orcid.org/0000-0002-9664-5326

 Computer-Aided Design & Applications, 18(5), 2021, 1131-1145
 © 2021 CAD Solutions, LLC, http://www.cad-journal.net
1144

REFERENCES
[1] Aggogeri, F.; Mikolajczyk, T.; O’Kane, J.: Robotics for rehabilitation of hand movement in
 stroke survivors, Advances in Mechanical Engineering, 11(4), 2019, 1–14.
 https://doi.org/10.1177/1687814019841921.
[2] Aghdam, M.M.; Mahdavi, I.; shirazi, B.; Vahidi, J.: House of quality improvement by new design
 requirements generation,International Conference on Industrial Engineering and Operations
 Management (IEOM), 2015, 1-9, https://doi.org/10.1109/IEOM.2015.7093821
[3] Andronikidis, A.: The application of quality function deployment in service quality management,
 The TQM Journal, 21(4), 2009, 319-333. https://doi.org/10.1108/17542730910965047.
[4] Avikal, S.; Singh, R.; Rashmi, R.: QFD and Fuzzy Kano model based approach for classification
 of aesthetic attributes of SUV car profile, Journal of Intelligent Manufacturing, 31(2), 2020,
 271-284. https://doi.org/10.1007/s10845-018-1444-5.
[5] Boser, Q.A.; Dawson, M.R.; Schofield, J.S.; Dziwenko, G.; Hebert, J.S.: Defining the design
 requirements for an assistive powered hand exoskeleton, bioRxiv, 2018.
 https://doi.org/10.1101/492124.
[6] Chavoshi, F.; Shahin, A.: Does correlation matrix influence prioritisation of the results of house
 of quality? The case of a manufacturing company, International Journal of Productivity and
 Quality Management, 21(2), 2017, 174-186. https://dx.doi.org/10.1504/IJPQM.2017.083769.
[7] Chen, L.-H.; Chen, C.-N.: Normalisation models for prioritising design requirements for quality
 function deployment processes, International Journal of Production Research, 52(2), 2014,
 299-313. https://doi.org/10.1080/00207543.2013.812813
[8] Iqbal, Z.; Grigg, N.P.; Govindaraju, K.; Campbell-Allen, N.M.: A distance-based methodology
 for increased extraction of information from the roof matrices in QFD studies, International
 Journal of Production Research, 54(11), 2016, 3277-3293.
 https://doi.org/10.1080/00207543.2015.1094585.
[9] Kheybari, S.; Rezaie, F.M.; Farazmand, H.: Analytic network process: An overview of
 applications, Applied Mathematics and Computation, 367, 2020, 124780.
 https://doi.org/10.1016/j.amc.2019.124780.
[10] Kutlu Gündoğdu, F.; Kahraman, C.: A novel spherical fuzzy QFD method and its application to
 the linear delta robot technology development, Engineering Applications of Artificial
 Intelligence, 87, 2020, 103348. https://doi.org/10.1016/j.engappai.2019.103348.
[11] Li, S.; Tang, D.; Wang, Q.: Rating engineering characteristics in open design using a
 probabilistic language method based on fuzzy QFD, Computers & Industrial Engineering, 135,
 2019, 348-358. https://doi.org/10.1016/j.cie.2019.06.008.
[12] Lin, T.; Ekanayake, A.; Gaweshan, L.S.; Hasan, Z.A.: Ergonomics product development of over
 bed table for bedridden patients, Computer-Aided Design and Applications, 13(4), 2016, 538-
 548. http://dx.doi.org/10.1080/16864360.2015.1131550.
[13] Liu, Y.; Han, Y.; Zhou, J.; Chen, Y.; Zhong, S.: Establishing the relationship matrix in QFD
 based on fuzzy regression models with optimized h values, Soft Computing, 22(17), 2018,
 5603-5615. https://doi.org/10.1007/s00500-017-2533-7.
[14] Maritan, D.: Practical Manual of Quality Function Deployment, Springer International
 Publishing, Switzerland 2014.
[15] Mentes, A.; Akyildiz, H.; Helvacioglu, I.H.: A Grey Based Dematel Technıque for Rısk
 Assessment of Cargo Shıps,7th International Conference on Model Transformation ICMT, 2014,
[16] Mingshun, Y.; Ting, Y.; Yanjie, L.; Yubo, Z.: Rating the Customer Requirements based on
 DEMATEL and Entropy, International Journal of Online Engineering, 9, 2013.
[17] Ozlem Erdil, N.; M. Arani, O.: Quality function deployment: more than a design tool,
 International Journal of Quality and Service Sciences, 11(2), 2019, 142-166.
 https://doi.org/10.1108/IJQSS-02-2018-0008
[18] Raharjo, H.: On normalizing the relationship matrix in quality function deployment,
 International Journal of Quality & Reliability Management, 30(6), 2013, 647-661.
 https://doi.org/10.1108/02656711311325601

 Computer-Aided Design & Applications, 18(5), 2021, 1131-1145
 © 2021 CAD Solutions, LLC, http://www.cad-journal.net
1145

[19] Shahin, A.; Bagheri Iraj, E.; Vaez Shahrestani, H.: Developing House of Quality by integrating
 top roof and side roof matrices and service TRIZ with a case study in banking services, The
 TQM Journal, 28(4), 2016, 597-612. https://doi.org/10.1108/TQM-10-2012-0075.
[20] Sharma, J.; Rawani, A.: Ranking engineering characteristics in Quality Function Deployment
 by factoring-in the roof values, International Journal of Productivity and Quality Management,
 3(2), 2008, 223-240. https://dx.doi.org/10.1504/IJPQM.2008.016566.
[21] Shi, Y.; Peng, Q.; Zhang, J.: An Objective Weighting Method of Function Requirements for
 Product Design Using Information Entropy, Computer-Aided Design and Applications, 17(5),
 2019, 966-978. https://doi.org/10.14733/cadaps.2020.966-978.
[22] Si, S.-L.; You, X.-Y.; Liu, H.-C.; Zhang, P.: DEMATEL technique: A systematic review of the
 state-of-the-art literature on methodologies and applications, Mathematical Problems in
 Engineering, 2018, 2018. https://doi.org/10.1155/2018/3696457.
[23] Song, B.; Peng, Q.; Zhang, J.; Gu, P.: A Fuzzy Number based Hierarchy Analytic Method and
 Application in Improvement of Rehabilitation Devices, Computer-Aided Design and
 Applications, 16(2), 2019, 369-381. https://doi.org/10.14733/cadaps.2019.369-381.
[24] Standardization, I.O.f.: Application of statistical and related methods to new technology and
 product development process — Part 1: General principles and perspectives of Quality Function
 Deployment (QFD), ISO 16355-1:2015, Switzerland, 2015.
[25] Suarez-Escobar, M.; Gallego-Sanchez, J.A.; Rendon-Velez, E.: Mechanisms for linkage-driven
 underactuated hand exoskeletons: conceptual design including anatomical and mechanical
 specifications, International Journal on Interactive Design and Manufacturing (IJIDeM), 11(1),
 2017, 55-75. https://doi.org/10.1007/s12008-015-0297-9
[26] Yazdani, M.; Chatterjee, P.; Ebadi Torkayesh, A.: An Integrated AHP-QFD-Based Compromise
 Ranking Model for Sustainable Supplier Selection, Handbook of Research on Interdisciplinary
 Approaches to Decision Making for Sustainable Supply Chains, IGI Global, Hershey, PA, USA,
 2020, pp. 32-54.
[27] Zare Mehrjerdi, Y.: Quality function deployment and its extensions, International Journal of
 Quality & Reliability Management, 27(6), 2010, 616-640.
 https://doi.org/10.1108/02656711011054524
[28] Zhang, F.; Yang, M.; Liu, W.: Using integrated quality function deployment and theory of
 innovation problem solving approach for ergonomic product design, Computers & Industrial
 Engineering, 76, 2014, 60-74. https://doi.org/10.1016/j.cie.2014.07.019.
[29] Zheng, H.; Zhang, H.; Zhang, F.: An innovative design of energy-saving products based on
 QFD/TRIZ/DEA integration,IEEE 17Th International Conference on Industrial Engineering and
 Engineering Management, 2010, 831-834, https://doi.org/10.1109/ICIEEM.2010.5646494

 Computer-Aided Design & Applications, 18(5), 2021, 1131-1145
 © 2021 CAD Solutions, LLC, http://www.cad-journal.net
You can also read