Introduction to the Discovery Studio Visualizer - Adriano ...
←
→
Page content transcription
If your browser does not render page correctly, please read the page content below
Introduction to the Discovery
Studio Visualizer
Introduction
Discovery Studio is a comprehensive software suite for analyzing and modeling molecular
structures, sequences, and other data of relevance to life science researchers. The product includes
functionality for viewing and editing data along with tools for performing basic data analysis.
The Discovery Studio Visualizer is a free viewer that can be used to open data generated by other
software in the Discovery Studio product line. It is designed to offer an interactive environment for
viewing and editing molecular structures, sequences, X-ray reflection data, scripts, and other data. It
also provides a rich set of viewers for displaying plots and other graphical representations of data.
The application runs on Windows and Linux and is a fully integrated desktop environment that
provides access to standard operating system features such as the file system, clipboard, and
printing services.
This application starts by clicking on the icon on the Desktop.

This tutorial covers some (but not all) topics of the program. If you like to know more you can
access the Help system of the program where you can find all information you need and a lot of
tutorials, also this one is taken in part from them. You should also consider that the free version of
the program allows only the complete visualization of molecules and their properties but very
limited possibility of computer chemistry calculations.

Application Workspace
The application workspace occupies the main screen area when the application is opened. By
default, a Welcome page is displayed in this space when the application is first started. As

                                                  1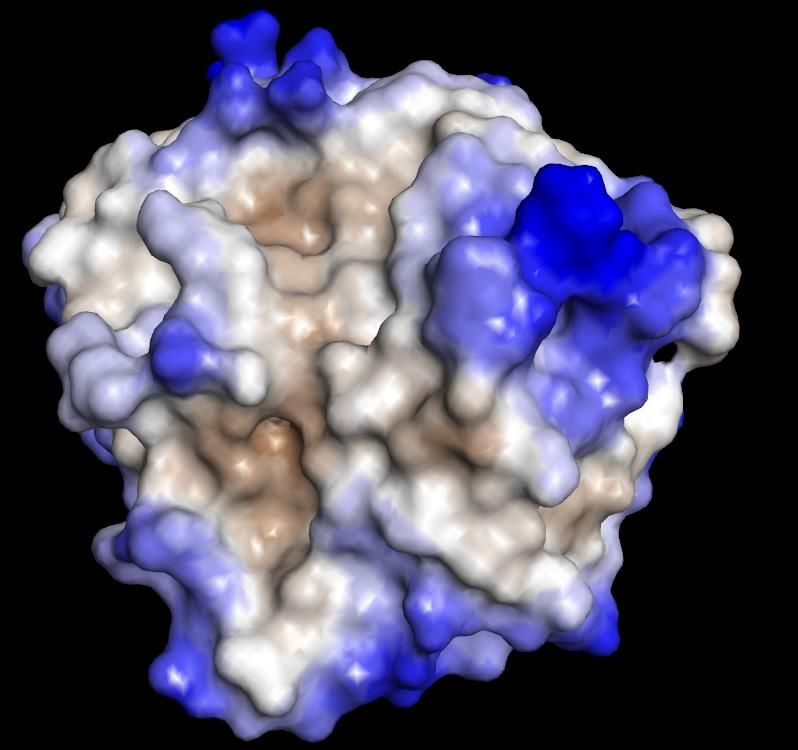
subsequent windows are opened they can be easily arranged to either tile them or arrange them on
top of each other.
Discovery Studio Visualizer features
Feature Description
Feature Search Use this to search and open functionality.
Box
Menu Bar Select menu items to access commonly used tools, such as file access,
editing, and viewing commands.
Toolbars Click buttons to gain access to commonly used tools for viewing and editing
data.
Tool Set Bar Click buttons in the tool set bar to display different groups of related
analysis tools in the Tools Explorer.
Windows The Discovery Studio Visualizer allows you to work with data in a variety
of windows, including:
Molecule Window: Edit and view molecular structures and property data.
Sequence Window: Edit and view sequences and sequence alignments.
Script Window: Create, edit, and execute Perl scripts within the Visualizer.
Status Bar Displays information about the current application activity.
2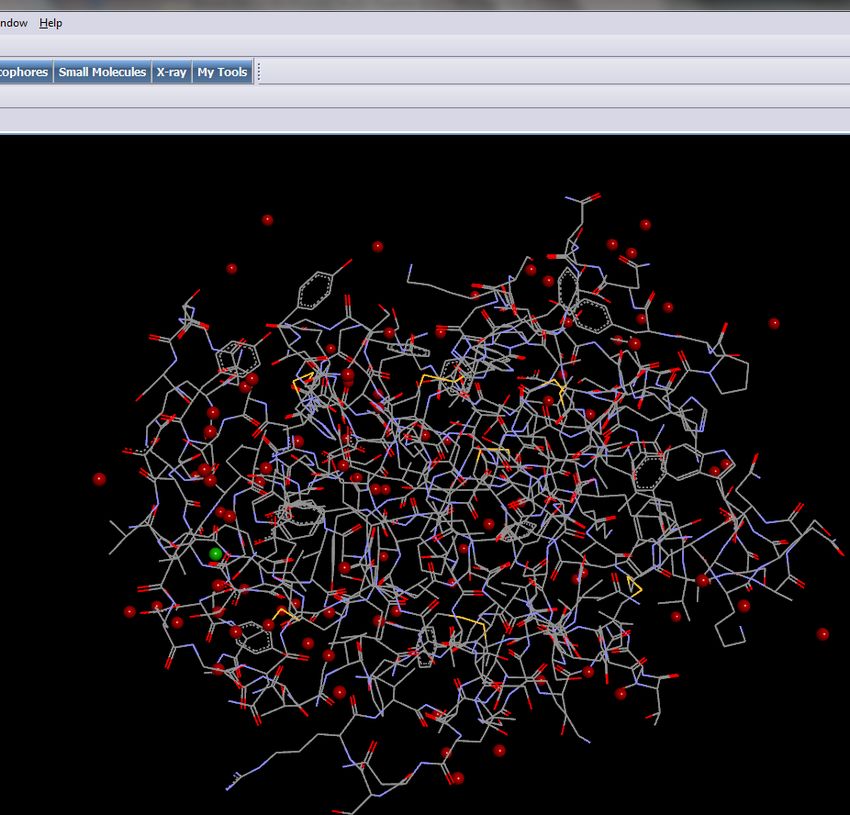
Files Explorer     Explore the file system to locate and open data files.

The application offers several ways of organizing and switching between windows. You can move a
Window by clicking and dragging its tab to the desired position. In this way you can arrange
windows on top of each other or organize them to view them simultaneously. You can also open
windows outside of the main application window by clicking on the Undock button on the right
side of the window header. This feature is useful when working with multiple monitors.

It is also possible to work with the explorer windows in autohide mode to increase the viewable
area. To set this mode, click the Pushpin button at the top of an explorer dock. This causes the dock
to collapse.
When you subsequently click on the tab of an explorer, the window is temporarily revealed. If you
want to restore the explorer window you should reclick the Pushpin button.

Tools
Discovery Studio offers a wide variety of tools for working with and visualizing data. Tools can be
accessed from menus, toolbars and tool panels. In addition you can create you own tools using
scripting and expose them anywhere in the application. Of all of the methods for accessing the
tools, tool panels are the most flexible. Tool panels group tools based on specific tasks you want to
perform. Furthermore, tool panels are groups into large sets for working in areas such as
Pharmacophores and Receptor-Ligand Interactions.
A useful feature for most buttons and menu items is the tool tip. Hover your cursor over a feature to
display a small note that offers basic information about it. In many cases, the tool tip includes a link
to more detailed help or related functionality such as preferences.

                                                   3
Another valuable resource for finding information about the application is the Feature Search Box
in the toolbar. To locate a feature, begin typing its name, or some term that relates to its
functionality. A list of associated features appears in a dropdown list. The Feature Search Box
matches text in the short descriptions of features so matches are obtained even if you do not specify
the precise name of a tool. Click on it in the list to present the corresponding menu item, toolbar
button, or tool panel.
Menus
The main menu of the application window provides access to basic tools for accessing, editing, and
viewing data. The following menus provide access to related sets of functionality:
File
Edit
Menu
View
Chemistry
Structure
Sequence
Charts
Scripts
Tools
Windows
4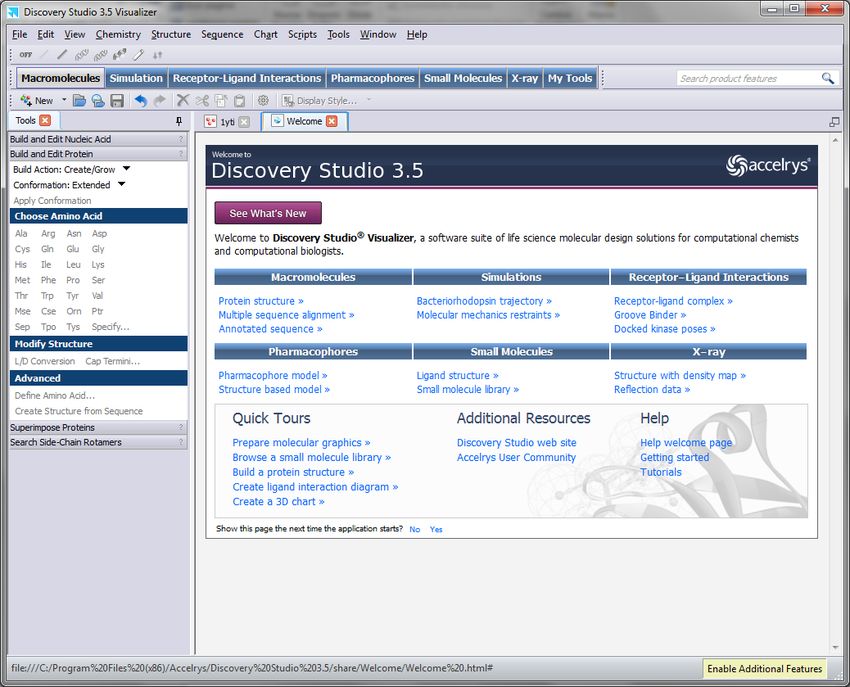
Help
Individual menu items are enabled and disabled depending on the data being viewed. The status bar
provides information about what type of data is needed to enable a command, but detailed help for
the tool can be opened by hovering over the tool and pressing F1.
Toolbars
Toolbars are useful for providing quick access to commonly used, quick-running tools. A large set
of toolbars are provided, which can be shown or hidden depending on the current task. By default, a
set of general purpose toolbars such as Standard and Display are shown when you start the
application for the first time. However, as you start to work with the application you can add
additional toolbars by right clicking on an existing toolbar and selecting from a drop down list.
Tool Panels
Tool panels are another way of invoking tools to analyze data. Tool panels are graphical palettes
that contain buttons, dropdowns and other controls that provide access to related sets of
functionality. The tools exposed on tool panels typically operate directly on a selected object in the
current window, and like other tools, are enabled and disabled depending on whether the
appropriate data is selected.
Tool Panels are located in the Tools Explorer. Custom tool panels can be created from the Tools
Explorer or using the Tool Panels preferences page.
Display Style Dialog
The Display Style dialog is used to change the settings that affect the appearance and behavior of
specific data opened in different windows. When data is opened in the application, you can access
this dialog by right-clicking the view or from the View menu. This dialog provides access to
settings that control particular aspects of the appearance of data or the way the display is
configured. Any changes made in the display style dialog are stored with the data if it is saved in a
Discovery Studio file format (.dsv).
5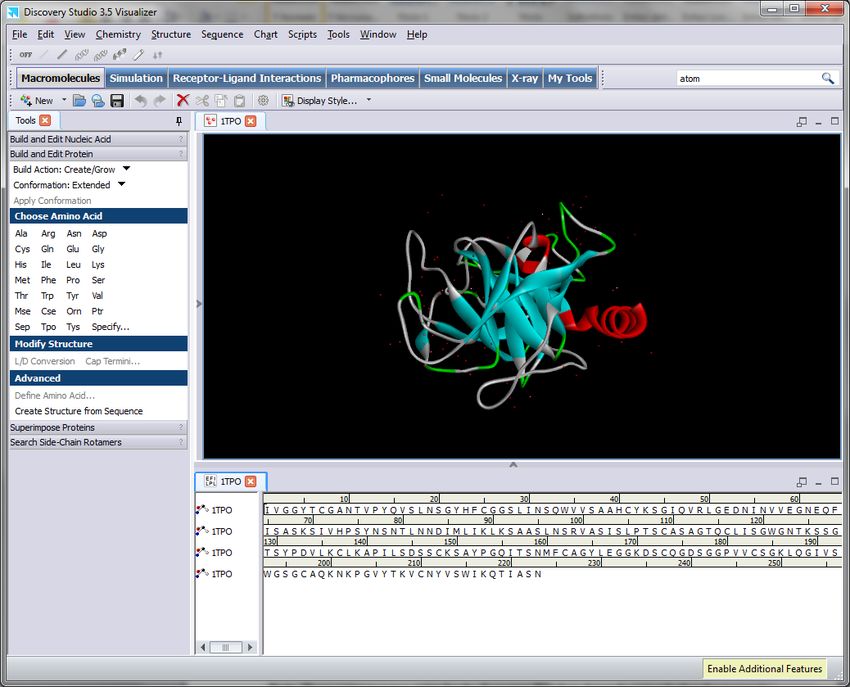
Status Bar
The Status Bar at the bottom of the application window displays useful information relating to your
current activity in the Visualizer. During the execution of some operations, it will display a
Progress Bar that shows status of the current operations. Clicking the Close icon stops the
operation. In addition, when working with molecules or sequences, the Status Bar often displays
information about the state of the selected object.

Mouse and keyboard actions
Open Discovery Studio Visualizer. In the Welcome windows click on Small molecule library
under Small Molecules menu. The hydrazide of the furoic acid, the first molecule of the Data Table
(on the bottom of the screen, is shown in the workspace. This is the default visualization: molecule
is represented as “Stick” corresponding to bonds; the bond order is shown (double bond are
represented by two parallel sticks), the atoms are colored according to their type: carbon are grey,
oxygen red, nitrogen blue, sulfur yellow, phosphorous violet and so on; hydrogens are not shown.
The Data Table can be hided and shown by pressing CTRL+T.
The Data Table can show some molecular properties, but it is necessary to modify the default
options of the program.
From the menu bar, choose Edit | Preferences to open the Preferences dialog.
In the navigation panel click Molecule Window. Ensure that the Calculate properties on import
checkbox is checked.

                                                 6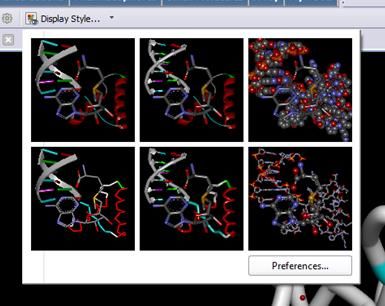
Click OK to close the dialog.
When files are opened, the properties will now be calculated and displayed automatically.
Close both the Graphic and the Data Table windows and reopen from the Welcome windows
the Small molecule library.
Click on the “Atom” and “Bond” tabs at the bottom of the Data Table to see the properties of
atoms and bonds of the selected molecule.

                                             7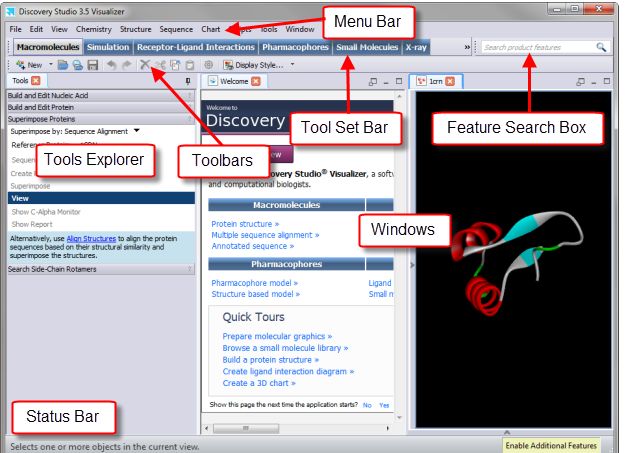
Now try to manipulate the molecule.
Try to rotate the molecule about x and y axes: Right-click and drag
and about z axis: SHIFT+right-click and drag
Then try to translate in xy-plane: Middle-click and drag
and along the z direction: SHIFT+middle-click and drag left or right
Now make visible the second molecule of the library, the ethyl ester of the benzoic acid, by clicking
on its “Visible” option on the molecular list. The two molecules are superimposed on the screen.

                                                 8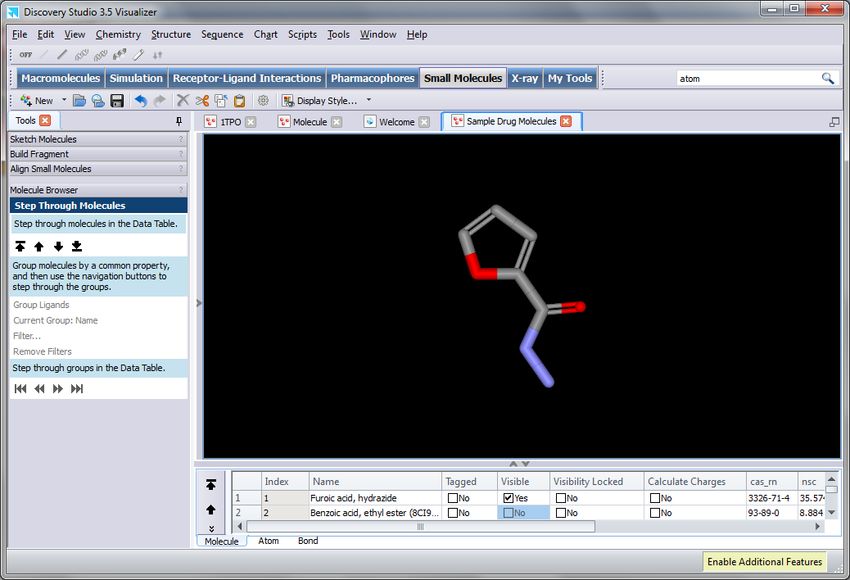
You can try again the previous commands: they act on both molecules together.
If you click on an atom or in the middle of a bond you can select that atom or that bond
respectively: the selected atom/bond appears colored in yellow.
If you double click on any atom the whole molecule is selected: the whole molecule appears colored
in yellow. Now you can operate only on the selected molecule by using the same commands already
used, but while you press the CTRL key, therefore:
Try to rotate the selected molecule about x and y axes: CTRL+Right-click and drag
and about z axis: CTRL+SHIFT+right-click and drag
Then try to translate in xy-plane: CTRL+Middle-click and drag
and along the z direction: CTRL+SHIFT+middle-click and drag up or down
A selection can be canceled by clicking on a empty region of the workspace. Normally making a
selection cancels the previous ones: If you want to add a selection you need to select while you are
pressing the SHIFT key. For a multiple section click and drag.
Other mouse and keyboard actions are specific to particular tool modes and may behave differently
between modes.

Display Styles
Clik on “Display Style…” and graphic menu appears:

Explore the possible styles to represent a molecule: select a display style and click on “Apply”.

If there is some selection (some atoms or some molecule) the display style is applied only to the
selection.

You can also explore the graphic possibilities offered by the computer by exploring the other menus
(Graphics, Lighting, Materials)

Now load a protein in another window (it would be better if you close the window with the till here
considered small molecules. (File/Close)

                                                  9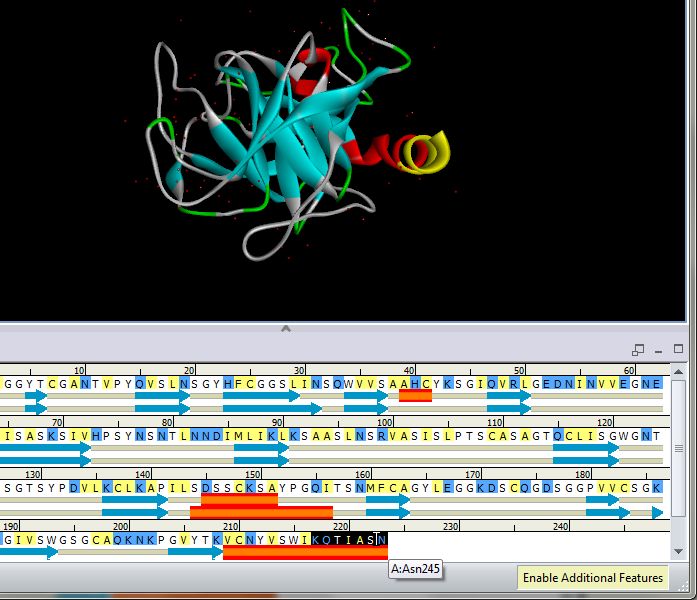
Working with protein structures and
sequences
Introduction
Discovery Studio provides a range of viewers for working with molecular structures and properties.
When working with proteins, the Molecule and Sequence Windows are of most value and can be
used very effectively to explore different aspects of a molecule and make inferences about its
functionality. For example, protein secondary structure predictions can be made on the sequences,
and highlight the corresponding regions in the Molecule Window.

Opening and viewing a protein molecule and
its sequence
Choose File | Open... from the menu bar and open Samples | Tutorials | Quick Start Tutorials |
1TPO.pdb.
The protein structure is shown as a ribbon following the backbone of the protein. Where there are
secondary structure features the ribbon is more fat and colored (in light blue for barrels and red for
helices). This kind of visualization clearly show the secondary and tertiary structure of the protein
but completely hide atoms and in particular the side chain ones.
From the menu bar, choose Sequence | Show Sequence to view the sequence of the molecule.
This opens a new Sequence Window that allows you to visualize and manipulate the amino acid
sequence and the corresponding 3D structure simultaneously.

                                                 10
Tip. You can easily adjust window layouts to suit the task at hand. Windows can be tabbed, set
side-by-side, or hidden from view. You configure different window layouts by dragging window
tabs to desired positions. You can also choose a preset window layout by choosing Window |
Arrange windows from the menu bar. For example, the Macromolecules layout arranges structure
windows in the top left, sequence windows along the bottom of the application workspace, and all
other windows in the top right. In addition, you can adjust the interface using the actions of the
View menu and its associated shortcut keys.
The amino acids are indicated with the one-letter code:
Click the 1TPO Sequence Window tab to make it active.
Click on the arrow to the right of the Display Style button on the View toolbar and choose Color by
Residue Hydrophobicity.
This changes the residue background colors in the Sequence Window based on hydrophobicity of
the residue type.
11Place the mouse over residues, and then right-click in the Sequence Window and click the
Secondary Structure Cartoon button.
This displays the PDB and Kabsch-Sander secondary structure cartoon. The blue arrows represent
beta strands and the solid red cylinders represent alpha helices.
12Note. You can also control the secondary structure cartoon display by choosing Sequence |
Secondary Structure | Visibility... from the menu bar.
Note. Three context menus exist for the Sequence Window depending on whether the mouse is in
the sequence name pane, ruler display, or residues area.
Selecting residues
Discovery Studio Visualizer offers numerous methods for selecting specific residues or other
objects. Windows displaying the same data are interactive. If you make a selection in a Sequence
Window, the same selection is made in the corresponding Molecule Window. Different views of the
data in the Molecule Window can also be used to make selections.
The selected residues are coloured in yellow in the structure and are backgrounded in black in the
sequence
Hover the cursor over any residue in the Sequence Window.
The residue ID is reported in a tooltip (A:Asn245).
With the mouse over the ruler area of the Sequence Window, right-click and choose Residue ID to
display the residue IDs for the first (and in this case, the only) sequence. Find and select the three
residues of the Catalytic Triad - HIS57, ASP102, and SER195.
13If you make a mistake when selecting a residue, you can undo that selection action by choosing Edit
| Undo from the menu bar, or by pressing CTRL+Z.
Tip. You can also use the Hierarchy View or Data Table View to select the residues. Use CTRL+H
and CTRL+T to control the display of these views.
At this point it is useful to be able to save the current selection in the structure and restore it later.
Discovery Studio Visualizer supports the creation of Groups to provide this functionality. Groups
can be created from any combination of objects that are selected in the Molecule Window. Once
created, they are displayed in the Hierarchy View. Any groups that you have created are saved in
the .dsv format. This is a proprietary format which saves all is in the workspace including all
selections and rendering.
Click the 1TPO - Molecule Window tab to make it active.
With the Catalytic Triad residues selected, from the menu bar, choose Edit | Group... to open the
Edit Group dialog.
Enter Catalytic Triad as the Group Name and click Define.
Select View | Transform | Fit To Screen, or click Fit To Screen on the View toolbar to center and
zoom over the Triad.
Note. The Catalytic Triad group is added to the Hierarchy View (at the bottom) and Data Table
View (Group tab).
To view the individual residues more easily it is useful to change the display style of the structure to
an atomistic representation. To do this you can use the Display Style control on the View toolbar.
Click on the arrow to the right of the Display Style button on the View toolbar and select one of the
the styles of the preview page: click on line mode display (the bottom right style).
14The appearance of the structure is now updated to show the atoms in line mode.
Alternatively you can open the “Display style” windows and select the way of appearance for
atoms, protein, etc. or you can insert labels giving Structure | Labels | Add.
Remember that all this display changes will be applied anly to the active selection or, if there are
not any active selection, to all the molecules in Workspace.
15Customizing the appearance of the protein
structure
Click an empty area of the window to cancel the selection.
Select View | Display Style... from the menu bar.
On the Atom tab of the Graphics View Display Style dialog, set the Display style to None.
Click the Protein tab and set the Display style to Solid Ribbon.
Click the Color by: radio button in the Coloring group and set the value to Secondary Type.
Click OK.
Choose View | Transform | Fit To Screen from the menu bar, or click Fit To Screen on the
View toolbar to display the entire molecule.
This will remove all the atom-based rendering and only display the solid ribbon rendering.
From the Hierarchy View, select the Catalytic Triad group. Open the Display Style dialog and
select Stick on the Atom tab. Click OK. Select View | Transform | Fit To Screen from the menu
bar, or click Fit To Screen on the View toolbar to focus on the triad again.
In the Graphics View, notice that only residues HIS57, ASP102, and SER195 are displayed as stick
models, and the remainder of the protein is rendered as a ribbon. By only allowing a subset of
residues to be visible on the Graphics View, you have a more focused view of the residues of
interest, a simplified view of the Catalytic Triad in this case.
Tip. Saving files in .dsv format will retain the active view, the rendering, the labels, or any other
annotations that you have made. .dsv files provide an efficient medium for sharing information with
colleagues.
From the menu bar, choose Window | Close All to prepare for the next section of the tutorial. There
is no need to save any files, so select No in the dialog that appears.
16Exploring interactivity between the Molecule
Window and the Sequence Window
The previous section illustrated interactivity between windows by describing residue selection in
the Sequence Window and display style changes in the Molecule Window. In this section, you will
continue to explore examples of window interactivity and see additional examples that illustrate the
value of window-to-window interactivity.
Choose File | Open... from the menu bar and open Samples | Tutorials | Quick Start Tutorials |
1BVN.pdb.
From the menu bar, choose Sequence | Show Sequence or press CTRL+Q to open the Sequence
Window.
Press CTRL+H to open the Hierarchy View if it is not already displayed. Notice three chains in the
Hierarchy View named P, T, and P. Click the first P chain to select it.
A selection will be made in the Graphics View and also in the Sequence Window. If you select
residues in the Sequence Window, they are also selected in the Graphics View, the Hierarchy View,
and the Data Table.
On the Sequence Window, slowly click and drag from left to right starting from residue 1 in the
ruler.
In the Sequence Window, the selection will have a black background. The selection in the
Hierarchy View and the Graphics View is highlighted in yellow. A selection is also made in the
Data Table.
Use the Select tool to select a region of the structure in the Graphics View.
Notice that residues in the Sequence Window are highlighted as well.
From the menu bar, choose Window | Close All to prepare for the next section of the tutorial. There
is no need to save any files, so select No in the dialog that appears.
Editing a protein structure
Choose File | Open... from the menu bar and open Samples | Tutorials | Quick Start Tutorials |
1TPO.pdb.
The structures archived into Protein Data Bank are saved as .pdb file. This file generally does not
consider hydrogen atoms, moreover they are structures obtained from X-ray crystallography
performed on proteins crystallized from aqueous solutions and therefore they contain crystallization
water molecules which are shown here as red little spheres.
In order to delete water molecules they need to be selected in one of these ways: Edit | Select then
in the Select windows choose Add – Group – Name equals Water,
17Alternatively, you can open the Hierarchical windows (Ctrl+H) and click on Water,
or open the Group Table windows (Ctrl+T), click on Group (bottom righr) and on the number 2
corresponding to the group Water.
In all cases all the water molecules should be selected (colored in yellow) and you can delete them
by pressing the Del key.
Select/Unselect, Show/Hide in Hierarchical Table
Clicking on + you can expand CellStructureChainsResiduesAtoms. Clicking on - you
can compress the Table. Clicking on the Table you can Toggle the visibility or Select/Unselect. If
you need to select a series of residues (or atoms) in sequence you can click on the first and then
click on the last while you maintain pressed the Shift key.
18The missing hydrogens can be easily added. Select line mode display. Choose Chemistry |
Hydrogen | Add. For simplifying the display now hide all hydrogens (Chemistry | Hydrogen |
Hide) and show only the polar ones, i.e. those linked to heteroatoms (Chemistry | Hydrogen |
Show Polar). Only polar hydrogens can give H-bond.
You can mutate a residue. This can be very useful if the pdb structure has some unresolved residues
that appears as alanines, i.e. with only a methyl in the side chain.
Mutate residue Gly19 into an aspartate. Firstly simplify the display showing only the first 7 residue,
while all others are hided (not canceled) and select the residue Gly19. In the hierarchical window
deselect the A chain, then select the first 7 residues and click on the structure symbol of Gly19. The
green sphere is a Ca ion contained in the structure.
Alternatively you can select a residue by clicking twice on an atom of it. In this case is convenient
to label the residues with name and number: choose Structure | Labels | Add then Residue and
3-Letter & ID#
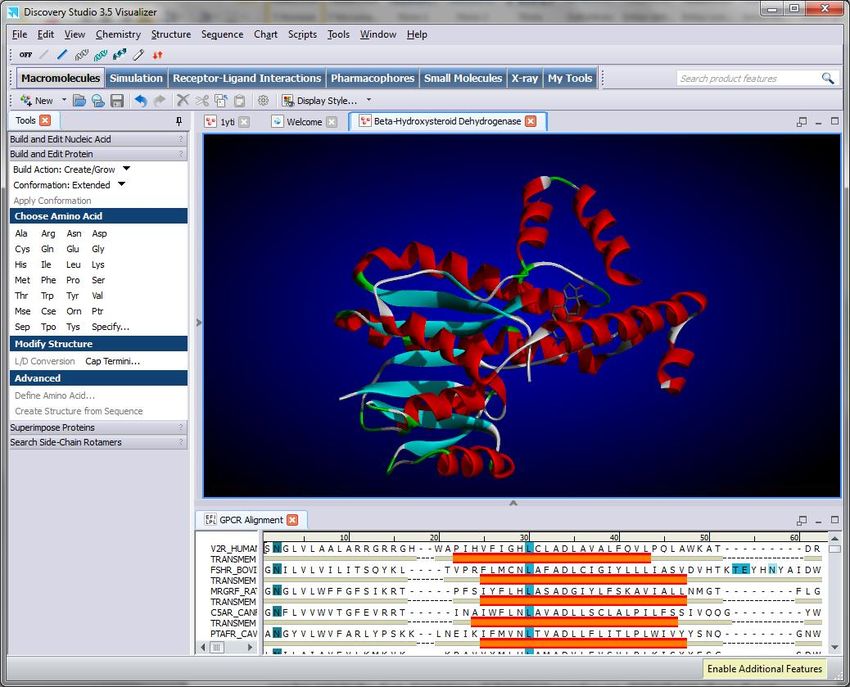
19When the residue Gly19 is selected (it is colored in yellow) in the tool explorer (it should be
selected the Macromolecule tool) open the Build and Edit Protein menu and select Mutate, then
click on Asp and Gly19 now is Asp19.
It is possible to measure distance and angles and show intermolecular H-bond.
For measuring distance select two atoms at the same time by clicking once on both (remember that
it is necessary to maintain pressed the Shift key while clicking if you want to add selection) then
choose Structure | Monitor | Distance. For angle select three atoms then Structure | Monitor |
Angle, for torsion select four atoms then Structure | Monitor | Torsion.
20For showing H-bond choose Structure | Monitor | HBonds, however if you are seeing the first 7
residues you cannot see any H-bond because there are not. You need to make visible all the
molecule or the last 7 or more residues where there are H-bonds. To do this use the hierarchical
window as previously explained.
A very useful tool for analyzing the molecular properties is that to draw the molecular surface and
color it according to the value of certain properties.
21To draw a molecular surface firstly make visible the whole protein through the hierarchical window
then choose Structure | Surface | Add and in the Create Surface windows choose Display style
Solvent (draw the surface exposed to solvent), Surface rendering Solid and press OK
You can change the surface: open the Display Stule window and select Surface. You can change the
kind of style and rendering, the transparency, and the color method. For example if you wanto to
analyze the hydrophobic properties of the protein choose Color by Hydrophobicity; by pressing
Colors… button you can select the color spectrum: the default spectrum colors the hydrophobic
region in brown and the lipophilic ones in blue. You can explore other styles, properties and colors.
2223
Appendix A.
Default mouse and keybord actions
 To                Press
 Select   single Left-click the object
 object
 Select       an   Double-click the object to continue selecting the object's ancestry. For
 object's parent   example, double-clicking a selected atom that has a residue as its parent will
 in the Graphics   select the whole residue. If that residue has a chain as its parent, double-
 View              clicking the atom again will select the whole chain. By continuing this action,
                   the molecule, cell, and root object (all objects) can be selected if the hierarchy
                   exists.
 Translate view Middle-click and drag
 in xy-plane
 Translate       CTRL+middle-click and drag
 selected object
 in xy-plane
 Translate view SHIFT+middle-click and drag left or right*
 along z-axis
 Translate       CTRL+SHIFT+middle-click and drag up or down*
 selected object
 along z-axis
 Rotate    view Right-click and drag**
 about x- and y-
 axes
 Rotate selected CTRL+right-click and drag
 object about x-
 and y-axes
 Rotate     view SHIFT+right-click and drag
 about z-axis
 Rotate selected CTRL+SHIFT+right-click and drag
 object about z-
 axis
 View from the X
 right (end of x-
 axis)
 View from the Y
 top (end of y-
 axis)

                                               24
View from the Z
front (end of z-
axis)
Zoom in Mouse wheel roll forward
Zoom out Mouse wheel roll backward
Back clipping SHIFT+mouse wheel
plane
Front clipping CTRL+mouse wheel
plane
Both clipping CTRL+SHIFT+mouse wheel
planes
Context menu Right-click
Keyboard controls
To Press
Open the Graphics View CTRL+G
Open the Hierarchy View CTRL+H
Open the Data Table View CTRL+T
Select all CTRL+A
View full screen F11
Cut CTRL+X
Copy CTRL+C
Paste CTRL+V
Find CTRL+F
Delete selected objects DELETE
Zoom in CTRL+(plus)
Zoom out CTRL+(minus)
Capture a scene INSERT
Return to the first scene CTRL+HOME
Toggle visibility of all Explorer Windows CTRL+1
Toggle visibility of left-docked Explorer Windows CTRL+2
Toggle visibility of horizontally-docked Explorer Windows CTRL+3
Toggle visibility of right-docked Explorer Windows CTRL+4
25Toggle visibility of the Jobs Explorer CTRL+J
Choose window CTRL+TAB
Rotate view left on y-axis Left arrow
Rotate view right on y-axis Right arrow
Rotate view forward on x-axis Up arrow
Rotate view backward on x-axis Down arrow
Reset to original orientation HOME
Stop current action END
Change element type of selected atoms C, H, O, N, P, S, F
Change bond order of selected bonds to single/double/triple/aromatic 1, 2, 3, or 4
Change hybridization of selected atoms (if no bonds are selected) to 1, 2, 3
sp/sp2/sp3
Tile molecules in view CTRL+L
Show next molecule CTRL+Down
arrow
Show previous molecule CTRL+Up arrow
Show sequence CTRL+Q
Tool-specific actions
Select tool
To Press
Multiple selection Left-click and drag
Select multiple items individually SHIFT+left-click
Rotate tool
To Press
Rotate view about x- and y-axes Left-click and drag**
Rotate selected object about x- and y-axes CTRL+left-click and drag
Rotate view about z-axis SHIFT+left-click and drag
Rotate selected object about z-axis CTRL+SHIFT+left-click and drag
Translate tool
26To Press
Translate view in xy-plane Left-click and drag
Translate selected object in xy-plane CTRL+left-click and drag
Translate view along z-axis SHIFT+left-click and drag*
Translate selected object along z-axis CTRL+SHIFT+left-click and drag*
Zoom tool
To Press
Zoom in Left-click and drag up
Zoom out Left-click and drag down
Torsion tool
To Press
Rotate torsion Left-click bond and drag horizontally
Rotate opposite end of torsion SHIFT+left-click bond and drag horizontally
Rotate peptide plane CTRL+left-click and drag horizontally on amide bond
Rotate omega CTRL+SHIFT+left-click and drag horizontally on amide bond
27Sketching tool
Sketch mode
To Press
Add carbon atom Left-click in Molecule Window (drag + left-click attaches
additional carbon atom)
Change single bond to Left-click the previously created atom
double bond
Add bond between atoms Left-click a previously created atom, but not the most recently
created (i.e., currently selected) atom
Stop sketching Left-double-click or move cursor outside Molecule Window
Chain mode
To Press
Create 2-carbon chain Left-click in Molecule Window
Create chain of more than 2 Left-click and drag
carbons
Reflect chain by 180° CTRL while left mouse button is still pressed following
previous sketching action
Attach carbon chain to Left-click and drag on existing atom
existing chain
Ring mode
To Press
Create 6-carbon ring Left-click in Molecule Window
Create aromatic 6-carbon ring CTRL+left-click
Create ring of more than or fewer than 6 carbons Left-click and drag
Create aromatic ring of more than or fewer than 6 CTRL+left-click and drag
carbons
Attach 6-carbon ring to existing ring Left-click atom in existing ring
Attach aromatic 6-carbon ring to existing ring CTRL+left-click atom in existing
ring
Attach ring of more than or fewer than 6 carbons to Left-click and drag on atom in
existing ring existing ring
Attach aromatic ring of more than or fewer than 6 CTRL+left-click and drag on atom in
carbons to existing ring existing ring
Fuse 6-carbon ring to bond in existing ring Left-click bond in existing ring
28Fuse aromatic 6-carbon ring to bond in existing ring CTRL+left-click bond in existing
ring
Fuse ring of more than or fewer than 6 carbons to bond Left-click and drag on bond in
in existing ring existing ring
Fuse aromatic ring of more than or fewer than 6 carbons CTRL+left-click and drag on bond in
to bond in existing ring existing ring
Text mode
Mode To Press
Annotation Create text annotation Left-click, then enter text in Annotation Text dialog.
Boxed Create boxed text Left-click, then enter text in Annotation Text dialog.
Callout Create boxed text as callout Left-click object, then left-click to place boxed text.
Note. To change the size of boxed or callout text, use Select to left-click and drag the small square
on the corner of the box.
Display mode
To Press
Display particular object type only Left-click object name in Hierarchy View
Display range of objects SHIFT+left-click objects defining range in Hierarchy View
Toggle display of object Left-click object in Molecule Window
Sequence Window
To Press
Show Annotations Double-click the sequence name
Select residues Left-click and drag
Select residues by secondary Left-click secondary structure cartoon
structure domain
Select block Left-click and drag over
Select sequence Left-click the sequence name or left-double-click residues
Extend residue selection SHIFT+left-click
Add residue(s) Left-click and drag over
Add/subtract single residue CTRL+left-click
(toggle)
Add/subtract sequence selection CTRL+left-click sequence name
(toggle)
Extend sequence selection SHIFT+left-click sequence name
29Add gap Position the cursor at the desired location and press
SPACE BAR
Remove gap Position the cursor at the desired location and press
DELETE or BACKSPACE
Add a chain break Position the cursor at the desired location and press the /
key
Shift a block Select the block and left-click and ALT-drag or SHIFT-
CTRL-drag
Shift an aligned block Select the aligned block and left-click and ALT-CTRL-
drag
Move a block of residues Linux - First left-click , then press ALT | Windows - Left-
click, press ALT
Activate the linked molecule Double-click the link icon
window
Note. A block of residues is defined as a range of residues surrounded by gaps at both ends.
Annotation Window
To Press
Scroll through the window when there are features outside of the Up arrow and down
view limit arrow
Move from one end of a sequence to the other In Zoom mode, left
arrow and right arrow
Copy the selection to the clipboard. CTRL+C
Insert the contents of the clipboard in the current document. Requires CTRL+V
that compatible data has been copied to the clipboard.
Delete the selected sequence features. DEL
Toggle the visibility of the Graphics View in the current window. CTRL+G
Toggle the visibility of the Hierarchy View in the current window. CTRL+H
Toggle the visibility of the Data Table View in the current window. CTRL+T
Change the display style of the selected items. If nothing is selected CTRL+D
the display style of all visible items is changed.
Decrease/increase the magnification for the current view. CTRL+-/+
Reset the magnification in the current view to its original level. CTRL+O
Reset the magnification level and orientation of data in the current HOME
view to their original settings.
Select all items in the current view. CTRL+A
30Charts
2 Dimensional
To Press
Translate right Right arrow
Translate right faster CTRL+right arrow
Zoom ALT+right arrow
Reposition ALT+left arrow
Rotate ALT+up arrow
Zoom out Y ALT+down arrow
3 Dimensional
To Press
Zoom Roll mouse wheel
Reposition Hold mouse wheel and drag
Rotate arrows
Rotate slowly SHIFT+arrow
* If you translate objects in the z-axis (which runs into and out of the screen) in orthographic mode,
you will not see any apparent change in the display unless depth cueing is turned on or you are
viewing with perspective projection .
** These are preferences that can be set on the Tools subpage of the Molecule Window page of the
Preferences dialog. Track Surface is the default setting and allows rotation about some combination
of the x-and y-axes (or the z-axis if the SHIFT key is pressed as well) as the mouse is moved. The
Track Ball setting uses the location of the cursor on the screen to determine the axis around which
rotation occurs. If the cursor is in the middle of the screen, rotation around the x- and y-axes occurs.
If the cursor is near the edge of the screen, rotation is around the z-axis.
31You can also read