PSYCHOMETRIC PROPERTIES OF THE "TEACHING QUALITY" SCALE IN STARTING - COHORTS 2, 3, AND 4 ANNA HAWROT NEPS SURVEY PAPERS - LIFBI
←
→
Page content transcription
If your browser does not render page correctly, please read the page content below
NEPS SURVEY PAPERS

Anna Hawrot
PSYCHOMETRIC
PROPERTIES OF THE
"TEACHING QUALITY"
SCALE IN STARTING
COHORTS 2, 3, and 4

NEPS Survey Paper No. 82
Bamberg, February 2021
Survey Papers of the German National Educational Panel Study (NEPS)
at the Leibniz Institute for Educational Trajectories (LIfBi) at the University of Bamberg

The NEPS Survey Paper series provides articles with a focus on methodological aspects and data
handling issues related to the German National Educational Panel Study (NEPS).

They are of particular relevance for the analysis of NEPS data as they describe data editing and data
collection procedures as well as instruments or tests used in the NEPS survey. Papers that appear in
this series fall into the category of 'grey literature' and may also appear elsewhere.

The NEPS Survey Papers are edited by a review board consisting of the scientific management of LIfBi
and NEPS.

The NEPS Survey Papers are available at www.neps-data.de (see section “Publications“) and at
www.lifbi.de/publications.

Editor-in-Chief: Thomas Bäumer, LIfBi

Review Board: Board of Directors, Heads of LIfBi Departments, and Scientific Management of NEPS
Working Units

Contact: German National Educational Panel Study (NEPS) – Leibniz Institute for Educational
Trajectories – Wilhelmsplatz 3 – 96047 Bamberg − Germany − contact@lifbi.de
Hawrot

 Psychometric Properties of the “Teaching Quality” Scale for
                    Teachers in Starting Cohorts 2, 3, and 4

                                      Anna Hawrot
           Leibniz Institute for Educational Trajectories, Bamberg, Germany

E-mail address of lead author:
anna.hawrot@lifbi.de

Bibliographic data:
Hawrot, A. (2021). Psychometric Properties of the “Teaching Quality” Scale for Teachers in
Starting Cohorts 2, 3, and 4 (NEPS Survey Paper No. 82). Leibniz Institute for Educational
Trajectories, National Educational Panel Study. https://doi.org/10.5157/NEPS:SP82:1.0

NEPS Survey Paper No. 82, 2021
Hawrot Psychometric Properties of the “Teaching Quality” Scale for Teachers in Starting Cohorts 2, 3, and 4 Abstract This paper presents information on the source, theoretical background, and psychometric properties of the “Teaching quality” scale used in Wave 2 of Starting Cohort 2, Waves 2 and 7 of Starting Cohort 3, and Wave 3 of Starting Cohort 4. The scale measures teacher perceptions of the quality of their own instruction. We ran an item-level analysis and checked the scale’s reliability and internal structure. The items had low to moderate discriminatory power and the internal consistencies of the subscales were low. The analyses did not confirm the expected three-factor structure of the scale. A two-factor structure emerged, but it was not fully consistent across Waves and Starting Cohorts. Overall, the test needs major refinements before it can be used as a measure of teaching quality. Keywords teaching quality, teachers, psychometric properties, Three Basic Dimensions Acknowledgments This paper uses data from the National Educational Panel Study (NEPS): Starting Cohort 2 (doi: 10.5157/NEPS:SC2:7.0.0), Starting Cohort 3 (doi:10.5157/NEPS:SC3:7.0.1), and Starting Cohort 4 (doi: 10.5157/NEPS:SC4:9.1.1). From 2008 to 2013, NEPS data was collected as part of the Framework Program for the Promotion of Empirical Educational Research funded by the German Federal Ministry of Education and Research (BMBF). As of 2014, NEPS is carried out by the Leibniz Institute for Educational Trajectories (LIfBi) at the University of Bamberg in cooperation with a nationwide network. I would like to thank Katharina Loos for her assistance with German-language literature and Fenja Schaupp for formatting the paper. NEPS Survey Paper No. 82, 2021 Page 2
Hawrot

1. Introduction
The National Educational Panel Study aims at tracking the development of various
competencies, describing their patterns, and better understanding of how they unfold across
the lifespan (Blossfeld et al., 2011). To this end, information is gathered about various
potential sources of influence, including the home environment, educational institutions, or
the workplace. However, all these factors need to be measured in a stage-sensitive way that
is in a way that is adjusted to the participants’ age, stage of development, as well as to their
educational or professional path.

Teaching quality is considered one of the key factors affecting student learning and
engagement in the school learning environment (e.g., Hattie, 2009; Seidel & Shavelson, 2007).
As a result, in the study, teaching quality was measured from both the teacher and student
perspective. This report focuses on the teacher perspective. Information on the psychometric
properties of a student scale used in Staring Cohort 3 can be found in Hawrot (2021).

This paper presents information on the source, theoretical background, and psychometric
properties of the “Teaching quality” scale used in Starting Cohorts 2, 3, and 4 to assess teacher
perceptions of the quality of their own instruction. Its goal is to document the scale and
provide data users with basic information necessary to make an informed decision about use
of the scale in the analyses based on the NEPS data or in their own research 1.

2. Description of the Scale
The “Teaching quality” scale consists of 12 items divided into three subscales for Cognitive
Activation (7 items), Student Support (2 items), and Classroom Management (3 items).
Subjects are asked to rate to what extent each item applies to their own teaching. The
response categories are labelled as follows: 1 = does not apply, 2 = does rather not apply, 3 =
does rather apply, 4 = does apply.

The items come from various scales used in three German educational studies:
“Bildungsprozesse, Kompetenzentwicklung und Selektionsentscheidungen im Vorschul- und
Schulalter” (Codebuch Zum Lehrerfragebogen Welle 1 [BiKS-8-14 Grundschule], n.d.),
“Pädagogische EntwicklungsBilanzen” (Steinert et al., 2003), and „Studie zur Entwicklung von
Ganztagsschulen“ (Furthmüller, 2014). They were adapted and pooled together to form
subscales reflecting three generic dimensions of teaching quality according to the model of
Three Basic Dimensions (Praetorius et al., 2018). According to this model Classroom
Management is a prerequisite for learning and refers to an orderly and disruption-free
classroom environment with clear rules and expectations. Student Support captures whether
students are provided with assistance with learning that is adjusted to their individual needs
and interests. Cognitive Activation refers to promoting conceptual understanding in class and
to stimulating higher-order thinking (Praetorius et al., 2018).

Table 1 contains the item wording and the corresponding variable names used in the Scientific
Use Files. The original German-language wording is available on the project’s website
(www.neps-data.de).

1
 Please note that we assumed the items to build a scale and therefore we neither focused on the possibility of
using single items, nor tested the properties (e.g., retest reliability) or validity of single items.

NEPS Survey Paper No. 82, 2021                                                                           Page 3
Hawrot

Table 1

Items of the ”Teaching Quality” Scale

 Variable                               To what extent do the following statements apply to your
                  Subscale
 name                                                          teaching?

 e22540a         CA               a) I give students assignments of different levels of difficulty based
                                  on their abilities.

 e22440b         SS               b) I quickly notice when a student is having trouble.

 e22340c         CM               c) Everyone in my class knows the “rules of the game.”

 e22540d         CA               d) In my classes, the types of tasks are repeated to solidify what my
                                  students have learned.

 e22540e         CA               e) I discuss general and current topics with my students even if puts
                                  my lesson plan behind schedule.

 e22540f         CA               f) I see it as my job in the classroom to present and teach proven
                                  concepts.

 e22340g         CM               g) I summarize the material so that my students will remember it
                                  better.

 e22540h         CA               h) I often ask students to justify their answers with arguments.

 e22440i         SS               i) There’s a friendly, trusting relationship between me and my
                                  students.

 e22340j         CM               j) I think absolute quiet in the classroom is important.

 e22540k         CA               k) In my class, the students should find out for themselves why
                                  something is wrong.

 e22540l         CA               l) I like to give the faster students extra tasks to challenge them.
Note. CA = Cognitive Activation; CM = Classroom Management; SS = Student Support.

3. Method

3.1 Data and Sample
We used data gathered during the National Educational Panel Study (NEPS, Blossfeld et al.,
2011) from Starting Cohort 2 (SC2), Starting Cohort 3 (SC3), and Starting Cohort 4 (SC4). In the
three cohorts, selected teachers who were teaching sampled students were surveyed as
context persons. The scale was administered to teachers as a part of a larger questionnaire

NEPS Survey Paper No. 82, 2021                                                                           Page 4
Hawrot
using the standard testing procedure for a wave. Information on the procedures is available
in the data manual (Skopek et al., 2012b, 2012a, 2013) and interviewer manuals2.
Table 2 contains information about the waves of each starting cohort in which the scale was
administered to teachers. It is supplemented by information which grade students
participating in NEPS attended. Please note that the sample did not include teachers from
special schools.
Table 2
The Scale Administration in Starting Cohorts 2, 3 & 4
Wave 1 2 3 4 5 6 7
Starting Cohort 2 G3
Starting Cohort 3 G6 G10
Starting Cohort 4 G10
Note. G = grade.
The “Teaching quality” scale was administered four times: once in SC2 (Wave 5, school year
2014/15), once in SC4 (Wave 3, school year 2011/12) and twice in SC3 (Waves 2 and 7, school
year 2011/12 and 2015/16). In SC3, the same teacher could therefore fill in the scale twice—
in Waves 2 and 7. This report however, uses data from the first administration only. This was
necessary because some inconsistencies appeared in gender and birth date of teachers
surveyed in different waves but having the same identification number assigned. These
inconsistencies suggested that identification numbers might not be fully consistent across
waves, causing difficulties in identifying dependent data. Thanks to using data gathered during
the first administration only, teacher samples in the waves of SC3 did not overlap. We used
variable ex80211, which contains information about the questionnaire administered to each
teacher (first-time or panel interviewee questionnaire), to identify and exclude all repeated
administrations.
Table 3 presents the sample sizes in all administration time-points. The samples include
teachers who responded to at least one item of the scale; thus, the number of teachers who
filled in at least one question in the whole teacher questionnaire may be different.
2
https://www.neps-data.de/Data-Center/Data-and-Documentation/Starting-Cohort-
Kindergarten/Documentation; https://www.neps-data.de/Data-Center/Data-and-Documentation/Starting-
Cohort-Grade-5/Documentation; https://www.neps-data.de/Data-Center/Data-and-Documentation/Starting-
Cohort-Grade-9/Documentation
NEPS Survey Paper No. 82, 2021 Page 5Hawrot
Table 3
Sample Sizes in Various Administration Time-Points
Wave 1 2 3 4 5 6 7
Starting Cohort 2 651
Starting Cohort 3 564 280
Starting Cohort 4 1075
Note. Samples include first administrations of the test only.
3.2 Analytical Procedure
In the first step, we analyzed missing response rates per person and per item as well as
calculated the items’ discriminatory power and reliabilities of subscale scores. Next, we
inspected item distributions to identify potential problems with response scales, for example,
range restrictions.
Second step involved analyzing the internal structure of the scale. It was divided into several
sub-steps: first, confirmatory factor analyses (CFA) were performed for each starting cohort’s
wave separately; then, if the CFA models did not provide an adequate fit to the data,
exploratory factor analyses (EFA) were performed.
The analyses of the internal structure were performed with Mplus 7.4 (Muthén & Muthén,
1998-2015) using delta parameterization and the WLSMV estimator. This estimator is
recommended for ordered categorical data, especially when item response distributions are
skewed and the number of response categories is small (e.g., Beauducel & Herzberg, 2006;
Flora & Curran, 2004). The scales of the CFA factors were set by fixing factor variances at one.
The EFA models used oblique Geomin rotation. All of the models accounted for the non-
independence of teachers clustered within schools by adjusting to the standard errors using a
sandwich estimator (CLUSTER option).
The model fit was assessed with three commonly used (McDonald & Ho, 2002) fit indices, that
is, the root mean square error of approximation (RMSEA), the comparative fit index (CFI), and
the Tucker–Lewis index (TLI). We assumed that CFI and TLI values not lower than .95, and
RMSEA values not higher than .06 indicated a good fit (Hu & Bentler, 1999).
4. Results
4.1 Missing Responses
NEPS datasets include several codes for missing data. In this case, two types of missing values
occurred: implausible values and unspecific missing values. Both types refer to nonresponse,
with implausible values denoting invalid responses and unspecific missing values denoting
nonresponse for which the cause is unknown.
NEPS Survey Paper No. 82, 2021 Page 6Hawrot
4.1.1 Missing responses per person
Table 4 contains information with the numbers and percentages of respondents with a given
number of implausible values, unspecific missing values, and total number of missing values.
The majority of missing values was unspecific. The number of implausible values per person
was low. It incidentally exceeded 1; under 2% of respondents participating in a given wave of
a given starting cohort provided at least one implausible response.
The number of unspecific missing values per person was higher than the number of
implausible values. The percentage of respondents with at least one unspecific missing value
oscillated between 7.5% in Wave 7 of SC3 and 10.8% in Wave 5 of SC2. The respondents most
often omitted one item, and the rate of single-item omissions ranged from 5% (Wave 7, SC3)
to 7.7% (Wave 5, SC2). Under 0.8% of respondents did not provide their response to over 25%
of items.
The total missing values per person and unspecific missing values per person hardly differed
because of the low share of implausible values in the total missing values. Thus, the results for
total missing values are not described.
Table 4
Rates of Implausible, Unspecific, and Total Missing Values per Person
SC2: W5 SC3: W2 SC3: W7 SC4: W3
Number of missing
values per person
Freq. % Freq. % Freq. % Freq. %
Implausibe value
0 638 98.00 558 98.94 279 99.64 1065 99.07
1 11 1.69 6 1.06 1 0.36 10 0.93
2 2 0.31 0 0 0 0 0 0
3 0 0 0 0 0 0 0 0
Total 651 100 564 100 280 100 1075 100
>= 1 13 2.00 6 1.06 1 0.36 10 0.93
Unspecific missing
0 581 89.25 511 90.60 259 92.50 980 91.16
1 50 7.68 40 7.09 14 5.00 71.00 6.60
2 10 1.54 9 1.60 6 2.14 16 1.49
3 5 0.77 2 0.35 0 0 1 0.09
NEPS Survey Paper No. 82, 2021 Page 7Hawrot
SC2: W5 SC3: W2 SC3: W7 SC4: W3
Number of missing
values per person
Freq. % Freq. % Freq. % Freq. %
4 2 0.31 2 0.35 1 0.36 4 0.37
5 0 0.00 0 0 0 0 0 0
6 2 0.31 0 0 0 0 3 0.28
7 1 0.15 0 0 0 0 0 0
8 0 0 0 0 0 0 0 0
Total 651 100 564 100 280 100 1075 100
>= 1 70 10.75 53 9.40 21 7.50 95 8.84
Total missing
0 572 87.86 506 89.72 258 92.14 972 90.42
1 53 8.14 44 7.80 15 5.36 77 7.16
2 16 2.46 10 1.77 6 2.14 18 1.67
3 5 0.77 2 0.35 0 0 1 0.09
4 2 0.31 2 0.35 1 0.36 4 0.37
5 0 0 0 0 0 0 0 0
6 2 0.31 0 0 0 0 3 0.28
7 1 0.15 0 0 0 0 0 0
8 0 0 0 0 0 0 0 0
Total 651 100 564 100 280 100 1075 100
>= 1 79 12.14 58 10.28 22 7.86 103 9.58
Note. SC2 = Starting Cohort 2; SC3 = Starting Cohort 3; SC4 = Starting Cohort 4; W = Wave.
NEPS Survey Paper No. 82, 2021 Page 8Hawrot
4.1.2 Missing responses per item
Table 5 contains information about implausible, unspecific missing, and total missing values
per item. Again, implausible values appeared incidentally. Unspecific missing value rates per
item ranged from 0% to 7.1% depending on the item and wave/starting cohort. Item e22540f
had the highest rates (4.3% or more in all waves and starting cohorts).
Table 5
Rates of Implausible, Unspecific, and Total Missing Values per Item
SC2: W5 SC3: W2 SC3: W7 SC4: W3
Item
Freq. % Freq. % Freq. % Freq. %
Implausible value
e22540a 0 0 1 0.18 0 0 0 0
e22440b 2 0.31 0 0 0 0 1 0.09
e22340c 0 0 0 0 0 0 0 0
e22540d 2 0.31 0 0 0 0 0 0
e22540e 0 0 1 0.18 0 0 2 0.19
e22540f 1 0.15 0 0 0 0 1 0.09
e22340g 1 0.15 0 0 0 0 2 0.19
e22540h 0 0 0 0 0 0 0 0
e22440i 1 0.15 0 0 0 0 1 0.09
e22340j 6 0.92 3 0.53 0 0 2 0.19
e22540k 2 0.31 0 0 1 0.36 0 0
e22540l 0 0 1 0.18 0 0 1 0.09
Unspecific missing
e22540a 6 0.92 5 0.89 2 0.71 5 0.47
e22440b 6 0.92 2 0.35 1 0.36 9 0.84
e22340c 1 0.15 0 0 0 0 2 0.19
e22540d 6 0.92 6 1.06 4 1.43 17 1.58
NEPS Survey Paper No. 82, 2021 Page 9Hawrot
SC2: W5 SC3: W2 SC3: W7 SC4: W3
Item
Freq. % Freq. % Freq. % Freq. %
e22540e 7 1.08 3 0.53 0 0 5 0.47
e22540f 46 7.07 28 4.96 12 4.29 55 5.12
e22340g 11 1.69 10 1.77 3 1.07 19 1.77
e22540h 3 0.46 2 0.35 2 0.71 5 0.47
e22440i 4 0.61 4 0.71 3 1.07 5 0.47
e22340j 9 1.38 5 0.89 0 0 5 0.47
e22540k 7 1.08 6 1.06 1 0.36 7 0.65
e22540l 6 0.92 1 0.18 2 0.71 6 0.56
Total missing
e22540a 6 0.92 6 1.06 2 0.71 5 0.47
e22440b 8 1.23 2 0.35 1 0.36 10 0.93
e22340c 1 0.15 0 0.00 0 0.00 2 0.19
e22540d 8 1.23 6 1.06 4 1.43 17 1.58
e22540e 7 1.08 4 0.71 0 0.00 7 0.65
e22540f 47 7.22 28 4.96 12 4.29 56 5.21
e22340g 12 1.84 10 1.77 3 1.07 21 1.95
e22540h 3 0.46 2 0.35 2 0.71 5 0.47
e22440i 5 0.77 4 0.71 3 1.07 6 0.56
e22340j 15 2.30 8 1.42 0 0.00 7 0.65
e22540k 9 1.38 6 1.06 2 0.71 7 0.65
e22540l 6 0.92 2 0.35 2 0.71 7 0.65
Note. SC2 = Starting Cohort 2; SC3 = Starting Cohort 3; SC4 = Starting Cohort 4; W = Wave.
The total missing values per item and the number of unspecific missing values per item hardly
differed because of the low share of implausible values in the total missing values. As a
consequence, the total missing values are not described.
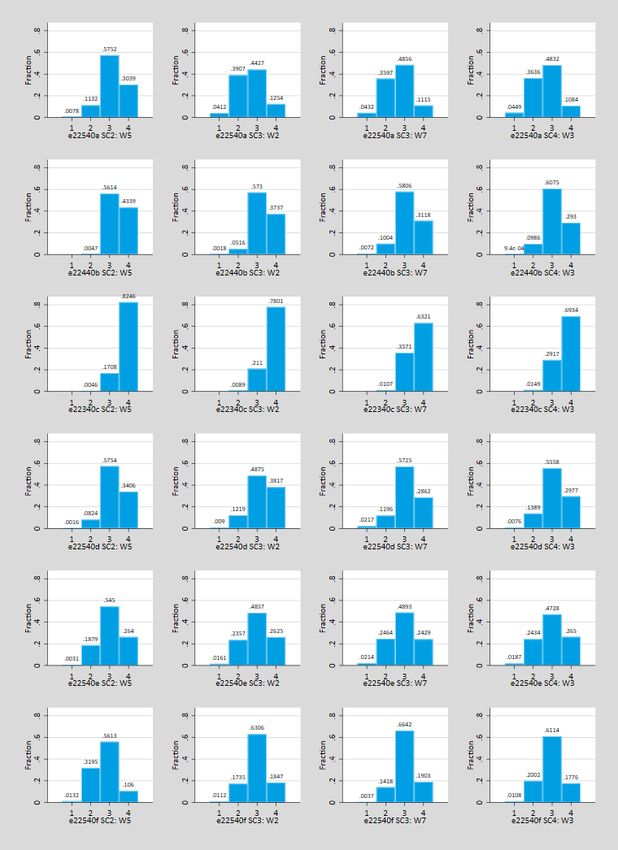
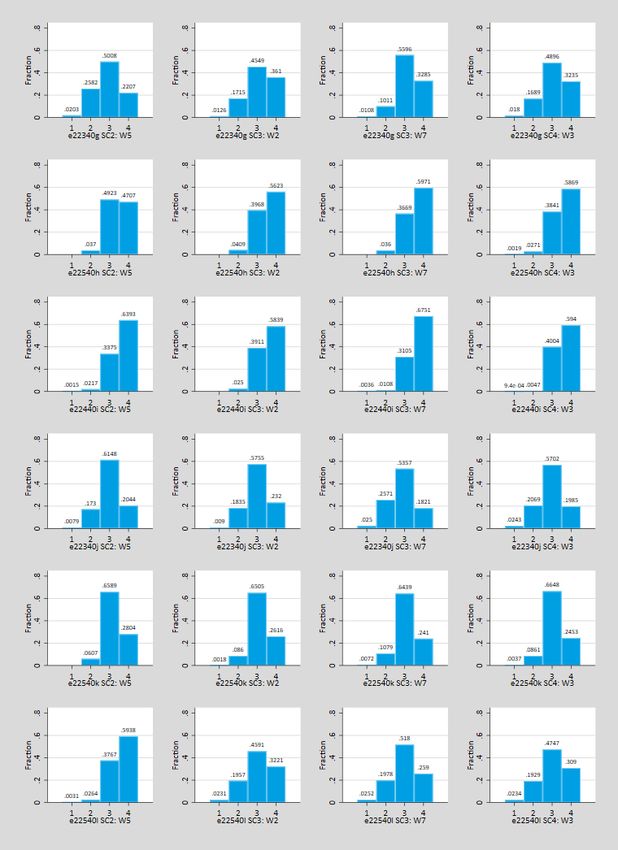
NEPS Survey Paper No. 82, 2021 Page 10Hawrot In summary, the implausible value rates per item were low. In conjunction with the very low rates per person, this result suggests that respondents did not experience major difficulties with using the scale’s response format. The unspecific missing value rates per item and per person were acceptable, although item e22540f had increased rates compared to the other items. 4.2 Item Distributions Figures 1 and 2 present the item response distributions in all samples. The distributions of multiple items were skewed or severely skewed towards higher values. Moreover, ceiling effects appeared (see e.g., e22440c, e22540h, e22540i) and scale restrictions were present. For five items no responses were recorded for the category does not apply (e.g., e22440c, e22540h, e22540k) in at least one sample. For seven other items, although the respondents used all of the categories, under 2.5% of responses were recorded for the category does not apply (e.g., e22540d, e22540f, e22540l). Moreover, for some items hardly any responses were recorded for the second lowest category (does not really apply, e.g., items e22340c, e22490i). The above mentioned problems were present in all starting cohorts. NEPS Survey Paper No. 82, 2021 Page 11
Hawrot

Note. SC2 = Starting Cohort 2; SC3 = Starting Cohort 3; SC4 = Starting Cohort 4; W = Wave.

Figure 1. Item response distributions: items e22540a - e222540f.

NEPS Survey Paper No. 82, 2021                                                               Page 12
Hawrot

Note. SC2 = Starting Cohort 2; SC3 = Starting Cohort 3; SC4 = Starting Cohort 4; W = Wave.

Figure 2. Item response distributions: items e22340g - e22540l.

NEPS Survey Paper No. 81, 2021                                                               Page 13
Hawrot

4.3 Discriminatory Power and Reliability
To assess the discriminatory power of the items we calculated item-rest correlations within
each subscale. Please note that the Student Support subscale included only two items and
therefore the reported value represents the correlation between the two items. The
discriminatory power of the items was low (.147) to moderate (.428) and reached moderate
values (> .3) in all samples in the case of only one item (e22540l). The reliabilities were also
dissatisfactory, even for the longest subscale. They oscillated around .4 for Classroom
Management and Student Support, and around .55 for Cognitive Activation. The results are
presented in Table 6.

Table 6

Item-rest Correlations and Reliability Coefficients by Starting Cohort and Wave

                            Item-rest correlation          Cronbach’s α
Subscale/item
                         SC2:    SC3:   SC3:   SC4:   SC2: SC3: SC3:      SC4:
                         W5      W2     W7     W3     W5 W2 W7            W3

Classroom Management

   e22340c              .248     .239   .270   .293

   e22340g              .168     .184   .255   .223   .361 .388 .441      .442

   e22340j              .236     .300   .291   .299

Student Support

   e22440b
                        .258     .189   .257   .343   .408 .317 .402      .506
   e22440i

Cognitive Activation

   e22540a              .147     .310   .327   .349

   e22540d              .252     .205   .260   .285

   e22540e              .337     .286   .203   .261

   e22540f              .247     .270   .232   .331   .544 .565 .534      .605

   e22540h              .280     .210   .197   .270

   e22540k              .339     .328   .243   .322

   e22540l              .317     .390   .369   .428

NEPS Survey Paper No. 81, 2021                                                           Page 14
Hawrot 4.4 Internal Structure Next, we tested the measure’s internal structure. To increase the chances that the sample consisted of respondents who were committed to filling in the scale and provided valid responses, we excluded teachers who had four or more missing values in the scale (over 25% of items). First, we ran confirmatory factor analysis to test whether the expected three-factor structure held in independent samples. The models did not include any cross-loadings, but factors were allowed to correlate. The fit of the three-factor model was poor, which indicated that the expected structure did not hold. Detailed information is presented in Table 7. Second, because the CFA models did not fit, we ran exploratory factor analysis for each wave of each starting cohort separately to explore the scale’s internal structure. We tested models with up to three factors. The scree test, Kaiser criterion, model fit, and interpretability of the results served as selection criteria. However, we did not find any solution that would satisfy the criteria. The models either fitted poorly, or were difficult to interpret. Moreover, the extracted factors differed between waves in their salient loadings. Table 7 Fit of the Three-Factor CFA Models Sample n Npar 2 Df p RMSEA CFI TLI SC2: W5 646 46 321.27 51 < .001 .091 .760 .690 SC3: W2 562 46 356.18 51 < .001 .103 .699 .611 SC3: W7 279 46 153.38 51 < .001 .085 .765 .696 SC4: W3 1068 46 717.23 51 < .001 .111 .765 .696 Note. SC2 = Starting Cohort 2; SC3 = Starting Cohort 3; SC4 = Starting Cohort 4; W = Wave; Npar = number of free parameters. Response categories does not apply (1) and does not really apply (2) were merged in items e22440b, e22540h, e22440i, and e22540k to assure the same number of categories in each sample. As a consequence, we decided to exclude items e22440b, e22340c, e22540h, and e22440i from further analyses. The items were discarded due to their severely skewed response distributions (e22340c, e22540h, e22440i), dissimilar content (e22440b, e22340c, e22440i), or low factor loadings in SC2, Wave 5 (e22440b, e22340c, e22540h, e22440i). All excluded items met at least two out of three above mentioned criteria. The items discarded because of their dissimilar content tapped teacher perceptions of student behavior (e22440b, e22340c) or teacher-student relationship (e22440i), whereas the other items referred to teaching practices or to the way of organizing instruction. We used information on factor loadings from one sample instead of all samples to inform the item selection in order to avoid overfitting the final model. Next, we reran EFA on SC2 sample. Due to satisfactory properties of the two-factor solution in SC2, Wave 5, we ran EFA on the remaining samples. The scree test and Kaiser criterion NEPS Survey Paper No. 81, 2021 Page 15
Hawrot
pointed again to the two-factor solution, and the models had good fit to the data. Detailed
results are presented in Table 8.
Table 8
Fit of the Two-Factor EFA Models
Sample n Npar 2 Df p RMSEA CFI TLI
SC2: W5 646 15 33.46 13 .002 .049 .964 .923
SC3: W2 562 15 17.88 13 .162 .026 .993 .985
SC3: W7 279 15 8.98 13 .775 .000 1.000 1.033
SC4: W3 1068 15 26.62 13 .014 .031 .992 .983
Note. SC2 = Starting Cohort 2; SC3 = Starting Cohort 3; SC4 = Starting Cohort 4; W = Wave; Npar = number of free parameters. Items
e22440b, e22340c, e22540h, and e22440i were excluded. Response categories does not apply (1) and does not really apply (2) were
merged in item e22540k to assure the same number of categories in each sample.
Table 9
Factor Loadings in the Two-Factor EFA Models
Item SC2: W5 SC3: W2 SC3: W7 SC4: W3
F1 F2 F1 F2 F1 F2 F1 F2
e22540a -0.101 0.421* 0.032 0.578* 0.123 0.559* 0.001 0.644*
e22540d 0.532* 0.102 0.654* -0.082 0.416* 0.136 0.676* -0.010
e22540e 0.269* 0.293* 0.335* 0.159* 0.358* 0.039 0.362* 0.078*
e22540f 0.779* -0.002 0.666* 0.003 0.651* -0.002 0.697* 0.016
e22340g 0.637* -0.032 0.603* 0.037 0.629* -0.040 0.624* -0.008
e22340j 0.427* 0.047 0.383* -0.038 0.460* 0.096 0.390* 0.002
e22540k 0.053 0.545* 0.164* 0.334* 0.088 0.198 0.096* 0.390*
e22540l -0.003 0.757* -0.005* 0.991* -0.004 0.918* -0.002 0.950*
F.corr .183* .195* .262* .259*
Note. SC2 = Starting Cohort 2; SC3 = Starting Cohort 3; SC4 = Starting Cohort 4; W = Wave; F. corr. = factor correlation. Items e22440b,
e22340c, e22540h, and e22440i were excluded. Response categories does not apply (1) and does not really apply (2) were merged in item
e22540k to assure the same number of categories in each sample. Salient loadings are in bold type.
* p < .05
NEPS Survey Paper No. 81, 2021 Page 16Hawrot However, the extracted factors did not resemble the expected ones. For example, the items originally assigned to Cognitive Activation loaded on both factors, and F1 factor gathered items belonging to Cognitive Activation and Classroom Management. Moreover, the pattern of factor loading was not fully consistent across samples. For example, item e22540k did not load on F2 factor in Wave 7 of SC3, whereas it did so in the other samples; item e22540e loaded on both factors in Wave 5 of SC2, but saliently on F1 only in the other samples. Wave 2 of SC2 and Wave 3 of SC4 had the most similar factor structure. Factor loadings in the two- factor EFA models are presented in Table 9. In summary, the results did not support the expected structure of the scale. We did not find the three factors corresponding to the dimensions of instructional quality. Instead, two factors resembling direct transmission (F1) and constructivist (F2) beliefs about teaching emerged. However, they referred to teaching behavior or teaching strategies instead of convictions. Therefore, the scale needs a substantial revision. Possible changes include rewording or replacing the items with unclear assignment to factors and balancing the number of items in different subscales. 5. Summary This paper documents the “Teaching quality” scale used in Starting Cohort 2, Starting Cohort 3, and Starting Cohort 4 to assess teacher perceptions of the quality of their own instruction. Besides providing information about the scale’s source and theoretical background, the paper reports basic information about its psychometric properties. The scale was administered four times: in Wave 5 of SC2, Waves 2 & 7 of SC3, and Wave 3 of SC4. The analyses showed that the rates of missing values per person and per item were acceptable in all waves, although item e22540f had the highest rates in all samples. Under 2% of teachers provided at least one implausible response, whereas from 7.5% (Wave 7 of SC3) to 10.8% (Wave 5 of SC2) omitted one or more items. The item response distributions were skewed and the percentages of responses recorded for the lowest category were very low in all samples. Item e22340c showed particularly severe skewing, which included restricted response range. The items’ discriminatory power was low except for one item (e22540l). The subscale reliabilities were was also low—they did not exceed .44 for Classroom Management, .51 for Student Support and .61 for Cognitive Activation. The expected three-factor structure did not hold. Exploratory factor analyses revealed that the scale was two-dimensional, however, this required excluding four items. Moreover, the extracted factors, which resembled direct transmission and constructivist approach to teaching, differed to some extent between the samples. The results suggest that the scale does not provide the expected information about instructional quality and as a consequence, needs a major revision. Possible changes include modifying or replacing severely skewed items and items with a low discriminatory power or unclear assignment to subscales, modifying the response scale, and balancing the number of items in different subscales. NEPS Survey Paper No. 81, 2021 Page 17
Hawrot

References

Beauducel, A., & Herzberg, P. Y. (2006). On the performance of maximum likelihood versus

         means and variance adjusted weighted least squares estimation in CFA. Structural

         Equation Modeling, 13(2), 186–203.

Blossfeld, H.-P., Rossbach, H.-G., & von Maurice, J. (Eds.). (2011). Education as a Lifelong

         Process—The German National Educational Panel Study (NEPS). [Special Issue]

         Zeitschrift fuer Erziehungswissenschaft, 14.

Codebuch zum Lehrerfragebogen Welle 1 [BiKS-8-14 Grundschule]. (n.d.). Otto-Friedrich-

         Universität Bamberg, DFG.

Flora, D. B., & Curran, P. J. (2004). An empirical evaluation of alternative methods of

         estimation for confirmatory factor analysis with ordinal data. Psychological Methods,

         9(4), 466–491. https://doi.org/10.1037/1082-989X.9.4.466

Furthmüller, P. (2014). Skalenverzeichnis. Skalen und Indizes der Scientific-Use-Files 2005 bis

         2009. Studie zur Entwicklung von Ganztagsschulen (StEG).

Hattie, J. (2009). Visible learning: A synthesis of over 800 meta-analyses relating to

         achievement. Routledge.

Hawrot, A. (2021). Psychometric properties of the “Quality of instruction” scale in Starting

         Cohort 3 (NEPS Survey Paper No. 81). Leibniz Institute for Educational Trajectories,

         National Educational Panel Study.

Hu, L., & Bentler, P. M. (1999). Cutoff criteria for fit indexes in covariance structure analysis:

         Conventional criteria versus new alternatives. Structural Equation Modeling: A

         Multidisciplinary Journal, 6(1), 1–55. https://doi.org/10.1080/10705519909540118

NEPS Survey Paper No. 81, 2021                                                               Page 18
Hawrot
McDonald, R. P., & Ho, M.-H. R. (2002). Principles and practice in reporting structural
equation analyses. Psychological Methods, 7(1), 64–82.
https://doi.org/10.1037/1082-989X.7.1.64
Muthén, L. K., & Muthén, B. O. (1998-2015). Mplus user’s guide. Seventh edition (7th ed.).
Muthén & Muthén.
Praetorius, A.-K., Klieme, E., Herbert, B., & Pinger, P. (2018). Generic dimensions of teaching
quality: The German framework of Three Basic Dimensions. ZDM, 50(3), 407–426.
https://doi.org/10.1007/s11858-018-0918-4
Seidel, T., & Shavelson, R. J. (2007). Teaching effectiveness research in the past decade: The
role of theory and research design in disentangling meta-analysis results. Review of
Educational Research, 77(4), 454–499. https://doi.org/10.3102/0034654307310317
Skopek, J., Pink, S., & Bela, D. (2012a). Data manual. Starting Cohort 2—From kindergarten
to elementary school. NEPS SC2 1.0.0 (NEPS Research Data Paper). University of
Bamberg.
Skopek, J., Pink, S., & Bela, D. (2012b). Data manual. Starting Cohort 3—From lower to upper
secondary school. NEPS SC3 1.0.0 (NEPS Research Data Paper). University of
Bamberg.
Skopek, J., Pink, S., & Bela, D. (2013). Starting Cohort 4: 9th Grade (SC4). SUF Version 1.1.0.
Data Manual. (NEPS Research Data Paper). University of Bamberg.
Steinert, B., Gerecht, M., Klieme, E., & Doebrich, P. (2003). Skalen zur Schulqualität:
Dokumentation der Erhebungsinstrumente. ArbeitsPlatzUntersuchung (APU),
Pädagogische EntwicklungsBilanzen (PEB) (No. 10; Materialien Zur
Bildungsforschung). GFPF.
NEPS Survey Paper No. 81, 2021 Page 19You can also read


