Evaluating the 20th Century Reanalysis
←
→
Page content transcription
If your browser does not render page correctly, please read the page content below

Evaluating the
20th Century Reanalysis
      Gilbert P. Compo1,2,
      Jeffrey S. Whitaker2,
  Prashant D. Sardeshmukh1,2,
     and Benjamin Giese3

 compo@colorado.edu
 1Univ.of Colorado/CIRES
 Climate Diagnostics Center and
 2NOAA Earth System Research

 Laboratory/PSD
 3Texas A&M University                    Compo et al. 2011, doi:10.1002/qj.776

          Special thanks to NCEP/EMC, NCDC, Hadley Centre, ACRE partners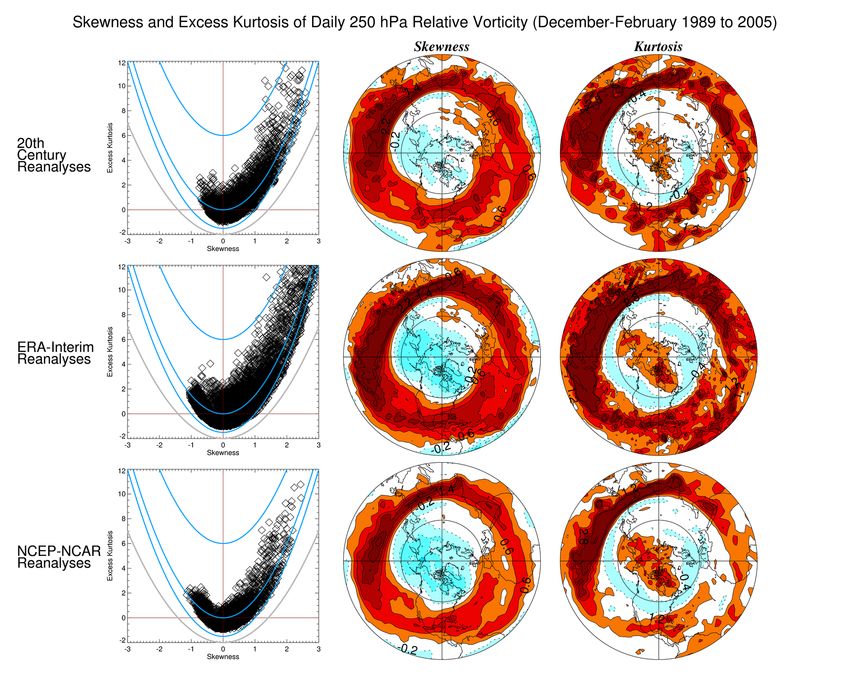
The Twentieth Century Reanalysis Project
Summary: An international collaborative project led by NOAA and CIRES!
to produce high-quality tropospheric reanalyses for the last 130 years !
using only surface pressure observations (this is not a minus!).!

The reanalyses provide:!
-First-ever estimates of near-surface and tropospheric 6-hourly fields !
         !extending back to end of the 19th century; !
-Estimates of uncertainties in the basic reanalyses;!
-Estimates of uncertainties in derived quantities (storm tracks, etc.)!

Higher quality in the Northern Hemisphere than in the Southern Hemisphere.!

US Department of Energy INCITE, Office of Science computing awards and !
NOAA Climate Program Office partnership to produce 1871-2008 and extend to
2010 in 2011.!

                     Compo et al. 2011, doi:10.1002/qj.776                    2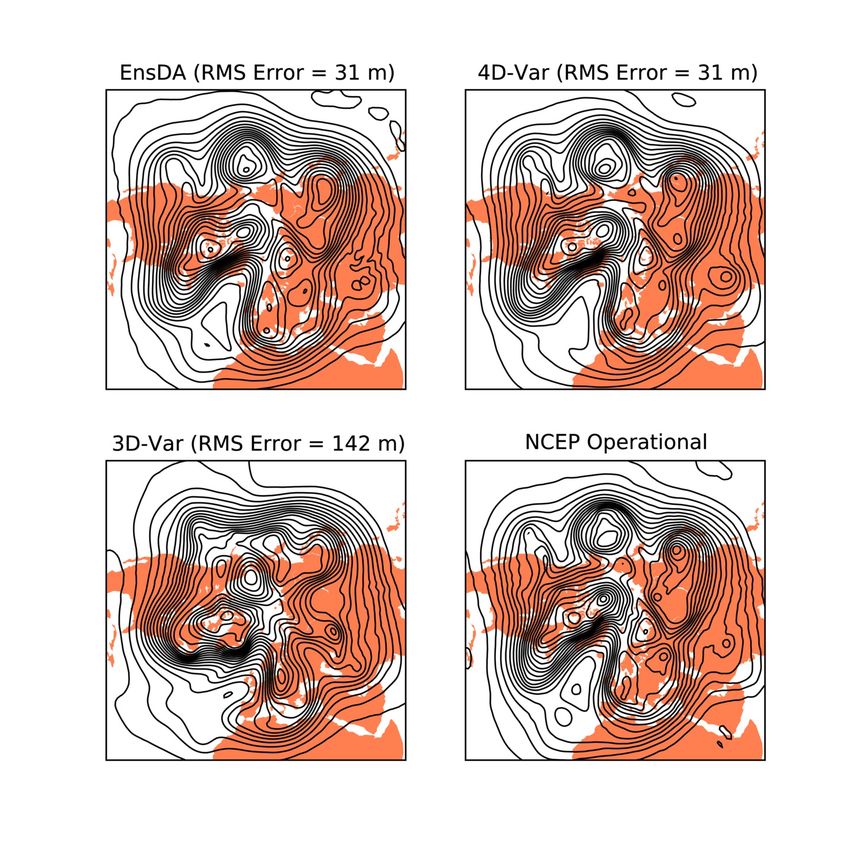
Ensemble Filter Algorithm
                       (Whitaker and Hamill 2002)

Algorithm uses an ensemble to produce the weight that

varies with the atmospheric flow and the observation network

y is surface pressure from the International Surface Pressure Databank v2,

Hxb is guess surface pressure

x is pressure, air temperature, winds, humidity, etc. at all


levels and gridpoints.

Using 56 member Ensemble
HadISST monthly boundary conditions (Rayner et al. 2003)

Version 2 (1871-2008): T62, 28 level NCEP GFS08ex model
                                                                                 3
        - time-varying CO2, solar and volcanic radiative forcing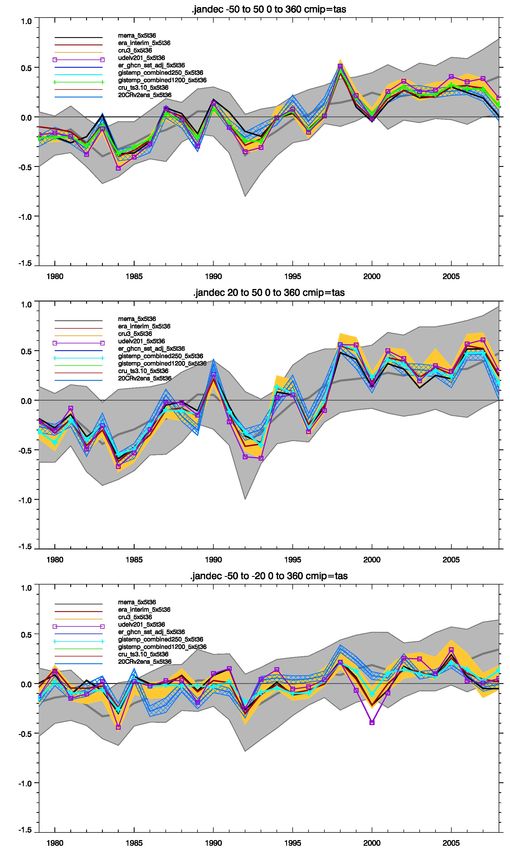
Local Anomaly Correlation of subdaily
               20th Century Reanalysis (20CR),
  ERA40, and radiosonde 300 hPa geopotential height anomalies
                        (1958 to 1978)

       0.35     0.55    0.75   0.90   0.975

Black curve     Northern Hemisphere agreement is excellent where NNR and ERA40
shows where     agree.
NCEP-NCAR
and ERA40       Tropical agreement is moderate to poor with radiosondes but higher with ERA40.
correlate

> 0.975

      Southern Hemisphere agreement is moderate to poor with
                ERA40 but higher with radiosondes.
  Compo et al. 2011                                                                        4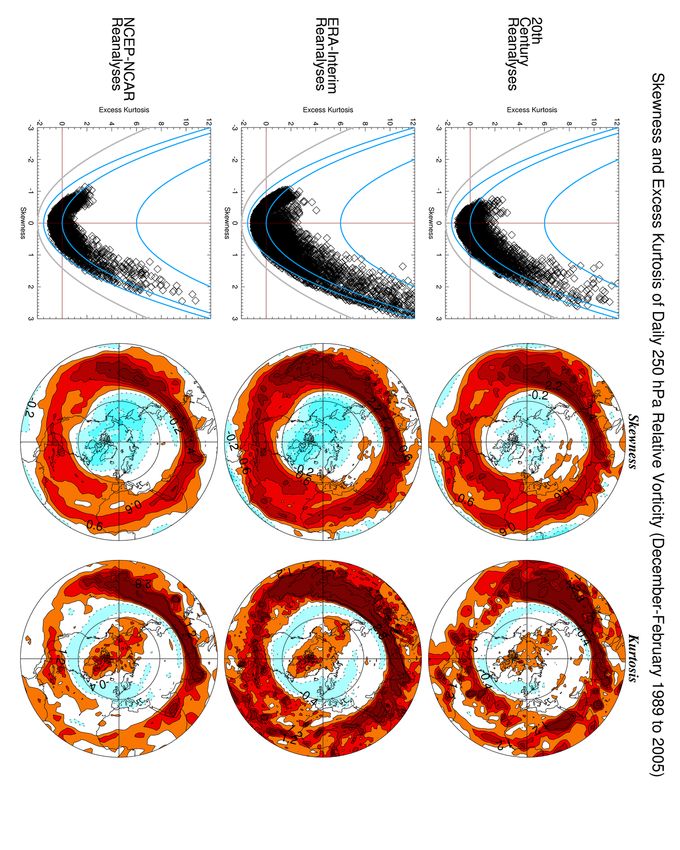
Local Anomaly Correlation of subdaily 300 hPa geopotential height
  anomalies from 20th Century Reanalysis (20CRv2) and ERA40
                          (1979 to 2001)

 Black curves
 show where
 NCEP-NCAR
 and ERA40
 correlate

 > 0.975

           Northern and Southern Hemisphere agreement are excellent between
           20CRv2 and ERA40 when ERA40 has satellite observations.

Compo et al. 2011                                                             5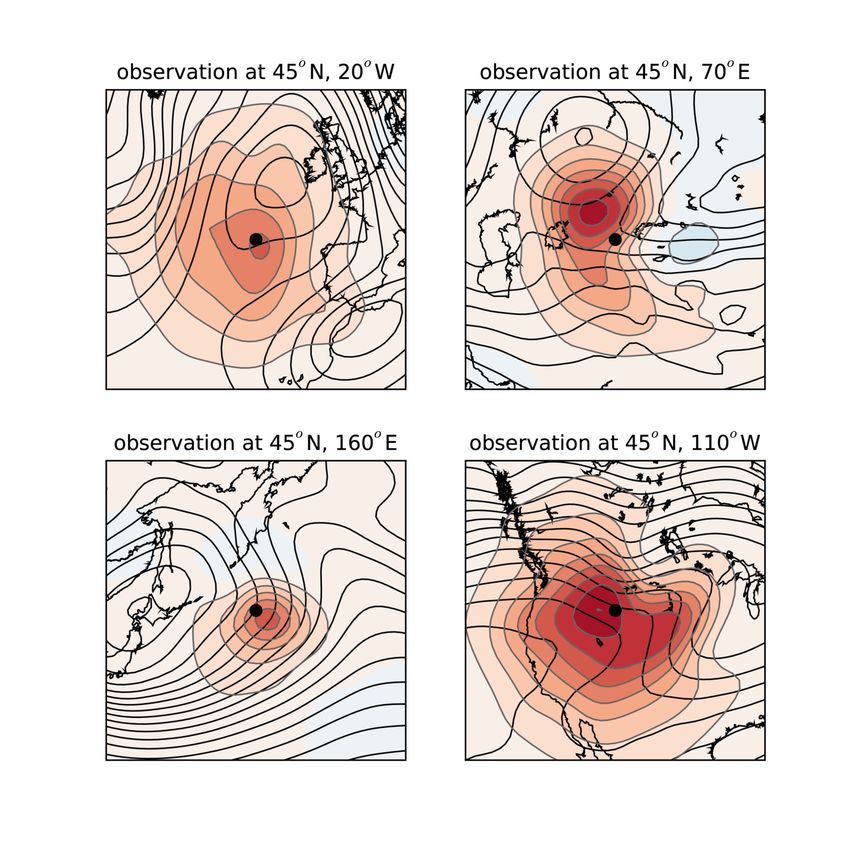
Surface Pressure uncertainty estimate poleward of 20(S,N)
blue actual RMS difference
red expected RMS difference

        Northern Hemisphere                   Southern Hemisphere
              Nobs
                                                            Nobs

    Uncertainty estimates are consistent with actual differences
    between first guess and pressure observations even as the
    network changes over more than 100 years!
Compo et al. 2011                                                   6
RMS Errors of 24 hour forecasts verified against Marine obs
for forecasts initialized with NCEP-NCAR Reanalysis, 20CR, and ERA40 (1948-2008)

                                                       ERA40
                                                                 persistence
           persistence                             NNR

                                                                    20CR
           20CR

           NNR

                    ERA40

      Before the satellite era (1970s), there is substantially better skill
      for 20CR than for NCEP-NCAR Reanalysis or ERA40 in the
      Southern Hemisphere despite the lack of upper-air observations.
Compo et al. 2011                                                                  7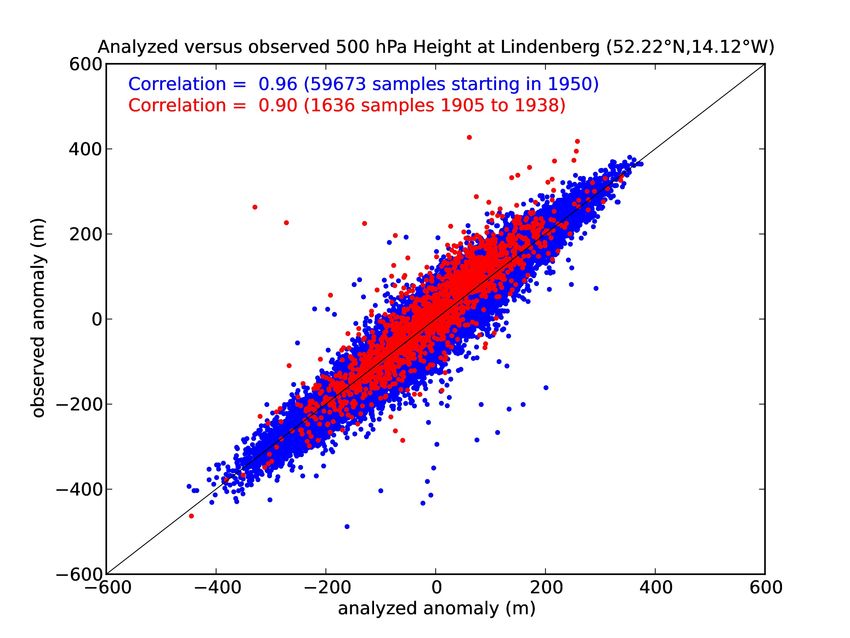
Pattern correlation between 20CR and ERA40 and
  NCEP-NCAR Reanalyses of monthly anomalies of
  300 hPa geopotential height
                                                             Correlation
                                                             Between
                                                             NNR and
                                                             20CR (and
                                                             ERA-40 and
                                                             20CR)

                                                             Correlation
                                                             Between
                                                             NNR and an
                                                             SST-forced
                                                             simulation

Reanalysis correlations are much higher than for SST-forced simulation.
1970s change in correlations show satellite data improving NNR and ERA-40.
Compo et al. 2011                                                          8
1979 to 2008 Near Surface
      Annual Mean Temperature Anomalies
          for Land only (50N to 50S)
                                                      CMIP3 95%

                  MERRA (0.91)                      CRUMTEM3 95%
                  CRUMTEM3 (0.91)
                  GISTEMP1200 (0.91)                 20CR 95%
                  ERA-Interim (0.89)
                  U. of Delaware (0.88)
    1979                                                           2008
Correlations between 20CR and thermometer-based estimates (in
parentheses) are relatively high. 95% error ranges are largely consistent.   9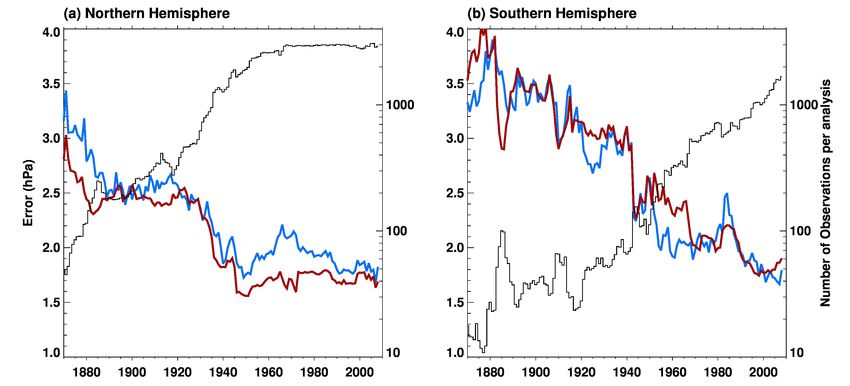
Seasonal climate indices from Statistical Reconstructions,
        SST-forced GCM integrations, and 20th Century, ERA-40,
        NCEP-NCAR, ERA-Interim Reanalyses.
Pacific Walker
Circulation
(500 hPa
vertical velocity,
SONDJ

North Atlantic
Oscillation
(Sea Level
Pressure, DJF)

Pacific-North
America
Pattern Index
(500 hPa
geopotential
height, DJF)         1870 -Agreement is high between observation-based estimates               2008
                           (correlations between ERA-40 and 20CRv2 > 0.95)
  Compo et al. 2011
                           -No significant trends from 1870 to 2008 in any of these indices.     10
Storm Track
Skewness of Northern Hemisphere 250 hPa daily Vorticity
(Dec-Feb) 1989/90-2005/06
1.8
1.4
1.0
0.6
0.2
-0.2
-0.6
-1.0
-1.4
ERA Interim (~50km) 20CRv2 (~200km) NCEP-NCAR (~200km)
Uses satellite and Surface pressure only Uses satellite and
upper-air data upper-air data
11Skewness of 250 hPa Vorticity from 20th Century Reanalyses
DJF 1989/90-2005/06 DJF 1891/92-2005/06
1.8
1.4
1.0
0.6
0.2
-0.2
-0.6
-1.0
-1.4
Storm Track Features are remarkably robust
Sardeshmukh, Compo, Penland (2012) 12Summary
• Demonstrated that surface-based reanalyses throughout the
troposphere are feasible using advanced data assimilation and
surface pressure observations.
• Effectively doubling the reanalysis record length from ~60 year
to more than 140 years, allowing current atmospheric circulation
patterns to be placed in a broader historical context.
• Southern Hemisphere fields may be an improvement over first-
generation upper-air based reanalyses before the satellite era.
• Challenges: Validating the dataset in regions of sparse
observations and rapid change, e.g., the Arctic.
• Large-scale variability appears comparable to other reanalyses
that used the complete set of meteorological observations.
• For status updates, email
– jeffrey.s.whitaker@noaa.gov,
– compo@colorado.edu
13Co-authors on 20th Century Reanalysis Project
• Gilbert P. Compo, co-Lead Twentieth Century Reanalysis Project, University of Colorado, CIRES, Climate Diagnostics
Center & NOAA Earth System Research Laboratory, Physical Sciences Division !
• Jeffrey S. Whitaker, co-Lead Twentieth Century Reanalysis Project, NOAA Earth System Research Laboratory,
Physical Sciences Division !
• Prashant D. Sardeshmukh, University of Colorado, CIRES, Climate Diagnostics Center & NOAA Earth System
Research Laboratory, Physical Sciences Division!
• Nobuki Matsui, University of Colorado, CIRES, Climate Diagnostics Center & NOAA Earth System Research
Laboratory, Physical Sciences Division !
• Robert J. Allan, ACRE Project Manager, Hadley Centre, Met Office, United Kingdom !
• Xungang Yin, STG Inc., Asheville, NC!
• Byron E. Gleason, Jr., NOAA National Climatic Data Center !
• Russell S. Vose, NOAA National Climatic Data Center !
• Glenn Rutledge, NOAA National Climatic Data Center !
• Pierre Bessemoulin, Meteo-France !
• Stefan Brönnimann, ETH Zurich !
• Manola Brunet, Centre on Climate Change (C3), Universitat Rovira i Virgili !
• Richard I. Crouthamel, International Environmental Data Rescue Organization !
• Andrea N. Grant, ETH Zurich !
• Pavel Y. Groisman, University Corporation for Atmospheric Research & NOAA National Climatic Data Center!
• Philip D. Jones, Climatic Research Unit, University of East Anglia !
• Michael Kruk, STG Inc., Asheville, NC !
• Andries C. Kruger, South African Weather Service !
• Gareth J. Marshall, British Antarctic Survey !
• Maurizio Maugeri, Dipartimento di Fisica, Università delgi Studi di Milano !
• Hing Y. Mok, Hong Kong Observatory !
• Øyvind Nordli, Norwegian Meteorologisk Institutt !
• Thomas F. Ross, NOAA Climate Database Modernization Program, National Climatic Data Center !
• Ricardo M. Trigo, Centro de Geofísica da Universidade de Lisboa, IDL, University of Lisbon !
• Xiaolan L. Wang, Environment Canada !
• Scott D. Woodruff, NOAA Earth System Research Laboratory, Physical Sciences Division !
• Steven J. Worley, National Center for Atmospheric ResearchThank you to 59 organizations contributing observations to ISPD:
All Russia Research Institute of Hydrometeorological Niue Met Service
Information WDC NIWA
Atmospheric Circulation NOAA Climate Database Modernization Program
Reconstructions over the Earth (ACRE) NOAA Earth System Research Laboratory
Australian Bureau of Meteorology NOAA National Climatic Data Center
Australian Meteorological Association, Todd Project Team NOAA National Centers for Environmental Prediction
British Antarctic Survey NOAA Northeast Regional Climate Center at Cornell U.
Cook Islands Met Service NOAA Midwest Regional Climate Center at UIUC
Danish Meteorological Institute NOAA Pacific Marine Environmental Laboratory
Deutscher Wetterdienst Norwegian Meteorological Institute
EMULATE Oldweather.org
Environment Canada Ohio State U. – Byrd Polar Research Center
ETH-Zurich Portuguese Meteorological Institute (IM)
European Reanalysis and Observations for Monitoring Proudman Oceanographic Laboratory
GCOS AOPC/OOPC WG on Surface Pressure SIGN - Signatures of environmental change in the
GCOS/WCRP Working Group on Datasets observations of the Geophysical Institutes
Hong Kong Observatory South African Weather Service
IBTRACS Univ. of Bern, Switzerland
Icelandic Meteorological Office UK Met Office Hadley Centre
ICOADS U. of Colorado-CIRES/Climate Diagnostics Center
Instituto Geofisico da Universidade do Porto U. of East Anglia-Climatic Research Unit
IEDRO U. of Giessen –Dept. of Geography
JAMSTEC U. of Lisbon-Instituto Geofisico do Infante D. Luiz
Japan Meteorological Agency U. of Milan-Dept. of Physics
Jersey Met Dept. U. Rovira i Virgili-CCRG
KNMI U. of South Carolina
MeteoFrance U. of Toronto-Dept of Physics
MeteoFrance – Division of Climate U. of Washington
Meteorological and Hydrological Service, Croatia World Meteorological Organization - MEDARE
ZAMG (Austrian Weather Service)
National Center for Atmospheric Research
Nicolaus Copernicus University
15International Surface Pressure Databank version 2 (ISPD)
Subdaily observations assembled in partnership with
GCOS AOPC/OOPC Working Group on Surface Pressure
GCOS/WCRP Working Group on Observational Data Sets for Reanalysis
Atmospheric Circulation Reconstructions over the Earth (ACRE)
Land data Component: merged by NOAA NCDC, NOAA ESRL, and CU/CIRES
– 33 data sources
– 33,653 stations
– 1.7 billion obs
– 1768-2008
Marine data component: ICOADS merged by NOAA ESRL and NCAR NOAA
Tropical Cyclone Best Track data component: IBTrACS merged by NOAA NCDC
See Poster T176A by C. McColl et al.Extra Slides
www.esrl.noaa.gov/psd/data/20thC_Rean/

20CR homepage has links for publications that
use the data, data access and
tools for visualizing and analyzing the data. 18
Historical Reanalysis Status and Plans
20th Century Reanalysis Project http://www.esrl.noaa.gov/psd/data/20thC_Rean
•   Data Access: Analyses and ISPD (with feedback) freely available from NCAR, analyses
    from NOAA/ESRL and DOE NERSC. Coming Soon: NOAA/NCDC.
•   Fall 2011: 1871-2008, expand to 2010 (includes time-varying CO2, volcanic aerosols, GFS
    from NCEP). Ensemble mean and spread and some individual member variables
    online now.
     – http://www.esrl.noaa.gov/psd/data/gridded/data.20thC_ReanV2.html (NOAA ESRL)
     – http://dss.ucar.edu/datasets/ds131.1 (NCAR)
     – http://portal.nersc.gov/20C_Reanalysis Every member (US Dept of Energy, NERSC)
     – http://nomads.ncdc.noaa.gov (NOAA NCDC, coming soon)
     – Coordinate with PCMDI CMIP5 distribution and validation for IPCC AR5

ECMWF Reanalysis Archive-Climate (ERA-CLIM)
•   Series of reanalyses, including Surface-observation based back to 1900 (ERA-20C).
•   ERA-20C: T159 spectral (~125km grid spacing)
•   ERA-20C: Available 2012
Project Status and Plans (con t)
Sparse Input Reanalysis for Climate Applications (SIRCA)
SIRCA 1850-2014
– Higher resolution (T126 ~100km or higher)
– improved methods (e.g., improved quality control, bias correction)
– More input data (e.g., ACRE)
– latest model from NCEP
– Include uncertainty in forcings (e.g., ensemble of SSTs and Sea Ice, CO2,
solar)
– Release Date Uncertain
Ocean Atmosphere Reanalysis for Climate Applications
OARCA 1800?-2017
– Higher resolution (T382 or higher)
– improved methods (e.g., include coupled Cryosphere-Ocean-Land-
Atmosphere-Chemistry system, link with SODA advances, possibly NOAA
CarbonTracker advances)
– More input data (e.g., ACRE-facilitated, maybe winds and T, storm position,
trace gases)
– latest model from NCEP, multi-model with other models (e.g., NASA, NCAR,
GFDL, ESRL)
– Release Date Uncertain 201. More land and marine observations back to early 19th century,
especially Southern Hemisphere and Arctic.
2. User requirements for, and applications of, reanalyses
3. Higher resolution, improved methods, possibly other surface variables
(e.g., wind, T, Tropical Cyclone position)
4. Uncertainty in forcings (e.g, CO2, solar, SST)
5. Possibly Multi-model (e.g., NASA, NCAR, NCEP, GFDL, ESRL)
Available 2014 – SIRCA (1850-2014)
Available 2017 – include coupling, OARCA (1800-2016)
Requires international cooperation, e.g.,
Atmospheric Circulation Reconstruction over the Earth initiative
http://www.met-acre.orgGlobal Ocean Sea Surface Temperature (60N-60S)
from Simple Ocean Data Assimilation SST ensemble (SODAv2.2.6)
compared to SST reconstructions (HadISST and NOAA ERSST) and
SODAv2.2.5 using only 20CR ensemble mean
SODAv2.2.5
SODAv2.2.5
is too warm
In these,
early in record
SODA
HadISST because
assimilates
20CR
only SST
ensemble-mean
data
ERSSTv3b wind-stress is
too weak.
SODAv2.2.6
ensemble
1866 1999
Surprisingly, SODAv2.2.6 ensemble corresponds better to NOAA ERSSTv3b
at times, despite 20CR having HadISST1.1 as boundary condition.Higher resolution example of Sparse Input Reanalyses for Climate Applications (SIRCA)
2008 NCEP GFS at ~50km resolution
September 1938 New England (movie)

               T254L64 (~50 km)

  Is the extraordinary upper-level trough correct?
2008 NCEP GFS at ~50km resolution
21 September 1938 00 UTC
Sea Level Pressure 500 hPa geopotential height
Is the extraordinary upper-level trough correct?Any Skill Forecasting the Track?
36 hour forecast verifying 21 Sept 1938 18Z
Ensemble Forecast
HURDAT Track
using 56 ensemble members T254L64 (about 0.5 degree)www.reanalyses.org Wiki for comparing Reanalyses with each other and with observations
Root Mean Square difference of
 Surface and Sea Level Pressure Observations and
 24 hour Forecasts from 20th Century Reanalysis (1871-2008)

                     persistence

                      20CRv2

Northern Hemisphere 24 hr forecasts beat persistence even in 1871.
Southern Hemisphere not better until after 1950.
Subdaily 500 hPa Geopotential Height anomalies
from observations and 20th Century Reanalysis
compare well.
1905-2006
Measurements
from kites,
aircraft,
registering
balloon, and
radiosondes
at Lindenberg,
Germany
Observations from CHUAN dataset (Stickler et al. 2010)Local Anomaly Correlation of Twentieth Century Reanalysis
and upper-air geopotential height observations from
radiosondes and other platforms
700 hPa 300 hPa
1908-1958
data from kites,
aircraft,
R=0.94 R=0.92
radiosondes
at Lindenberg,
Germany
N=15138 N=6749
Upper-air
observations
with at least
730 ascents
Courtesy
ETH Zurich
Agreement with Southern Hemisphere extratropics is good.Local Anomaly Correlation of Twentieth Century Reanalysis (20CR),
NCEP-NCAR Reanalysis (NNR), and ERA40
twice-daily geopotential height anomalies (1958)
700 hPa 300 hPa
20CR
vs. NNR 0.975
correlation
0.975 between
0.95
NNR and
20CR ERA40
0.85
vs. ERA40
0.65
Southern
0.45
Hemisphere
NNR 0.25 agreement
vs. ERA40 with ERA40
is poor.
Northern Hemisphere agreement is excellent.
Southern Hemisphere agreement is moderate to poor.
Is 20CR useful in Southern Hemisphere?Analyses for selected dates in 1894 and 1914
1894 Contours-
ensemble
mean
Shading-
blue: more
uncertain,
white: more
certain
1914
Blue dots:
Obs
locations
Sea Level Pressure 500 hPa Geopotential HeightDe
Storm
van
1894
(Zenit.
2010)
Henk
de
Bruin
and
Huug
van
den
Dool
Frank
Beyrich
and
BriBa
Bolzmann
(DWD)
provided
1894
weather
maps
of
the
Seewarte
Hamburg
725
                                                 725
              L                                    L

20CR                                  20CR

Aberdeen, 735                                   730
Scotland          L             MSLP mmHg                L
729 mmHg
observation
rejected by
QC

                      De Bruin and van den Dool (2010)
Upper-air anomaly data from
cruise of MS Schwabenland
compared to 20CR
(December 1938 to April 1939) Cruise locations (open circles)
500 hPa Height
Obs 700 hPa Temperature
20CR
Anomalies are with Grey regions shows
respect to NCEP-NCAR suspected erroneous data
Reanalyses
Brönnimann et al., Clim. Past (2011)Vertical difference profiles of 20CR and MS Schwabenland
geopotential height and temperature soundings
Geopotential Height Temperature
Average for
Average for
suspect
suspect
ascents after
ascents
assuming a
1500 m
altitude offset Average of
all other
ascents
20CR can be used to detect and correct errors in observationsChallenges to meeting
National and International goals for
Historical Reanalyses
• Satellite network only back to 1970 s,
Upper-air network comprehensive only back to 1940 s, scant to non-existent
in 19th century
• 3-D Var data assimilation systems such as used in NCEP-NCAR, NCEP-
DOE, ERA-40 reanalyses depends on upper-air data for high quality upper-
level fields (Bengtsson et al. 2004, Kanamitsu and Hwang 2005).
• However, studies using advanced data assimilation methods (e.g., 4D-Var,
Ensemble Filter) suggest surface network, especially surface pressure
observations, could be used to generate high-quality upper-air fields
(Bengtsson 1980, Thepaut and Simmons 2003, Thepaut 2006, Whitaker et
al. 2003, 2004, 2009, Anderson et al. 2005, Compo et al. 2006).
• Surface Pressure observations are consistent and reliable throughout 20th
Century and provide dynamical information about the full atmospheric
column.Ensemble Filter Algorithm
Whitaker and Hamill (2002)
first guess ensemble member ( )
single observation with error variance
First guess interpolated to observation location
Form analysis ensemble from
Κ Note the different gain
Σ Σ
Κ Σ
Σ
Analysis ensemble becomes first guess ensemble for next observation.
Conduct Observing System Experiments using only surface pressure
(e.g., Whitaker et al. 2009).500 hPA Height Analyses for 20 Feb 2005 12Z
Ensemble Filter! ECMWF Surface !
(~3800 surface! 4D-Var!
pressure obs)! (~3800 surface!
RMS = 31 m ! pressure obs)!
RMS = 31 m!
ECWMF Surface ! Full NCEP !
3D-Var! Operational!
(~3800 surface! (1,000,000+ obs)!
pressure obs)!
RMS = 142 m!
Surface pressure network
reduced to ~1930 s Whitaker, Compo, Thepaut (2009)!500 hPa Geopotential height first guess (line contours) and
analysis minus first guess (shaded)
for single pressure observation 1 hPa greater than first guess at
selected locations along 45N
Eastern Atlantic Central Asia
West Pacific North America
Ensemble Filter can extract spatially-varying structures relative to the flow
and the previous observational density.
In the 3D-Var used in NCEP-NCAR Reanalyses, all of these structures
would be identical and centered on the observation location.
Whitaker, Compo, Thepaut (2009)!Standardized monthly anomalies relative to 1961-1990
US Climate Division 20CRv2 Soil Moisture 0-200 cm
Palmer Drought Severity Index
-3 3 -3 3
Using only surface pressure, 20CR v2 appears to
capture expected features even in derived quantities.July 1936 North American Heat Wave
(1,000+ US & 1,000+ Canadian deaths during 14-day span)
500
mb
Height
m
500
mb
Height
500
mb
Height
80 100
*
0 * 0
Reanalysis
Reanalysis
-80 -150
Jul
4
11
18
25
Jul
4
11
18
25
Near-‐surface
Temperature
Near-‐surface
Temperature
K Near-‐surface
Temperature
312 Bismarck
Detroit
StaBon
304
StaBon
304 *
* 296
296
288
Jul
4
11
18
25
Jul
4
11
18
25
20th
Century
Reanalysis
version
2
Anomalies
July
8
–
14
with
respect
to
1891-‐2007
Current and future International Surface Pressure Databank
                     station component
                       (1670 to 2009)
  ftp://ftp.ncdc.noaa.gov/pub/data/ispd/add-station

                                                        43
                  Courtesy X. Yin and R. Allan
1871 to 2008 Zonal Means Zonal wind Air Temperature 50S EQ 50N 50S EQ 50N
20CR zonal mean difference with ERA40 and NNR (1979-2008)
                          ERA 40               NNR

              200

Zonal wind
                                                           CI:1 m/s
                                                           Biases
             1000                                          Over Poles
                    50S    EQ      50N   50S   EQ    50N
                                                           and
                                                           Stratosphere
              200
Air Temperature
                                                           CI:1 K

             1000

      20CR biases are low and sometimes of opposite sign
      in most of troposphere.                Compo et al. QJRMS (2011)
Sea Level Pressure analyses
for Tri-State Tornado Outbreak of 18 March 1925
(deadliest tornado in U.S. history)
NOTE!!! This analysis did not use ANY
of the observations shown on the left.Range of possibilities for Sea Level Pressure
18 March 1925 18Z using 14 (of 56) members
Ensemble of 56 possible realizations consistent with the observations
47Tropical Validation
• Force global Parallel Ocean Program (POP)
with daily 20th Century (1908-1956)
reanalysis fields
– 2m Air Temperature
– 2m Specific Humidity
– Downwelling Shortwave at Surface
– Total cloud cover
– 10 m Wind Speed
– Precipitation
– Zonal and Meridional Wind Stress
(Giese et al. BAMS 2009)
48Nino3.4 Time series from Kaplan SST,
POP Simulation, SODA Data Assimilation
Simulation using 20C reanalysis
+20th Century reanalysis forcing fields with no adjustment
generate realistic Nino3.4 variability in simulation
+Encouraging for Ocean and Coupled Data Assimilation. 49
(Giese et al. BAMS 2009)You can also read


