Regional, sectoral, and socioeconomic dimensions of energy consumption: The case of Germany - IEWT 2021
←
→
Page content transcription
If your browser does not render page correctly, please read the page content below
12. Internationale Energiewirtschaftstagung an der TU Wien IEWT 2021

 Regional, sectoral, and socioeconomic dimensions of energy
 consumption: The case of Germany
 Jan Priesmann1, Aaron Praktiknjo
 Chair for Energy System Economics (FCN-ESE),
 E.ON Energy Research Center, RWTH Aachen University,
 Mathieustr. 10, 52074 Aachen, +49 241 80 49897, jan.priesmann@eonerc.rwth-aachen.de

Abstract:
To successfully mitigate greenhouse gas emissions, energy procurement, consumption, and
distribution must be transformed. While procurement (comprising generation, imports, and
storage) and distribution of energy - in particular from renewable energy sources (RES) - are
the focus of debate and scientific analysis, the consumption side is often neglected. We
developed new methods for generating disaggregated energy consumption data for the
industrial and residential sectors. Using a combination of various methods from the fields of
optimization, multivariate linear regression, and machine learning we are able to learn and
reproduce the inherent patterns of energy consumption in micro data and further statistical
reports. We then use the generated database on regionally, sectorally, and socioeconomically
disaggregated energy consumption to analyze the diversity of energy consumers across
Germany. Especially with regard to the residential sector, the vast discrepancy in energy
poverty across Germany is striking. North-eastern Germany and the Ruhr area show high
shares of energy poverty according to the HCLI indicator of up to ~50% while in southern
Germany regions with only 7% of energy-poor households can be found.

Keywords: Energy transition, Energy consumption, Energy poverty, Optimization, Machine
learning

1 Introduction
To successfully mitigate greenhouse gas emissions, energy procurement, consumption, and
distribution must be transformed. While procurement (comprising generation, imports, and
storage) and distribution of energy - in particular from renewable energy sources (RES) - are
the focus of debate and scientific analysis, the consumption side is often neglected. The
reasons for this lie in the large number of heterogeneous consumers who exhibit different
decision-making behavior with regard to their energy consumption. Understanding the
consumption side of the energy system better could help to (1) design more efficient policies
that encourage energy consumers to take greater action within the scope of their capabilities,
(2) increase the acceptance of energy policy measures, and (3) assess the transformation of
energy procurement and distribution with lower uncertainties.

1 Jungautor

 Seite 1 von 13
12. Internationale Energiewirtschaftstagung an der TU Wien IEWT 2021 For this, the open-source JERICHO-E-usage dataset has been developed at FCN-ESE that provides comprehensive data on energy consumption patterns in high spatial and temporal resolution for the four energy sectors (Priesmann et al., 2021a). Building on this dataset, the intrasectoral resolution is further increased by dividing the industrial sector into subsectors and disaggregating the household sector based on socioeconomic criteria. Intrasectoral heterogeneity arrives from socioeconomic structures, economic structures, regional climate conditions, and availability of energy carriers, among others. The Corona pandemic shows how important specific regional, sectoral, and socioeconomic data is for designing appropriate incentives widely accepted and encouraging participation. Therefore, the goals are to (1) generate highly resolved regional and intrasectoral data on energy consumption, (2) identify drivers for regional, sectoral, and socioeconomic differences, and (3) evaluate the data in terms of: Energy consumption, energy expenses, and energy poverty. For this, data is combined from sources such as the Federal Statistical Office of Germany, the Socio-Economic Panel, the German Working Group on Energy Balances, and the Federal Employment Agency. The data sources are consolidated to ensure a high degree of validity in the resulting consumption data. For the industry sector, optimization methods are applied to minimize the deviation at a validation interface when generating regionalized data. Machine learning-based models are trained on micro census household data to understand the energy consumption behavior for the residential sector. The resulting data is then analyzed for regional, sectoral, and socioeconomic differences in energy efficiency, energy poverty, energy prices, and energy expenses. In addition, the factors influencing these indicators can be derived and used to develop recommendations for incentive systems. 2 Theoretical Background Andor et al. (2018) have demonstrated how discrepancies in the burden-sharing between the residential and the non-residential sectors for financing renewable energy influences the social acceptance of German households. In terms of socioeconomic factors, Priesmann et al. (2021b) have shown that lower-income households are most affected by electricity price increases including those caused by the introduction of RES support levies. They observe that higher-income households are less affected by price increases and that energy poverty is highly dependent on the electricity price and the underlying regulatory framework. The regional dimension of energy poverty has been analyzed by Besagni and Borgarello (2019) for the case of Italy or Sokołowski et al. (2020) for the case of Polen. For the case of Germany, regional analyses are scarce though can offer additional insights as shown by Drescher and Janzen (2021) who use a fixed-effects model accounting for differences across the federal states and additionally distinguish between rural and urban areas. In the following, the differences between residential and industrial energy consumers are discussed. Then, we refer to socioeconomic differences within the residential sector and further elaborate on energy poverty. Seite 2 von 13
12. Internationale Energiewirtschaftstagung an der TU Wien IEWT 2021

2.1 Distinction of residential and industrial energy consumers
End-users of electricity in Germany are categorized into two groups according to their type of
consumption metering (BNetzA and BKartA, 2014a). The first group comprises mainly
industrial and commercial enterprises whose electricity consumption is measured in 15-minute
intervals. In 2018, industrial and commercial end-users in Germany consumed 328 TWh of
electricity, a share of 73% of total final electricity consumption (AGEB, 2020). The second
group’s electricity consumption is up to today estimated based on standard load profiles and
consists primarily of private households and small businesses (though the compulsory
installation of smart metering in Germany since 2020 will enable individual load profiles in the
future). In 2018, private households accounted for 127 TWh or 25% of the total electricity
consumption (AGEB, 2020). Generally, a consumption below 10 MWh/a applies to private
households and small businesses, the range between 10 MWh/a and 2 GWh/a to commercial
and small industrial businesses, and values of over 2 GWh/a to industrial electricity use
(BNetzA and BKartA, 2014b).
Energy-intensive industries, as opposed to private households, do not always have to pay the
full price of electricity. In Germany, these industries include steel, aluminum, copper, paper,
chemical, and textile industries (Fraunhofer ISI and Ecofys, 2015a). The manufacturing
industry in particular benefits from reductions and exemptions of certain price components.
These benefits include general electricity tax reliefs, electricity tax capping, and exemptions of
certain manufacturing processes as well as the special equalization2 scheme of the EEG. Most
reductions and exemptions are justified with the reference to maintaining international
competitiveness (UBA, 2019). These privileges are linked to different criteria – such as
absolute electricity consumption, hours of the current collection, manufacturing processes,
share of electricity costs in revenue or gross value added, among others (Fraunhofer ISI and
Ecofys, 2015b). This causes a discrepancy between the share of total electricity consumed
and the share of total RES support levy revenues stemming from the residential and industry
sectors as shown in Figure 1.

2The special equilization scheme allows companies that are considered as energy-intensive
and that are participating in international competition to pay a reduced EEG levy.

 Seite 3 von 13
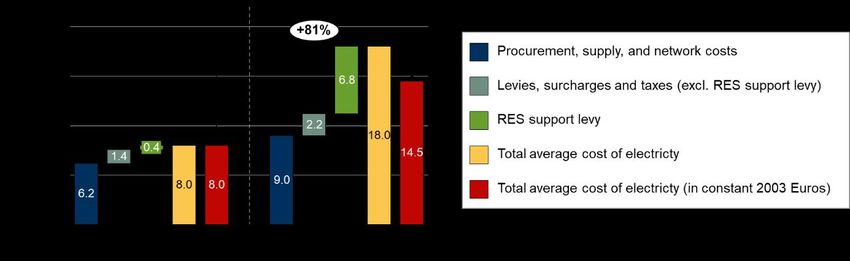
12. Internationale Energiewirtschaftstagung an der TU Wien IEWT 2021

Figure 1: Total electricity consumed and the share of total RES support levy revenues per sector for the year 2019
(BDEW, 2020).

The prevalence of privileged industrial companies is small: e.g., in 2015, only 4% of all
industrial companies benefitted from a reduced or waived RES support levy (BDEW, 2015).
Looking at the regional distribution, differences can be observed due to the regional variation
of energy-intensive industry subsectors. Nonetheless, the companies that do benefit from a
reduction in or exemption of the RES support levy consumed roughly half of the total industrial
electricity. The current relief volume of all taxes, levies, and surcharges is €16 bn per year, to
which the privileges concerning the RES support levy contribute the most with €7.1 bn (UBA,
2019). This leads to private households and commerce currently bearing some 56% of the
costs for the RES support and industry only 25% (BDEW, 2020). The rest is allocated to the
public, agriculture, and transport sectors.

2.2 The electricity price development for industrial and residential end-users

Industrial electricity customers in Germany were confronted with an immense increase in
electricity prices (see Figure 2). The absolute changes are illustrated by reference to
companies with yearly electricity consumption of 160 to 2,000 MWh. The cost development
between 2003 and 2018 is compared by adjusting the cost terms for inflation using the
consumer price index (CPI) with the base year 20033. The average cost of electricity per kWh
for the shown consumption band increased by 9.98 €-ct/kWh from 2003 to 2018 or ~125% in
normal prices. When accounting for inflation, the average costs increased by 6..48 €-ct/kWh
or ~81%. The increase in RES support levy accounts for the majority of the increase in
industrial electricity prices – though companies can benefit from a reduction or exemptions of
the RES support levy.

3 See Destatis (2020) for CPI values.

 Seite 4 von 13
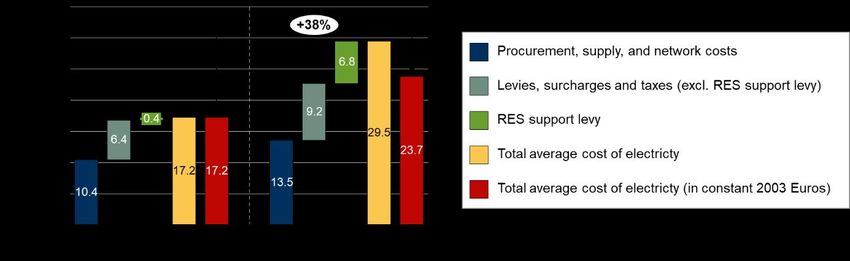
12. Internationale Energiewirtschaftstagung an der TU Wien IEWT 2021

Figure 2: Development of the industrial average cost of electricity per kWh, by component, for the annual
consumption of 160 to 2,000 MWh (BDEW, 2019; Destatis, 2020).

Residential electricity customers also witnessed a rapid increase in electricity prices in
Germany in the period from 2003 to 2018. The absolute changes in residential electricity prices
are illustrated by reference to the medium consumption band DC. Figure 3 shows that the
average cost of electricity per kWh for the residential sector increased by 12.28 €-ct/kWh from
2003 to 2018, which results in a relative change of ~71%. The grey columns in Figure 3 depict
the average cost of electricity per kWh in constant 2003 Euros. When accounting for inflation,
average cost increased by 6.53 €-ct/kWh (in 2003 Euros). Thus, the relative cost increase from
2003 to 2018 merely amounted to ~38%.

Figure 3: Development of the private household average cost of electricity per kWh, by component, for the annual
consumption of 3500 kWh (BDEW, 2019; Destatis, 2020).

Market-based cost components, including procurement and supply, accounted for merely
~21% of the average cost of electricity for residential consumers in 2018. The main drivers for
the cost increases are taxes, levies, and surcharges. This cost component rose from 6.81 €-
ct/kWh in 2003 to 15.98 €-ct/kWh in 2018, which results in a relative increase of ~135%. The
main reason for the surge in taxes, levies, and surcharges is the RES support through the EEG
levy, which during this time period rose by ~1617%. The second-largest government-imposed
cost component is the value-added tax (VAT), followed by the electricity consumption tax, the
latter of which was introduced in 1999 to incentivize more energy-efficient electricity
consumption and, therefore, indirectly reduce CO2 emissions (Bundestag, 1999). Another
considerable share relates to the concession levy, which refers to payments flowing from
distribution network operators to municipalities for the right of way to install new power lines
(Agora Energiewende, 2017).

 Seite 5 von 13
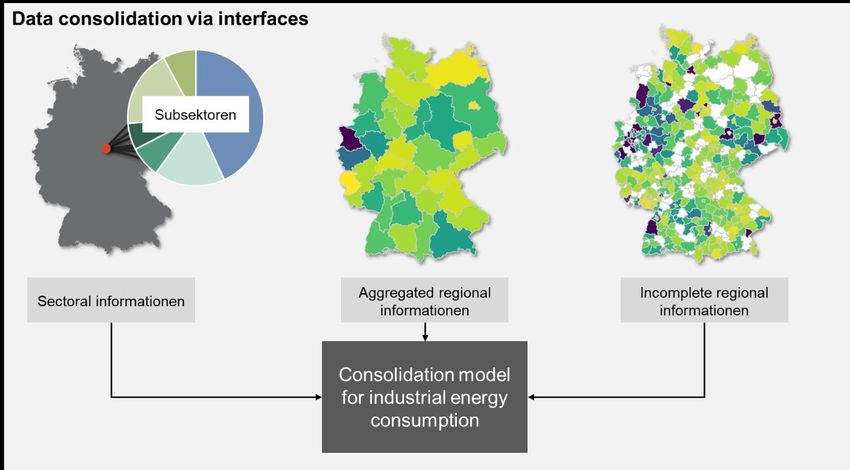
12. Internationale Energiewirtschaftstagung an der TU Wien IEWT 2021 2.3 Energy poverty with a focus on Europe and Germany Whether a household is considered energy poor can be analyzed using energy poverty thresholds. This threshold, also referred to as energy poverty line, can be calculated using various approaches such as the 10% poverty line, the two times median share poverty line, or the high-cost/low-income poverty line (Heindl, 2014). Based on the distinction between energy- poor and non-poor households, indicators for the degree of energy poverty within a society can be derived, such as the FGT index (Foster et al., 1984). 3 Methodology In the following, the developed and applied methodology for generating regionally, sectorally, and socioeconomically resolved data on electricity consumption, electricity expenditures, and electricity poverty are described. 3.1 Disaggregating industrial energy consumption For the industrial sector, the goal is to generate data on energy consumption per energy carrier and industry subsector. The chosen resolution is the NUTS3-level which comprises 401 regions for the German case. The model structure is shown in Figure 4. Figure 4: Structure of the consolidation model for generating data on industrial energy consumption. We selected a consolidation approach that uses a multitude of different reported statistical datasets. By defining interfaces on different aggregation levels (regionally and sectorally), the information contained in every reported dataset can be used to improve the quality of the constructed dataset. The reported datasets for the year 2018 comprise the following: Destatis (2021a): Data on company sites and employees per NUTS0, NUTS1, and NUTS3 region Destatis (2021b): Data on company sites per industry subsector Seite 6 von 13
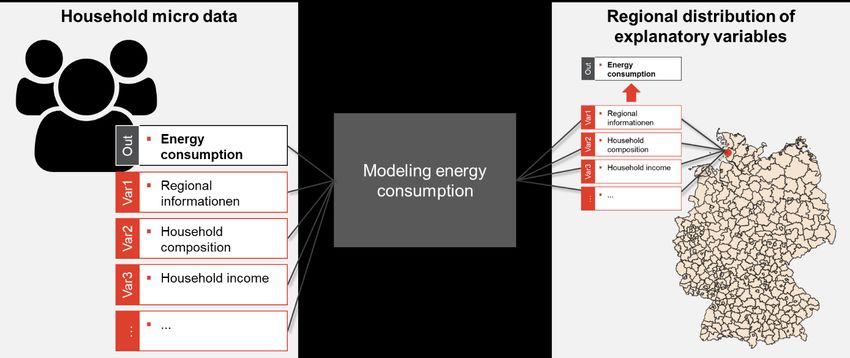
12. Internationale Energiewirtschaftstagung an der TU Wien IEWT 2021 Bundesagentur für Arbeit (2019): Data on employees per NUTS3 region and industry subsector Destatis (2021c): Data on energy consumption per NUTS0, NUTS1, and NUTS3 region Destatis (2021d): Data on energy consumption per industry subsector Eurostat (2021): Data on heating days per NUTS3 region After collecting and preprocessing the data, an optimization model is formulated. The objective is to minimize the deviations at the NUTS3 level per industry subsector and energy carrier: ∑ ∑ ∑ ∆+ − 3, , + ∆ 3, , (1) ∆+ − 3, , , ∆ 3, , 3 This deviation stems from a regression-like constraint as shown in Eq. (4). Further, Eq. (2) shows an exemplary constraint for an interface that is based on secured data while Eq. (3) shows an exemplary constraint for an interface where the reported consumption data is expected to underestimate real energy consumption. This validation is performed by aggregating reported data (per region or per sector) in a validation step and checking whether the aggregated sums meet the reported total consumption. + ∑ ∑ 3, , = (1 + 0, − − 0, ̅̅̅̅̅̅̅̅ ) ∗ 0, ∀ ∈ (2) 3 ∑ 3, , ≥ (1 − ) ∗ ̅̅̅̅̅̅̅̅ 3, ∀ 3 ∈ 3; ∀ ∈ (3) ̅̅̅̅̅̅̅̅ , 3, , = , ∗ ̅̅̅̅̅̅̅̅ 3, + , ∗ 3, + , ∗ ̅̅̅̅̅̅̅̅ 3, / ̅̅̅̅ 3 + ∆+ ̅̅̅̅̅̅̅̅ 3, + ℎ ∗ 3, , (4) − ∆− 3, , ∀ 3 ∈ 3; ∀ ∈ ; ∀ ∈ 3.2 Disaggregating residential energy consumption and expenditures For the residential sector, the goal is to data on electricity consumption and expenditures as well as socioeconomic indicators. The chosen regional resolution is again the NUTS3-level. The methodological approach is depicted in Figure 5. Seite 7 von 13
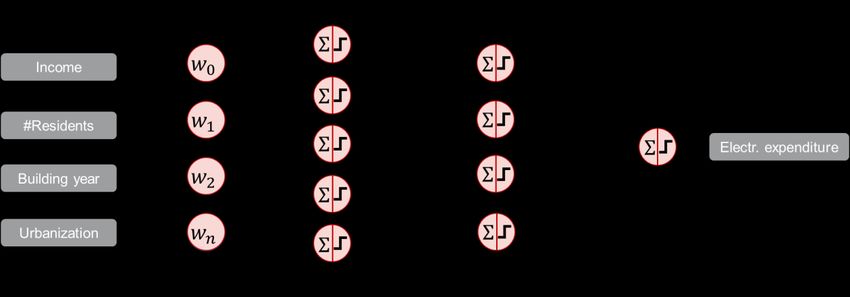
12. Internationale Energiewirtschaftstagung an der TU Wien IEWT 2021

Figure 5: Model structure for generating regionally and socioeconomically resolved energy consumption data for
the residential sector.

In a first step and using the income and consumption sample (ICS) of Germany (RDC of the
Federal Statistical Office and the statistical offices of the Länder, 2018), a multivariate linear
regression model is set up to map household incomes to various descriptive variables. In a
second step, this regression model is used to disaggregate census data (Statistische Ämter
des Bundes und der Länder, 2011) into individual households (resulting in ~37 mil. table rows).
For this, again an optimization approach is applied. The objective of this optimization model is
to minimize the deviation from the relations depicted by the regression model while meeting
(1) the distribution of socioeconomic, (2) dwelling information provided by the census, and (3)
reported household income information per NUTS3 region (Destatis, 2021e).
Finally, a machine learning-based model is constructed based on the ICS dataset mapping
various socioeconomic and dwelling information on electricity expenditure (see Figure 6).

Figure 6: Illustration of the feed-forward neural network model for mapping socioeconomic and dwelling information
on electricity expenditure.

The feed-forward neural network model was compared against a multivariate linear regression
model and showed higher accuracy in terms of R2 (~0.74 compared to ~0.41). The model is
then used to estimate the electricity expenditure per household in Germany. Residential
energy consumption is calculated using base and operating prices for the year 2018 that is
provided by (Priesmann et al., 2021b).

 Seite 8 von 13
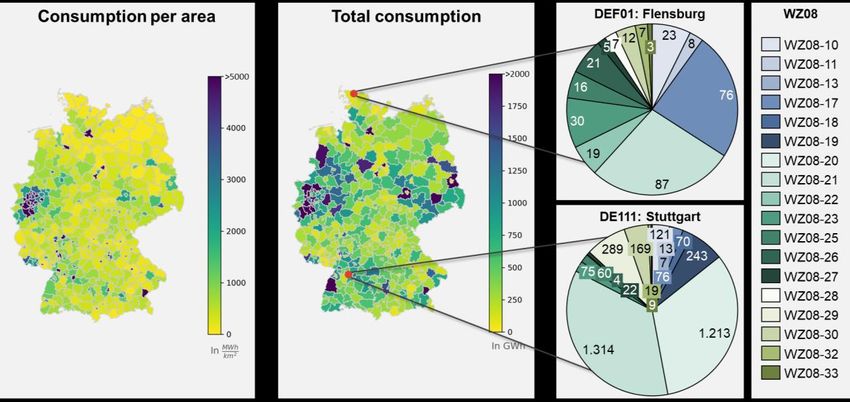
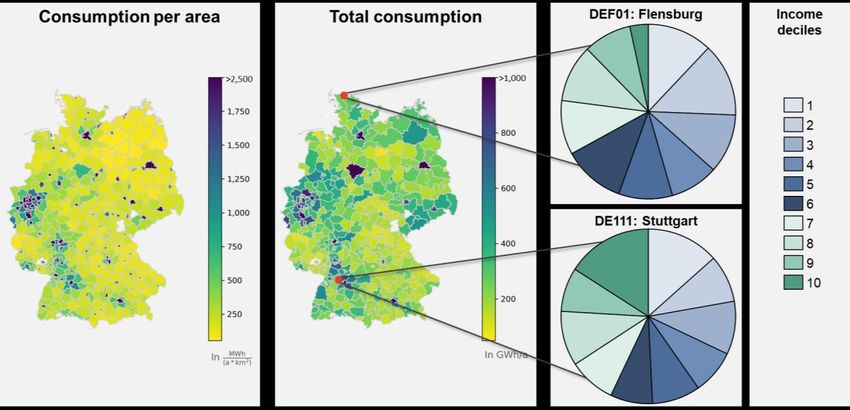
12. Internationale Energiewirtschaftstagung an der TU Wien IEWT 2021

3.3 Calculating energy poverty indicators
We further investigate the impact of the current allocation mechanism and of our reform
proposal on a modified form of energy poverty, which we call electricity poverty, using the two
times median share poverty line and the high cost / low income (HCLI) poverty line, as
suggested by Heindl (2014). The two times median share poverty line considers those
households as electricity-poor whose electricity expenditure shares on income accounts for
more than twice the median value. In comparison, the HCLI poverty line considers those
households as electricity poor whose electricity expenditure shares are higher than the median
value while, at the same time, having an income below 60% of the median. We use equivalized
incomes and expenditures according to the OECD equivalence scale for our analysis. We then
derive measures for electricity poverty using the FGT index from Foster et al. (1984).
 1 −
 = ∑ =1 ( ) , where N is the number of households, q the number of households below

the poverty line, the expenditure or expenditure shares for energy services (in this case only
electricity), and z the poverty line. We use values of = 0 (headcount ratio), = 1 (poverty
gap index), and = 2 (squared poverty gap, measuring poverty intensity).

4 Results and Discussion
In the following, the resulting data on disaggregated consumption, expenditures, and energy
poverty indicators are presented and discussed.

4.1 Energy consumption for the industrial and residential sectors
Figure 7 shows the results for the disaggregated energy consumption of the industry sector
(here with electricity as one of seven available energy carriers). Large differences in the
regional and sectoral distribution of electricity consumption can be observed.

Figure 7: Regional and sectoral distribution of final energy consumption (electricity) for the industrial sector in 2018.

Figure 8 shows the results for the disaggregated electricity consumption of the residential
sector. As households are modeled individually, further insights on socioeconomic differences
within regions can be generated. As shown, the share of electricity consumption per income

 Seite 9 von 13
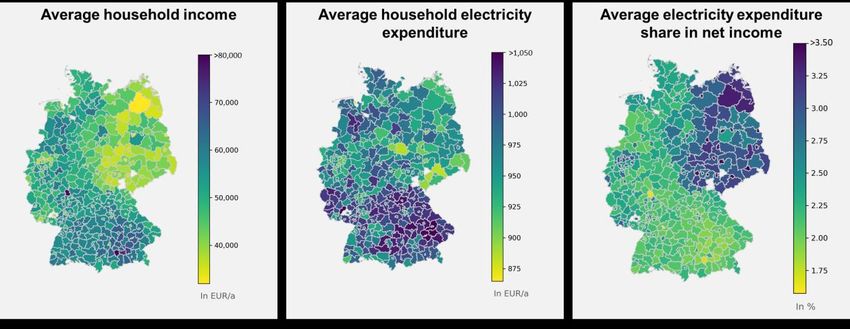
12. Internationale Energiewirtschaftstagung an der TU Wien IEWT 2021

decile among total consumption differs across Germany4. Blank regions are due to numerical
issues when disaggregating households based on the census dataset.

Figure 8: Regional and socioeconomic distribution of final energy consumption (electricity) for the residential sector
in 2018.

4.2 Comparing electricity expenditures in the residential sector
Figure 9 shows the resulting electricity expenditure per household and the electricity
expenditure share in net income. Electricity expenditure is highest in southern Germany.
However, due to high household incomes, the electricity expenditure shares in net income are
among the lowest. In contrast to this, households in north-eastern Germany have the lowest
electricity expenditure but due to low household incomes, the share of this income spent on
electricity is highest across Germany.

4 Income decile 1 comprises the 10% of households with the lowest yearly net income per
household resident while the 10% of households with the highest incomes are allocated to
income decile 10.

 Seite 10 von 13
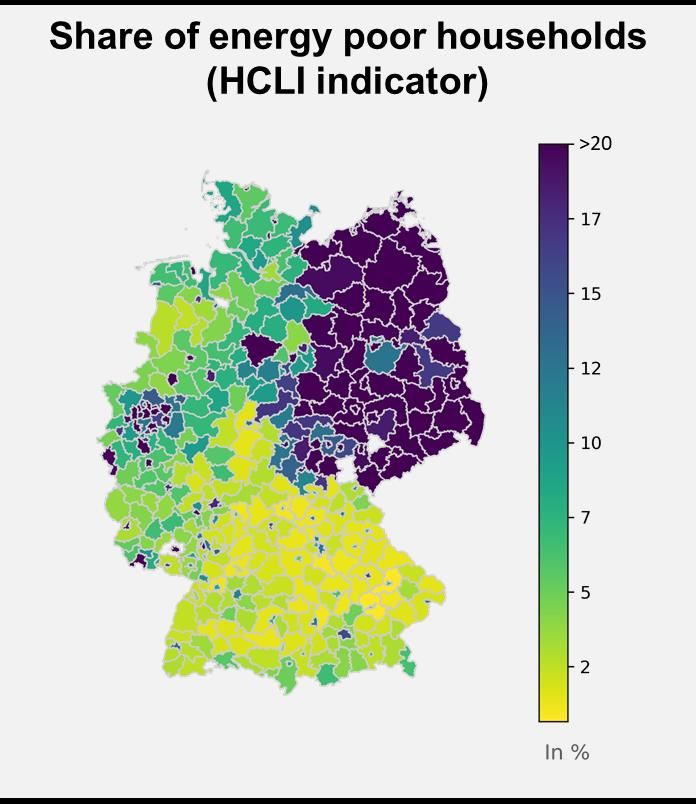
12. Internationale Energiewirtschaftstagung an der TU Wien IEWT 2021

Figure 9: Average household incomes, electricity expenditure, and electricity expenditure share in net income.

4.3 Comparing energy poverty indicators
Figure 10 shows the share of energy (in this case electricity) poor households using the HCLI
indicator. What is striking is that the north-eastern regions show by far the highest shares of
electricity poor households with regions having up to ~50% of households defined as electricity
poor (see Figure 9). Also worth mentioning are scattered regions in the Ruhr area, which also
shows high shares of electricity poor households.

Figure 10: Share of energy (in this case electricity) poor household based on the HCLI indicator.

5 Conclusion
We have developed new methods for generating disaggregated energy consumption data for
the industrial and residential sectors. Using a combination of various methods from the fields
of optimization, multivariate linear regression, and machine learning proved to be capable of
learning and reproducing the inherent patterns of energy consumption in micro data and further
statistical reports.

 Seite 11 von 13
12. Internationale Energiewirtschaftstagung an der TU Wien IEWT 2021

Using the generated new database on regionally, sectorally, and socioeconomically
disaggregated energy consumption data, we can now better capture the diversity of energy
consumers across Germany. Especially with regard to the residential sector, the vast
discrepancy in energy poverty across Germany is striking. North-eastern Germany and the
Ruhr area show high shares of energy poverty according to the HCLI indicator of up to ~50%
while in southern Germany regions with only 7% of energy-poor households can be found.
The generated data basis and the conducted analyses can be used to derive recommendations
on how to change the regulatory framework in order to reduce energy poverty and increase
acceptance for a transition towards more sustainable energy systems.

References
AGEB, 2020. Zusammenfassung - Anwendungsbilanzen für die Endenergiesektoren 2008 bis
 2018 (Summary - application balances for the final energy sectors 2008 to 2018). AG
 Energiebilanzen e.V.
Agora Energiewende, 2017. Neue Preismodelle für Energie - Grundlagen einer Reform der
 Entgelte, Steuern, Abgaben und Umlagen auf Strom und fossile Energieträger (New
 price models for energy - Basis for a reform of fees, taxes, charges and levies on
 electricity and fossil fuels).
Andor, M.A., Frondel, M., Sommer, S., 2018. Equity and the willingness to pay for green
 electricity in Germany. Nat Energy 3, 876–881. https://doi.org/10.1038/s41560-018-
 0233-x
BDEW, 2020. Strompreisanalyse Januar 2020 Haushalte und Industrie (Electricity price
 analysis January 2020 households and industry). Bundesverband der Energie- und
 Wasserwirtschaft e.V.
BDEW, 2019. Strompreisanalyse Januar 2019 Haushalte und Industrie (Electricity price
 analysis January 2019 households and industry). Bundesverband der Energie- und
 Wasserwirtschaft e.V.
BDEW, 2015. Energieinfo Industriestrompreise - Ausnahmeregelungen bei
 Energiepreisbestandteilen (Energie info Industrial electricity prices - Exceptions for
 energy price components). Bundesverband der Energie- und Wasserwirtschaft e.V.
Besagni, G., Borgarello, M., 2019. The socio-demographic and geographical dimensions of
 fuel poverty in Italy. Energy Research & Social Science 49, 192–203.
 https://doi.org/10.1016/j.erss.2018.11.007
BNetzA, BKartA, 2014a. Monitoringbericht 2013 (Monitoring Report 2013).
 Bundesnetzagentur, Bundeskartellamt.
BNetzA, BKartA, 2014b. Monitoringbericht 2014 (Monitoring Report 2014).
 Bundesnetzagentur, Bundeskartellamt.
Bundesagentur für Arbeit, 2019. Regionalreporte über Beschäftigte (Quartalszahlen).
Bundestag, 1999. Stromsteuergesetz (StromStG) (Electricity Taxation Act), version of 24th
 March 1991 (BGBl. I S. 378; 2000 I S. 147) last amended by Art. 1 of the Act of 22 June
 2019 (BGBl. I S. 856, 908).
Destatis, 2021a. Betriebe, Beschäftigte, Bruttoentgelte. 42111.
Destatis, 2021b. Beschäftigte und Umsatz der Betriebe im Verarbeitenden Gewerbe:
 Deutschland, Jahre, Wirtschaftszweige. 42111.
Destatis, 2021c. Energieverbrauch im Bergbau und Verarbetendem Gewewerbe. 43531.
Destatis, 2021d. Energieverbrauch der Betriebe im Verarbeitenden Gewerbe: Deutschland,
 Jahre, Nutzung des Energieverbrauchs, Wirtschaftszweige, Energieträger. 43531.
Destatis, 2021e. Verfügbares Einkommen der privaten Haushalte einschließlich privater
 Organisationen ohne Erwerbszweck. 82411.
Destatis, 2020. Verbraucherpreisindizes für Deutschland (Consumer price indices for
 Germany). Statistisches Bundesamt.

 Seite 12 von 13
12. Internationale Energiewirtschaftstagung an der TU Wien IEWT 2021

Drescher, K., Janzen, B., 2021. Determinants, persistence, and dynamics of energy poverty:
 An empirical assessment using German household survey data. Energy Economics
 102, 105433. https://doi.org/10.1016/j.eneco.2021.105433
Eurostat, 2021. Heating and cooling degree days - statistics.
Foster, J., Greer, J., Thorbecke, E., 1984. A Class of Decomposable Poverty Measures.
 Econometrica 52, 761–766. https://doi.org/10.2307/1913475
Fraunhofer ISI, Ecofys, 2015a. Stromkosten der energieintensiven Industrie - Ein
 internationaler Vergleich – Zusammenfassung der Ergebnisse (Electricity costs of the
 energy-intensive industry - An international comparison - Summary of the results).
 Karlsruhe, Germany.
Fraunhofer ISI, Ecofys, 2015b. Politisch induzierte Strompreiskomponenten und
 Ausnahmeregelungen für die Industrie (Politically induced electricity price components
 and exemptions for industry). Karlsruhe, Germany.
Heindl, P., 2014. Measuring fuel poverty: General considerations and application to German
 household data. SOEPpapers on Multidisciplinary Panel Data Research.
Priesmann, J., Nolting, L., Kockel, C., Praktiknjo, A., 2021a. Time series of useful energy
 consumption patterns for energy system modeling. Scientific Data 8, 148.
 https://doi.org/10.1038/s41597-021-00907-w
Priesmann, J., Spiegelburg, S., Madlener, R., Praktiknjo, A., 2021b. Energy transition and
 social justice: Do renewable energy levies have an impact on income distribution and
 energy poverty? PREPRINT. https://doi.org/10.21203/rs.3.rs-754301/v1
RDC of the Federal Statistical Office and the statistical offices of the Länder, 2018.
 Einkommens- und Verbrauchsstichprobe 2018 - Grundfile 3 (AAGSHB), SUF, Version
 1. https://doi.org/10.21242/63211.2018.00.04.3.1.1
Sokołowski, J., Lewandowski, P., Kiełczewska, A., Bouzarovski, S., 2020. A multidimensional
 index to measure energy poverty: the Polish case. Energy Sources, Part B: Economics,
 Planning, and Policy 15, 92–112. https://doi.org/10.1080/15567249.2020.1742817
Statistische Ämter des Bundes und der Länder, 2011. Zensus 2011.
UBA, 2019. Reform und Harmonisierung der unternehmensbezogenen Ausnahmeregelungen
 im Energiebereich (Reform and harmonization of business-related exemptions in the
 energy sector). Umweltbundesamt, Dessau-Roßlau, Germany.

 Seite 13 von 13
You can also read


