Electricity demand reduction in Sydney and Darwin with local climate mitigation
←
→
Page content transcription
If your browser does not render page correctly, please read the page content below
P. Rajagopalan and M.M Andamon (eds.), Engaging Architectural Science: Meeting the Challenges of Higher Density: 52nd         285
International Conference of the Architectural Science Association 2018, pp.285–293. ©2018, The Architectural Science
Association and RMIT University, Australia.

Electricity demand reduction in Sydney and Darwin
with local climate mitigation
Riccardo Paolini
UNSW Built Environment, UNSW Sydney, Australia
r.paolini@unsw.edu.au

Shamila Haddad
UNSW Built Environment, UNSW Sydney, Australia
s.haddad@unsw.edu.au

Afroditi Synnefa
UNSW Built Environment, UNSW Sydney, Australia
asynnefa@phys.uoa.gr

Samira Garshasbi
UNSW Built Environment, UNSW Sydney, Australia
s.garshasbi@unsw.edu.au

Mattheos Santamouris
UNSW Built Environment, UNSW Sydney, Australia
m.santamouris@unsw.edu.au

Abstract: Urban overheating in synergy with global climate change will be enhanced by the increasing population density
and increased land use in Australian Capital Cities, boosting the total and peak electricity demand. Here we assess the
relation between ambient conditions and electricity demand in Sydney and Darwin and the impact of local climate mitigation
strategies including greenery, cool materials, water and their combined use at precinct scale. By means of a genetic
algorithm, we produced two site-specific surrogate models, for New South Wales and Darwin CBD, to compute the
electricity demand as a function of air temperature, humidity and incoming solar radiation. For Western Sydney, the total
electricity savings computed under the different mitigation scenarios range between 0.52 and 0.91 TWh for the summer of
2016/2017, namely 4.5 % of the total, with the most relevant saving concerning the peak demand, equal to 9 % with cool
materials and water sprinkling. In Darwin, the computed peak electricity demand is of 2 % with respect to the unmitigated
condition. Greater savings could be achieved acting on the demand linked to hot and humid conditions.

Keywords: Urban Heat Island; Cooling; Energy; Building.

1.   INTRODUCTION
Global climate change is expected to increase the annual average air temperatures from 1.8 K to 4 K between 1990 and
2100 (IPCC, 2014). Considering only the variation in heating and cooling degree days related to climate change, an increase
in per capita electricity demand of 6 % and 11 % during summer and spring, respectively, is predicted by 2100 for New
South Wales (Balogun, Morakinyo and Adegun, 2014). However, global climate change will march in hand with an increase
in global population and an increased market penetration of air conditioning, with the latter due to an increase in available
income and increased frequency of hot spells (Santamouris, 2016). In addition, a local increase in ambient temperature is
due to the urban heat island effect (Santamouris, 2015), for which a crescendo is also expected in some areas, given the
growing urban population. All these aspects together will boost the electricity consumption and the need of additional power
stations. The increase in the frequency and intensity of heatwaves connected to global climate change is also expected
to mirror in boosted frequency and intensity of peak electricity demand. An “additional peak capacity costs of up to 180
billion dollars by the end of the century under business-as-usual” is estimated in the USA, with an all year average increase
of 2.8 % in consumption (Auffhammer et al. 2017). Data from Canada, Israel, Japan, Thailand, and the United States
show an increase in peak electricity demand by 0.45-4.6 % / °C, with an electricity penalty of 21 (± 10.4) W per degree of
temperature increase and per person (Santamouris et al., 2015). Considering the local impacts, the urban heat island effect
contributes to an additional increase between 0.5 % and 8.5 % / °C. Usually, the threshold temperature above which the
electricity demand increases ranges between 18 °C and 24 °C; and it equals 18 °C in the majority of cases (Santamouris,
2014). In tropical climates, the largest fractions of domestic electricity demand are for air conditioning and refrigeration, thus
directly related to the ambient temperature. The benefit of local climate mitigation in terms of electricity demand reduction
has not been investigated for Australian cities.
286      R. Paolini, S. Haddad, A. Synnefa, S. Garshasbi and M. Santamouris

    Here, we assess the relation between ambient conditions and electricity demand and we assess the impact of local
climate mitigation strategies in the Darwin CBD area and in Western Sydney. These include greenery, cool roofs and cool
pavements, water sprinklers, water and greenery, or and water and cool roofs and pavements.

2.    METHODS

2.1 Areas of interest

The areas considered here considered are the CBD of Darwin, NT (~ 1 km2) and an area of Sydney, NSW (~ 4,500 km2)
with approximately 4.2 million residents, where we modelled in total eight precincts in the Local Government Areas of
Bankstown, Campbelltown, Canterbury, Holsworthy, Horsley Park, Olympic Park, Penrith and Richmond. We simulated the
unmitigated and mitigated microclimates with the 3D model ENVI-metV4.1.3 (Haddad et al., 2018), considering site specific
approaches (Table 1).

                                                    Table 1: Mitigation scenarios.

 Scenario                               Darwin                                        Sydney
 Unmitigated (reference)                Albedo: walls, roofs and concrete pavements   Albedo: walls, roofs and concrete pavements
                                        = 0.2; asphalt pavements = 0.05; soil=0.15.   = 0.2; asphalt pavements = 0.05; loamy
                                        Greenery < 10% of unbuilt area.               soil=0.15. Grass used as greenery.
 Greenery                               Increase of grass and trees cover to 30% of   Plantation of 192 mature trees per precinct
                                        pavements and open spaces
 Cool materials (roofs and pavements)   Global Albedo=0.6, greenery less than 10%     Increased global albedo=0.5 by applying
                                        of non-building area                          cool roofs and pavements
 Water                                  NA                                            16 water fountains/precinct
 Greenery and water                     NA                                            Combination of the two scenarios
 Cool materials and water               NA                                            Combination of the two scenarios
                                        Albedo = 0.6, Greenery 30%, and Shading       NA
 Combined
                                        (30 % irradiance reduction)

2.2 Electricity data

We received the semi-hourly electricity demand data from Power and Water Corporation for the Darwin CBD area (Darwin
City) and the Frances Bay area. We focused on the period from February 2016 until December 2017 because of a variation
in the metering system, a very sharp population increase in recent years in Darwin, and as the area is very small, the
visitors may be a relevant fraction compared to the resident population. For Sydney, we obtained the semi-hourly electricity
demand data for the whole NSW from the Australian Energy Market Operator (Australian Energy Market Operator, 2017),
considering the summer periods (Dec-Feb) from 2013 to 2017. To determine the relation between environmental conditions
and electricity demand, we used the genetic programming software tool Eureqa. Its engine was originally developed by
Schmidt and Lipson (2009) and uses artificial intelligence to search a correlation that minimizes the error function given by
the discrepancy between the data and the generated model. We used 75 % of the dataset for development and 25 % for
validation.

2.3 Weather data

In Sydney, we considered the semi-hourly weather data for the unmitigated scenario given by nine weather stations (Table
2) managed by the Bureau of Meteorology (Australian Bureau of Meteorology, 2017a). Lacking long term records of global
horizontal solar radiation free of gaps, we considered the extraterrestrial global horizontal radiation from satellite measurements
(University of Colorado and NASA, 2017) and we computed the solar position with an high-accuracy algorithm (Reda and
Andreas, 2004). The simulated environmental conditions in the precincts showed a very good agreement with the BoM
stations, that were directly used. We considered then a population weighted average temperature, with statistical data on
population (Geoscience Australia, 2016).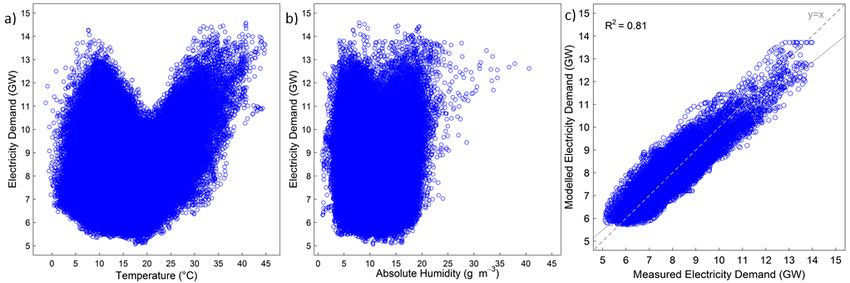
Electricity demand reduction in Sydney and Darwin with local climate mitigation 287
Table 2: Weather stations providing the data used in the study. For the stations of the Bureau of Meteorology (BoM) the station code is
provided.
BoM Station code Station name Lat Long Location
14015 Darwin -12.411 130.878 Darwin, NT
66137 Bankstown -33.918 150.986 Western Sydney, 20-30 km from the
68257 Campbelltown -34.062 150.774 coast
66194 Canterbury -33.906 151.113
66161 Holsworthy -33.993 150.949
67119 Horsley Park -33.851 150.857
66212 Olympic Park -33.834 151.072
66062 Observatory Hill -33.859 151.202 Coastal, NSW
67113 Penrith -33.720 150.678 NSW, 50 km from the coast
67105 Richmond -33.600 150.776
NA Macquarie (radiation) -33.765 151.115 Inner West Sydney, NSW
In Darwin, we considered the dry bulb and dew point temperatures, and the solar radiation measured at the airport
(Australian Bureau of Meteorology, 2017b) and we installed in the CBD a network of 15 stations that provided semi-hourly
temperature data for approximately two months (11/09/2017 - 31/10/2017). Then we found a relation between the urban
and airport temperatures and re-created a long-term data series for the CBD. The weather profiles in the mitigated condition
were computed considering the ratio of the air temperature in the mitigated scenario in each precinct to the ambient
temperature in the unmitigated scenario. In detail, we multiplied the semi-hourly ambient air temperature from the weather
station times the mitigation ratio. In Sydney, for Observatory Hill and Northern Beaches areas we considered the same
mitigation coefficients derived for Canterbury.
3. RESULTS
3.1 Electricity demand model
3.1.1 Darwin electricity demand model
We found a correlation between urban temperatures (Turb) and airport conditions as a function of airport air temperature
(T), global horizontal irradiance (GHI), and wind speed (U).
Turb = 10.21 + 0.675*sma(T, 3) + 0.002*GHI + 0.055*T*sma(U, 7) - 1.729*sma(U, 7) –
+ 1.832e-6*GHI2 (1)
Where sma (x, n) is the simple moving average of the previous n records of the quantity x. The developed correlation
shows an R-squared correlation coefficient of 0.93, a median absolute error of 0.3 °C and for 99% of the values the error
is less than 2 °C (Figure 1). There are some outliers due to the different time at which the urban area and the airport (~
6 km from the city) are reached by thunderstorms that induce a sudden temperature drop. The surrogate model can
reproduce the trend and the peaks in the urban temperature profile, at times with a time shift of 30-60 minutes (Figure 1),
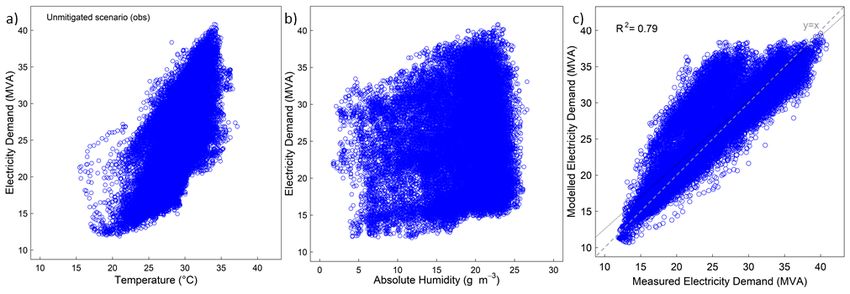
with most of the discrepancies occurring during the night. Similarly, we found a parametrisation of the semi-hourly electricity
demand (ELDem) expressed in MVA (Mega Volta Ampere) as a function of the temperature at the airport (T), the dew point
temperature (Td), the global horizontal irradiance (GHI).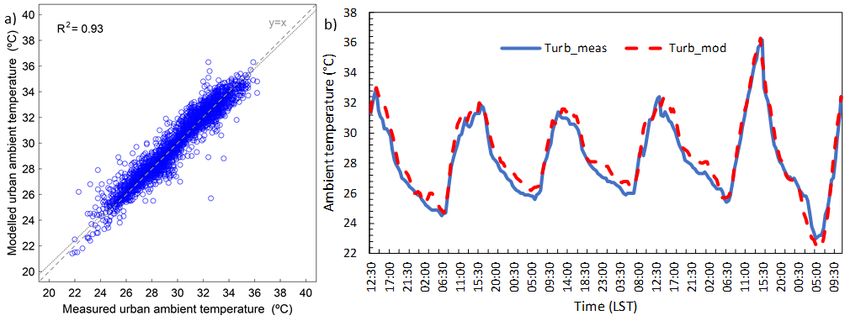
288    R. Paolini, S. Haddad, A. Synnefa, S. Garshasbi and M. Santamouris

 Figure 1: Modelled vs. observed average urban ambient temperature in the CBD of Darwin (a), and five days of semi-hourly modelled
                                  and observed average urban ambient temperature in Darwin (b).

                                      ELDem = 3.024 + 0.897*sma(T, 54) + 0.0003*Td*sma(GHI, 3) - 1108/(107.058 +
   + 0.3116*delay(GHI, 285) + 0.0326*GHI*delay(GHI, 285) + sma(GHI, 12)						                                 (2)

    Where sma (x, n) is the simple moving average of the previous n records of the quantity x. Delay (x, n) indicates a delayed
variable, namely for time step t, it considers its value n time steps before. Humidity has a nonlinear impact on demand,
affecting the performance of the parametrisation in the intermediate temperature range, while the demand is monotonic
with temperature (Figure 2).

  Figure 2: Observed electricity demand vs. the urban ambient temperature (a); vs. absolute humidity (b); and modelled vs. observed
                                                electricity demand for Darwin CBD (c).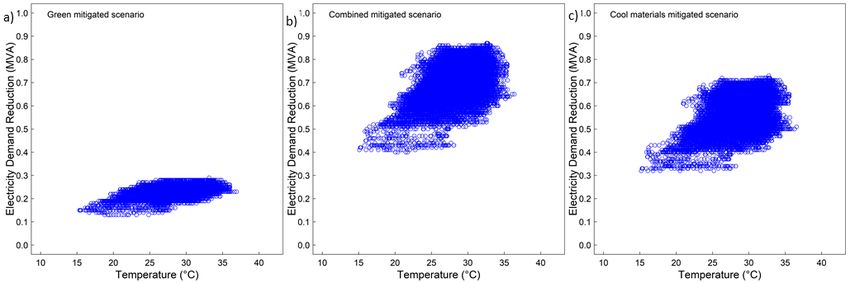
Electricity demand reduction in Sydney and Darwin with local climate mitigation        289

3.1.2   Sydney electricity demand model

The electricity demand plotted versus the ambient temperature shows the typical U shape, with an inflection point at
approximately 18 °C (Figure 3). The correlation we found for the semi-hourly electricity demand (ELDem) expressed in MW is
a function of the population weighted average temperature (T) for the areas and the extraterrestrial horizontal irradiance (G).

 Figure 3: For the period 2005-2017, observed electricity demand vs. the ambient temperature (a); electricity demand vs. the absolute
           humidity (b) at the station of Bankstown (barycentric); and modelled vs. observed electricity demand for NSW (c).

   ELDem = 6157.6 + 73.9 × sma(T, 113) + 0.136 × T × sma(T, 10) × sma(T, 26) +
   - 4.335 × max(smm(G, 191), 0.024 × delay(G, 29) × sma(T, 10))
   (3)

    Where sma (x, n) is the simple moving average of the previous n records of the quantity x. Similarly, smm is the simple
moving median. Delay (x, n) is a delayed variable, namely it considers the value of quantity x n time steps before. Then we
applied a ceiling and a floor to the computed results, corresponding to the 0.1th and 99.9th percentile of the demanded
power. The mean absolute error is of 513 MW, symmetrically distributed, with differences between observed and modelled
total demand equal to 0.1 TWh (~ 0.6 % of 17.4 TWh over the average summer period), and to 0.5 % of peak demand.

3.2 Electricity savings with mitigation

3.2.1   Electricity savings in Darwin

All the mitigation technologies reduce the electricity demand, because for the most part of the year the ambient temperature
exceeds 18 °C, namely the temperature of minimum demand (Thatcher, 2007). The green mitigation technologies offer only
a modest reduction with peak savings (0.3 MVA), while the maximum savings, equal to 0.8 MVA can be achieved in the
combined mitigation scenario (Figure 4, Table 3), yielding to a reduction of the peak electricity demand by 2 %.

   Figure 4: Electricity demand and absolute savings in the green mitigation scenario (a), cool materials scenario (b) and combined
                                                             scenario (c).
290 R. Paolini, S. Haddad, A. Synnefa, S. Garshasbi and M. Santamouris
Table 3: Statistics for the electricity demand in the unmitigated (observed and modelled) and mitigated scenarios, expressed in MVA.
Stat Unmit obs (MVA) Unmit mod (MVA) Green (MVA) Cool (MVA) Combined (MVA)
Max 40.8 39.6 38.9 39.3 38.8
Average 24.2 25.2 24.6 24.9 24.5
Median 23.7 25.7 25.1 25.4 25.0
Min 11.9 10.7 10.3 10.6 10.3
99th %-ile 37.5 36.8 36.2 36.5 36.0
1th %-ile 14.2 14.3 13.8 14.0 13.7
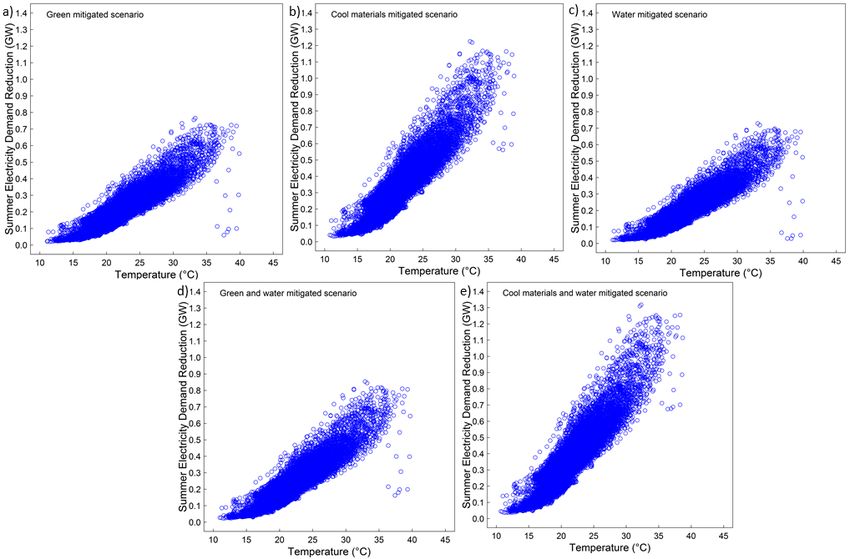
3.2.2 Electricity savings in Sydney
The total electricity savings computed under the different mitigation scenarios range between 0.42 and 0.78 TWh
considering the average of the four summers and between 0.52 and 0.91 TWh for the summer of 2016/2017, with respect
to the unmitigated demand of 17.4 and 18.2, respectively four-summer average and 2016/2017 (Table 4). The computed
differences largely exceed the bias between observed and modelled electricity demand. The largest savings are achieved
with the combination of cool and water mitigation, accounting to 4.5-5 % of the total summer demand. However, the most
relevant benefit of the mitigation of local climate, in terms of electricity demand, is the reduction of the peak demand (Figure
5, Table 5), equal to 9 % implementing mitigation with cool materials and water.
Table 4: Total electricity summertime savings in NSW with the investigated mitigation options.
Summer savings Green Cool Water Green & Water Cool & Water
AVG (TWh) 0.45 0.73 0.42 0.50 0.78
2016/2017 (TWh) 0.52 0.84 0.49 0.58 0.91
AVG (%) 2.6% 4.2% 2.5% 2.9% 4.5%
2016/2017 (%) 2.9% 4.7% 2.7% 3.2% 5.0%
Figure 5: Summer electricity demand reduction in NSW for the mitigation scenarios with greenery (a), cool materials (b), water (c),
greenery and water (d) and cool materials and water (e).Electricity demand reduction in Sydney and Darwin with local climate mitigation 291
Table 5: Peak electricity demand reduction in NSW with the investigated mitigation technologies.
Peak reduction (MW) Green Cool Water Green & Water Cool & Water
99.9th %-ile 736 1,170 701 821 1,251
99.5th %-ile 617 984 592 679 1,060
99th %-ile 551 910 525 617 980
4. DISCUSSION
Both in Darwin and in Sydney the surrogate model performs similarly to other models in the literature (e.g., Thatcher, 2007,
with R2 = 0.82), with an R2 of 0.79 in Darwin and 0.81 in Sydney. For Darwin, the performance of the model is good with
regard to the peak and the minimum electricity demand and poor in the intermediate demand range. While there is a weak
correlation with the global horizontal irradiance, there is a strong influence of humidity on the demand. This explains peak
electricity demand not occurring for the highest temperatures, but for hot and humid conditions, not surprisingly for a
tropical climate (Figure 6). Therefore, in Darwin we compute only the peak reduction.
For Sydney, the model can predict the general trend of the electricity demand, but does not capture the fuzziness,
likely due to other factors that we did not consider here, such as other climate parameters, and social variables such as
population and holiday/working-day (Psiloglou et al., 2009). Incorporating these aspects with fuzzy algorithms could provide
a further improvement of the model (Son and Kim, 2017). Moreover, further improvements can come from apportioned
data for energy uses and relative to the specific local government areas. In Sydney, for ambient temperatures below 18 °C,
the peak values are not reached for the lowest temperatures, but at approximately 10 °C. This might indicate the impact of
poor weather on the electricity uses as well as on the generation off-the-grid (e.g., building integrated photovoltaic or solar
collectors for domestic hot water), since the rainfalls are prevalent in the intermediate season. The ambient humidity does
not seem to show a dominant impact on the electricity demand, despite several occurrences of high demand with high
absolute humidity.
Assuming that the avoided electricity consumption is electricity produced by coal fired power stations in NSW (where
80 % of the generation is achieved with this source), and considering that each kWh of coal-fired electricity delivered to the
meter emits approximately 1 kg of CO2 (Koomey et al., 2010), we may read the data in Table 4 as millions of tons of CO2
emissions saved over the summer period. The avoided electricity demand corresponds to approximately one average coal
fired power station (500 MW) operated for the summer period at 70 % capacity with approximately 7 % losses, under the
cool materials scenario.
In NSW the peak demand per capita (state average) is of approximately 2 kW, while in Darwin considering the resident
population in the CBD (7,130 people, Australian Bureau of Statistics, 2017) it should be approximately of 5.5 kW. Therefore,
the peak demand reduction in Sydney would be 0.18 kW and 0.11 kW in Darwin, so it is not negligible in absolute terms.
However, Darwin CBD has a small area with several hotels and a rapidly expanding population, inducing high uncertainty in
the estimation of the number of individual energy uses. Therefore, is not possible to normalise the demand as per capita, to
compare different periods in case of significant changes to the population density and use long data series. This exemplifies
the uncertainty when dealing with the electricity demand of small areas. As previously mentioned, the absolute humidity has
a nonlinear influence on the electricity demand in Darwin (Figure 2). This occurs as to dehumidify, traditional AC systems
need a coil temperature lower than the dew point temperature, removing the moisture by condensation and the air then
needs to be reheated to be at comfort conditions, thus producing an excess load. Other type of building services, such as
desiccant or hybrid air-conditioning systems seem promising in overcoming the issue (Abdel-Salam, Ge and Simonson,
2013).
Future developments of this research include the representation of the fuzziness in the electricity parametrization. Access
to utility data partitioned by energy use and relative to smaller areas is not straightforward, but it can provide additional
insight. Two areas of uncertainty to be addressed are the normalization with population density (uncertainty in the number of
individual energy users, especially for small areas) and energy fluxes between different grids, being sub- or interstate grids.
Combined probabilistic and possibilistic approaches can support a further development of the electricity parametrization.
Where the population and electricity demand are concentrated in the middle of the geographical area, the analysis is less
affected by uncertainty and interannual variability than small areas where the fringes of the domain have the same population
density and energy use of the area of interest. A full appraisal of the error propagation is also needed.
5. CONCLUSIONS
We analysed the electricity demand in two Australian Capital Cities with very different climates, Darwin and Sydney, in the
unmitigated scenario and with local climate mitigation. We simulated mitigation with microclimate modelling considering
different strategies for the different context.292 R. Paolini, S. Haddad, A. Synnefa, S. Garshasbi and M. Santamouris
We analysed the electricity demand of the CBD of Darwin (and fringes of the Frances Bay area) and its relationship with
climate parameters. We developed a regression model capable to predict the peak electricity demand as a function of
ambient temperature, humidity and solar irradiance. We used this model to assess the benefit of local climate mitigation in
terms of avoided peak electricity demand. In the combined mitigation scenario, it is possible to reduce the peak electricity
demand by 0.8 MVA, namely 2 % of that in the unmitigated scenario. However, it is not practically possible to reduce
ambient humidity without heating, especially in tropical and marine climates. Therefore, it would be necessary to act on the
quality of building envelopes and on the technology and performance of building services.
In the Greater Sydney Area, with the most effective mitigation strategy, namely with cool materials and water, it is
possible to reduce the peak electricity demand by 1.2 GW, namely 9 % of that in the unmitigated scenario. The total
electricity demand over the summer period may be reduced by 4.5 % - 5 % of the demand in the unmitigated scenario.
These avoided total electricity demand correspond to 0.8-0.9 million tons of avoided CO2 emissions of electricity produced
by coal fired power plants.
ACKNOWLEDGEMENTS
This study was supported by the Northern Territory Government with the research contract ‘Darwin Heat Mitigation Study’
and by Sydney Water and CRC for Low Carbon Living with the research contract ‘SP0012: Strategic Study on the Cooling
Potential and Impact of Urban Climate Mitigation Techniques in Western Sydney’.
References
Abdel-Salam, A. H., Ge, G. and Simonson, C. J. (2013) ‘Performance analysis of a membrane liquid desiccant air-conditioning system’,
Energy and Buildings. Elsevier, 62, pp. 559–569. doi: 10.1016/J.ENBUILD.2013.03.028.
Auffhammer, M., Baylis, P. and Hausman, C. H. (2017) ‘Climate change is projected to have severe impacts on the frequency and
intensity of peak electricity demand across the United States.’, Proceedings of the National Academy of Sciences of the United States
of America. National Academy of Sciences, 114(8), pp. 1886–1891. doi: 10.1073/pnas.1613193114.
Australian Bureau of Meteorology (2017a) Climate Data. Available at: http://www.bom.gov.au/climate/data/ (Accessed: 24 August 2017).
Australian Bureau of Meteorology (2017b) ‘One-minute solar data’. Available at: http://reg.bom.gov.au/climate/data/oneminsolar/about-
IDCJAC0022.shtml.
Australian Bureau of Statistics (2017) ‘Estimated Resident Population (ERP), Local Government Areas, New South Wales’. Available at:
http://www.abs.gov.au/AUSSTATS/abs@.nsf/DetailsPage/3218.02015-16?OpenDocument.
Australian Energy Market Operator (2017) Electricity data, dataset. Available at: https://www.aemo.com.au/ (Accessed: 26 June 2017).
Balogun, A. A., Morakinyo, T. E. and Adegun, O. B. (2014) ‘Effect of tree-shading on energy demand of two similar buildings’, Energy and
Buildings, 81, pp. 305–315. doi: 10.1016/j.enbuild.2014.05.046.
Geoscience Australia (2016) ‘National Exposure Information System (NEXIS) Building Exposure Local Government Area (LGA) aggregated
metadata (v7.2016)’. Available at: http://www.ga.gov.au/metadata-gateway/metadata/record/82219/.
Haddad, S. et al. (2018), Mitigation of urban overheating in three Australian cities for improving the outdoor thermal environment (Darwin,
Alice Springs and Western Sydney). In: P. Rajagopalan and M.M Andamon (eds.), Engaging Architectural Science: Meeting the
Challenges of Higher Density: 52nd International Conference of the Architectural Science Association 2018, The Architectural Science
Association and RMIT University, Australia
IPCC (2014) Climate Change 2014: Synthesis Report. Contribution of Working Groups I, II and III to the Fifth Assessment Report of the
Intergovernmental Panel on Climate Change, Core Writing Team, R.K. Pachauri and L.A. Meyer. doi: 10.1017/CBO9781107415324.004.
Koomey, J. et al. (2010) ‘Defining a standard metric for electricity savings’, Environmental Research Letters. IOP Publishing, 5(1), p.
014017. doi: 10.1088/1748-9326/5/1/014017.
Psiloglou, B. E. et al. (2009) ‘Factors affecting electricity demand in Athens, Greece and London, UK: A comparative assessment’,
Energy, 34(11), pp. 1855–1863. doi: 10.1016/j.energy.2009.07.033.
Reda, I. and Andreas, A. (2004) ‘Solar position algorithm for solar radiation applications’, Solar Energy, 76(5), pp. 577–589. doi: 10.1016/j.
solener.2003.12.003.
Santamouris, M. (2014) ‘On the energy impact of urban heat island and global warming on buildings’, Energy and Buildings, 82, pp.
100–113. doi: 10.1016/j.enbuild.2014.07.022.
Santamouris, M. (2015) ‘Analyzing the heat island magnitude and characteristics in one hundred Asian and Australian cities and regions’,
Science of The Total Environment, 512, pp. 582–598. doi: 10.1016/j.scitotenv.2015.01.060.
Santamouris, M. et al. (2015) ‘On the impact of urban heat island and global warming on the power demand and electricity consumption
of buildings—A review’, Energy and Buildings, 98, pp. 119–124. doi: 10.1016/j.enbuild.2014.09.052.
Santamouris, M. (2016) ‘Cooling the buildings – past, present and future’, Energy and Buildings, 128, pp. 617–638. doi: 10.1016/j.
enbuild.2016.07.034.Electricity demand reduction in Sydney and Darwin with local climate mitigation 293 Schmidt, M. and Lipson, H. (2009) ‘Distilling Free-Form Natural Laws from Experimental Data’, Science, 324(5923). Available at: http:// science.sciencemag.org/content/324/5923/81/tab-pdf (Accessed: 15 June 2017). Son, H. and Kim, C. (2017) ‘Short-term forecasting of electricity demand for the residential sector using weather and social variables’, Resources, Conservation and Recycling, 123, pp. 200–207. doi: 10.1016/j.resconrec.2016.01.016. Thatcher, M. J. (2007) ‘Modelling changes to electricity demand load duration curves as a consequence of predicted climate change for Australia’, Energy, 32(9), pp. 1647–1659. doi: 10.1016/j.energy.2006.12.005. University of Colorado and NASA (2017) SOlar Radiation and Climate Experiment (SORCE). Available at: http://lasp.colorado.edu/home/ sorce/ (Accessed: 26 June 2017).
You can also read