OPTIMIZING MIXTURE OF SELF-COMPACTING CONCRETE FOR CONSTRUCTING A SPILLWAY SURFACE STRUCTURE
←
→
Page content transcription
If your browser does not render page correctly, please read the page content below
International Journal of GEOMATE, Aug., 2021, Vol.21, Issue 84, pp.24-33
  ISSN: 2186-2982 (P), 2186-2990 (O), Japan, DOI: https://doi.org/10.21660/2021.84.j2122
  Geotechnique, Construction Materials and Environment

    OPTIMIZING MIXTURE OF SELF-COMPACTING CONCRETE
    FOR CONSTRUCTING A SPILLWAY SURFACE STRUCTURE

                                         *Hoang Vinh Long1 and Nguyen Thanh Tuan2
                       1
                        Faculty of Building Materials, University of Civil Engineering, Vietnam;

                                           2
                                               Hydraulic Construction Institute, Vietnam

        *Corresponding Author, Received: 22 Feb. 2021, Revised: 27 April 2021, Accepted: 12 June 2021

ABSTRACT: A spillway apron is a popular hydraulic work with congested reinforcement and complex shapes.
Self-compacting concrete (SCC) with excellent workability can meet the technical requirements for the work.
This study focuses on determining the SCC optimal mix for efficient use of local coarse aggregates and 100%
crushed sand to construct a spillway surface structure. For the purpose, research steps were carried out as
follows: (1) optimize mix ratio of coarse aggregates ; (2) determine the saturated content of superplasticizer,
(3) design SCC preliminary mix; (4) set up an experimental plan; and (5) analyze test data to point out the
optimal SCC mix. The investigation of fresh SCC was conducted by slump flow test, slump flow time test, L-
box test, and segregation resistance test. Compressive strength, water tightness, and underwater abrasion of
hardened SCC were also evaluated. The abrasion tests follow the ASTM C1138-19 method and Yu-Wen Liu’s
method. The results show that the optimal SCC with slump-flow of 72 cm, the H 2 /H 1 ratio of 0.85, compressive
strength at 28 days of 42.5 MPa, abrasion resistance of 0.34 g/cm2; and water tightness of B10 meets
specifications of a spillway surface structure. Besides, the abrasion depth measured by Yu-Wen Liu's method
of water-borne sand was about four times greater than that of ASTM C1138-19.

Keywords: Self-Compacting Concrete, Spillway, Crushed Sand, Slump-Flow, Abrasion Resistance

1. INTRODUCTION                                                               often used to produce SCCs to enhance workability.
                                                                              However, the management has recently improved
    SCC is defined as concrete that can flow under                            the efficiency of mineral exploitation and
its weight to fill formwork even with congested                               environmental protection in Vietnam [6]. That
reinforcement and produce a dense and adequately                              causes the production of natural sand to decrease
homogenous material without a need for vibrating                              instead of the commonly used manufactured sand.
compaction [1, 2]. Based on providing viscosity,                              This artificial aggregate has a rough surface and
SCC can be divided into three categories: the                                 varied shapes. Therefore, it is necessary to study
powder type, viscosity modifying agent type, and                              adjusting SCC proportion with crushed aggregate to
combination type [3].                                                         meet SCC technical requirements.
    SCC was first developed in Japan in 1988 [4].                                 A significant number of previous studies have
Then the concrete spread to Europe, the USA, and                              been carried out replacing natural sand aggregate
many other countries. SCC is applied mainly for                               with crushed sand at a replacement range of about
heavily reinforced structures, where conventional                             25-100% to make SCC [7, 8, 9]. As a result, it is
concrete would not fill out formworks. This type of                           reported that river sand can be replaced by 100%
concrete is more widely used in civil and                                     artificial sand. However, Vinayak S. and Popat K.
transportation construction rather than in irrigation                         suggested that it remain satisfactory workability
works.                                                                        and compressive strength and reduce the
    Vietnam has a dense river network with more                               appearance of cracks with a maximum replacement
than 2360 rivers having a length of over 10 km.                               ratio of 60% [10]. Besides, only a few studies
Therefore, the Government of Vietnam is                                       mention the combination of coarse aggregates to
particularly interested in the construction and                               produce SCC [7, 9].
development of irrigation systems [5]. The spillway                               Due to the high content of powders, mineral
is one of the essential items of irrigation frequently                        admixtures such as limestone, fly ash, silica fume
affected by water currents with high velocity. A                              are often used as partial substitutes for cement to
spillway surface is a structure with complex shapes                           reduce the heat of hydration, reduce shrinkage, and
with many angles, heavy reinforcement.                                        increase the durability of SCC [7, 8, 9]. Limestone
Consequently, SCC is a suitable choice for spillway                           replaces fine aggregate with a 0-20% content,
surface structures.                                                           reducing slump flow but still meeting the SCC
    Due to its smooth, round surface, natural sand is                         flowability requirement while enhancing the

                                                                       24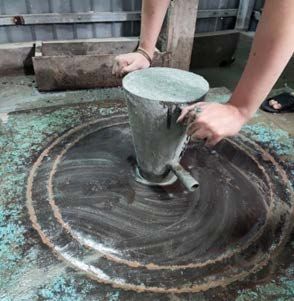
International Journal of GEOMATE, Aug., 2021, Vol.21, Issue 84, pp.24-33

segregation resistance [9]. Fly ash replaces the               Table 1 Physical properties of the PC40 cement
binder at the rate of 0-40%, and the higher fly ash
content is, the better workability is [11]. Silica fume                  Properties             Unit        Result
replaces cement at a ratio of up to 20%, which                  Specific gravity               g/cm3         3.1
increases strength and elastic modulus for SCC with             Fineness
an appropriate content of about 6% [8].                         - Retained 0.09 mm              %            1.0
    The abrasion resistance is an essential property            - Average particle size         µm          16.64
for hydraulic works; however, a few investigations              Normal consistency              %           28.5
mentioned this property of SCC [12]. Underwater                 Soundness                       mm           1.0
abrasion test is often used to evaluate the                     Setting time
performance of concrete materials for constructing              - initial setting time        minutes        135
erosion-resistant structures [13, 14]. Apart from the           - final setting time          minutes        195
standard method ASTM C1138 [15], the method                     Compressive strength
proposed by Yu-Wen Liu [16] is also used to                     - 3 days                        MPa          31.4
measure abrasion resistance. The second method                  - 28 days                       MPa           49
uses water-borne sand to simulate the abrasion
resistance of concrete under the impact of water               Table 2 Physical properties of the FA and SF
flow with suspended sand particles. This method
has the advantage of adjusting the flow rate for the                       Properties            FA          SF
model closer to reality condition. However, a few
                                                                                        3
studies compare the differences in determining                 Specific gravity, g/cm           2.34         2.45
abrasion according to these two methods.                       Strength activity index at
    Okamura's method and the European Guidelines                                                89.3         108
                                                               the age of 28 days, %
for Self-Compacting Concrete (EFNARC) are often
                                                               Average particle size, µm        18.79        0.16
used to design SCC composition. Besides, there are
many other methods to purposed for SCC design
[17, 18]. These methods are used for preliminary               Table 3 Chemical compositions of the C, FA, and
design, and then the mix is adjusted by experiment.            SF (%)
The limitation of these methods is that the obtained
composition is satisfied but may not be optimal.                                  C          FA             SF
Experimental planning is an effective method to                  SiO 2          21.94       54.01          92.1
determine the optimal mix within the research scope.            Al 2 O 3        5.16        27.90          0.96
    This paper presents the research results on                 Fe 2 O 3        3.29        5.53           1.92
determining the SCC optimal mix using local coarse
                                                                 CaO            63.70       1.17           0.34
aggregates and 100% crushed sand for constructing
a spillway surface structure. In addition, a                    MgO             2.04        1.48           0.86
comparative evaluation of abrasion measured by                  Na 2 O          0.13          -            0.38
ASTM C1138-19 and Yu-Wen Liu's method is also                    K2O            0.72        4.44           1.21
determined. The results would be applied to the                  SO 3           1.01        0.38           0.3
Hieu River Reservoir Spillway project in Quang Tri              TiO 2           0.06          -              -
province, Vietnam.                                               LOI            1.47        4.46           1.7

2. MATERIALS AND METHODS                                       2.1.2 Aggregates
                                                                   In the study, crushed sand (CS) and two coarse
2.1 Materials                                                  aggregates of maximum diameter at 10 mm (D10)
                                                               and 20 mm (D20) were mined and crushed on site
2.1.1 Binder                                                   of the Hieu River Reservoir Spillway project.
    Binder mixtures (B) were used in the study,                Besides, natural sand (NS) was also used as a
including cement (C), fly ash (FA), and silica fume            control sample. The physical properties of the four
(SF). The PC40 cement from But Son cement                      aggregates are shown in Table 4, and the particle
factory has the physical properties that meet the              size distributions are presented in Fig. 1 and Fig. 6.
ASTM C150-20 requirements of type I cement [19].
The fly ash from Pha Lai thermal power plant can               2.1.3 Superplasticizer
be classified as F class according to ASTM C618-                   TC-F1 is a polycarboxylate type of
19 [20]. The physical properties and the chemical              superplasticizer, a high-range water reducer up to
compositions of the cement, the fly ash, and the               45%. TC-F1 has a 38 ± 2% solids content and a
silica fume are given in Table 1, Table 2, and Table           density of 1.1 ± 0.02 kg/liter. The recommended use
3, respectively.                                               of TC-F1 is 0.6-1.2 liters/100 kg binder.

                                                          25
International Journal of GEOMATE, Aug., 2021, Vol.21, Issue 84, pp.24-33
Table 4 Physical properties of the four aggregates
Properties CS NS D10 D20
Specific gravity,
2.76 2.65 2.76 2.76
g/cm3
Bulk density,
1520 1550 1439 1457
kg/m3
Voids, % 44.9 41.5 47.9 47.2
Fineness modulus 3.2 2.63 - -
Content of stone
13.5 - 1.2 0.23
powder, %
Elongation and
- - 5.8 7.6
flakiness index, %
Resistance to Fig. 2 Slump flow test (Inverted Mold)
- - 26.5 28.3
degradation, %
2.2.1 Optimizing procedure
Crushing value, % - - 12.9 13.3 The procedure of optimizing the SCC mix in five
steps is shown in Fig. 3.
0
Total percentages retained, %
10
20 Optimize mix of coarse
30 aggregates
40 (ASTM C29-17)
50
60
70 Optimize dosage of
80 superplasticizer
90 (BS EN 1015-3)
100
0.14 0.63 1.25 2.5 5
0.315 Lower limit Sieve, mm Design preliminary concrete
Upper limit mix (TCVN 12631:2020)
Crushed sand
Natural sand
Set up an experimental plan
Fig. 1 Particle size distribution of the CS and NS (Central composite design)
2.1.4 Viscosity modifying agent
Viscoma-02 is a viscosity modifying agent- Determine SCC optimal mix
based polymer hydroxylate. It has solid contents of (ANOVA)
17.5±1% and a density of 1.06 ± 0.02 kg/liter.
Viscoma-02 works efficiently in the range of
0.1÷0.3 liters/100 kg binder. 2.2.2 Determine the saturated dosage of the
superplasticizer
2.2. Methods The method of determining the saturated dosage
of superplasticizer proposed by Nguyen Nhu Quy
In the study, a combination of methods to [22] was used. It is based on BS EN 1015-3 [23].
determine the SCC optimal mix. The research The superplasticizer content increases gradually
process is described in detail in Section 2.2.1. The until water separation appears at the edge of the
properties of SCC mixes such as slump flow (by mortar mass while measuring the diameter. That is
inverted mold), slump flow time (t 500 ), H 2 /H 1 ratio the saturated dosage of the superplasticizer. At this
(L-box test), and segregation resistance were dosage, the flow is usually in the range of 25- 30 cm.
measured according to TCVN 12209: 2018 [1]. A
compressive strength test was conducted with cubes 2.2.3 Determine abrasion resistance of SCC
of 150× 150× 150 mm in size. The watertightness In the study, two methods were used to assess
of the concrete was determined according to TCVN the abrasion resistance of SCC, including ASTM
3116: 1993 [21]. Some other tests are described in C1138-19 [15] and the method proposed by Yu-
Sections 2.2.2 and 2.2.3. Wen Liu [16] (see Fig. 3).
26International Journal of GEOMATE, Aug., 2021, Vol.21, Issue 84, pp.24-33
specimen.
Table 5. Specifications of pumps and pipes
Type of Nominal The Design Pipe
pumps capacity, actual speed, cross-
m3/h capacity, m/s section,
m3/h mm
The pump
generates 3 2.571 15 7.78
friction
The pump
generates 2 1.565
a vortex
Fig. 3 The model of concrete abrasion test 2.2.4 An experimental planning method
1- Concrete sample with h× φ = 100×100 mm; 2- Based on the central composite design, Design
Sand with d= 0.15-0.30 mm; 3- Pump with capacity Expert 7.0 software was used to define the
experimental plan. The experimental data were used
of 2m3/h; 4- Water; 5- Agitator.
to carry out analysis of variance (ANOVA) to
develop a regression model for compressive
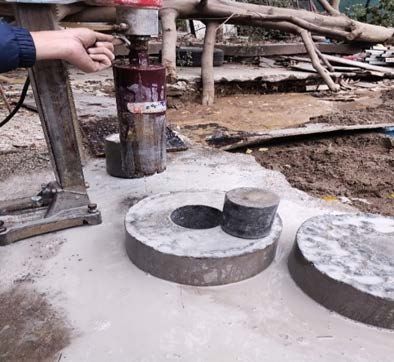
Test cylinder specimens were cast with 300 mm
strength at the age of 28 days. The SCC optimal mix
in diameter and 100 mm in height. After being
was pointed out according to the maximum value of
tested according to ASTM C1138-19 [15], a sample
compressive strength at 28 days.
was drilled at the center with a diameter of 100 mm.
That sample was investigated according to Yu-Wen
3. RESULTS AND DISCUSSION
Liu's method [16] (see Fig. 4).
3.1 Determine the Appropriate Combining Ratio
of Two Coarse Aggregates
Based on ASTM C29-17 rodding procedure [25],
the bulk density coarse aggregate mixtures with
combined ratios of D10/ (D10 + D20) = 0, 30, 40,
50, 60 and 100% were measured.
1800
1700
Bulk density, kg/m3
1600
Fig. 4 Drill sample to test concrete abrasion 1500
1400
The sand used for the experiment had a particle
size from 0.15- 0.315 mm, and sand content was 1300
400 kg/m3 mixture [16, 24]. The abrasion resistance 1200
was tested under the most unfavorable conditions 0% 20% 40% 60% 80% 100%
with an impact angle of 90°. Specifications of D10/(D10+D20)
pumps and pipes used in the test are given in Table
5. Fig. 5. Relationship between bulk density and
The abrasion resistance index is measured coarse aggregate mixing ratio
according to ASTM C1138-19 [15] and calculated
by the below formula: The experimental results are shown in Fig. 4. It
can be seen that the maximum bulk density was at
m − m2
ARI = 1 100% (1) the ratio of D10/D20= 40/60. However, some
A preliminary tests showed that the passing ability to
In which ARI is abrasion resistance index, %; m 1 L-box mold and slump flow of SCC mixtures with
and m 2 are the mass of SCC specimen before and D10/ D20 = 40/60 was worse than that with the ratio
after testing, g; A is the area of the top surface of a of D10/D20= 45/55. Simultaneously, the bulk
27International Journal of GEOMATE, Aug., 2021, Vol.21, Issue 84, pp.24-33
density at the ratio of 45/55 is only slightly smaller 32
Flow of fresh mortars, cm
than that of the 40/60 ratio. As a result, the ratio 31
D10/D20=45/55 was chosen as the coarse aggregate 30
mixed ratio for the subsequent SCC mixtures. The 29
particle size distribution of D10, D20, and the 28
coarse aggregate mix is presented in Fig. 6. 27
26
0 25
24
Total percentages retained, %
10
23
20
22
30 0.8 0.9 1 1.1 1.2
40
CS/B=1.6 CS/B=1.7 TC-F1/B
50
CS/B=1.8 CS/B=1.9
60 CS/B=2
70
80 Fig. 7 Effect of CS/B and TC-F1/B on the flow of
90 the fresh mortars with W/B = 0.30
5 10 20 40
100
31
Lower limit Flow of fresh mortars, cm
30
Upper limit Sieve (mm)
29
D10 28
D20
27
D10/D20=45/55
26
25
Fig. 6 Particle size distribution of coarse aggregates 24
23
3.2 Determine the Saturated Dosage of 22
Superplasticizer 0.8 0.9 1 1.1 1.2
CS/B=1.6 CS/B=1.7 TC-F1/B
The experiments were carried out on fresh CS/B=1.8 CS/B=1.9
mortars with ratios of W/ B = 0.30, 0.33, and 0.36; CS/B=2
a range of CS/B= 1.6-2.0; a range of TC-F1/B= 0.6-
1.2 liters/100 kg B; and constant ratio of Viscoma- Fig 8. Effect of CS/B and TC-F1/B on the flow of
02/B at 0.1%. The binder used in a batch was 500 g the fresh mortars with W/B= 0.33
of the PC40 cement and 250 g of the fly ash. That is
corresponding to the SCC proportions calculated 31
preliminarily according to TCVN 12631: 2020 [26].
Flow of fresh mortars, cm
30
Results of the consistency of the fresh mortars are 29
presented in Fig. 7, 8, 9. 28
It is clear that the flow of the mortars increases 27
proportionally with the TC-F1 content and 26
inversely to the ratios of CS/B. This relation could 25
be explained that the higher amount of TC-F1, the 24
more modifying efficiency on the surface of the 23
cement particles when interacting with water. As a 22
result, the mobility of the mortar increases 21
accordingly. In contrast, the amount of paste did not 0.6 0.7 0.8 0.9 1
change because the content of binder, water, and CS/B=1.6 CS/B=1.7 TC-F1/B
TC-F1 was kept constant. Therefore, the higher CS/B=1.8 CS/B=1.9
ratio of CS/B is, the higher amount of crushed sand CS/B=2
is, the thinner thickness of the paste layer between
aggregate particles is. Thus, the higher CS/B ratio Fig. 9 Effect of CS/B and TC-F1/B on the flow of
causes a decrease in the workability of the mortar. the fresh mortars with W/B = 0.36
28International Journal of GEOMATE, Aug., 2021, Vol.21, Issue 84, pp.24-33
When the amount of the TC-F1 increased to the respectively; the amount of coarse aggregate was
saturation threshold, the flow did not increase kept at 828 kg/m3. The experiment plan of SCC
further. If the dosage of the superplasticizer mixtures is given in Table 8.
increased continuously, a part of mixed water was
released, causing bleeding phenomena. Therefore, Table 7. The variation ranges of the factors
the appropriate dosage of superplasticizer is the
smallest dosage to achieve the highest flow of fresh Value X1 X 2 (%) X 3 (liter)
mortar. Based on the consistency test results, the
ratios of TC-F1/B= 1.1%, 1.0% and 0.9% Range of 0.3 ≤ X 1 5 ≤ X2 ≤ 170 ≤ X 3
corresponding to ratios of CS/B= 0.3, 0.33 and 0.36 variation ≤ 0.36 8 ≤ 180
respectively were chosen to calculate SCC mix in X0 j 0.33 6.5 175
the next research steps.
ΔX j 0.03 1.5 5
3.3 Concrete Mixture Design
3.4 Some Properties of SCC
3.3.1 Preliminary concrete mixture design
Based on TCVN 12631:2020 [26] and referred Properties of fresh SCC and hardened SCC are
to the EFNARC, a preliminary SCC mix was shown in Table 8.
calculated with the results shown in Table 6.
3.4.1 Slump flow
Table 6. Preliminary SCC mixture (per 1 m3) The slump flow of all mixtures was higher than
550 mm, slump flow time t 500 ≥ 2s, and passing
Cement Fly ash SF Coarse aggregate ability H 2 /H 1 ≥ 0.8. Those follow the SCC
(kg) (kg) (kg) (kg) flowability requirements of TCVN 12209:2018.
Furthermore, there was not any segregation and
338 157 20 828 bleeding observed.
CS Water TC-F1 Viscoma-02
(kg) (liter) (litre) (litre)
874 175 5.14 0.54 74
The properties of the preliminary SCC mix were 71
determined as follows: the passing ability H 1 /H 2 =
68
0.80; the slump flow was 68 cm (right after mixing);
SF0
the slump flow was 65 cm (2 hours after mixing);
65
no segregation or bleeding; the slump flow time
t 500 =4.8 s; and compressive strength at 28 days
62
f’ c28 = 35.2 MPa. The SCC flowability meets the
requirements of TCVN 12209: 2018 [1]. However,
the compressive strength was negligibly higher than 1 -1.00
the required compressive strength (35 MPa) 0.5 -0.50
0 0.00
according to the specification of the Hieu River
-0.5 0.50
Reservoir Spillway project. Furthermore, the safety A: W/B B: SF/C
-1 1.00
overload factor less than 1.1 is not ensured for field
construction. Therefore, it is necessary to set up an
experimental plan to find the optimal SCC mix that Fig. 10 Diagram of response surface of the slump
meets all technical requirements. flow- SF0 (right after mixing)
3.3.2. An experimental plan As shown in Fig. 10, the lower SF/C, the higher
Three affecting factors were selected for the slump flow (SF0) agrees with Mahalakshmi and
experimental plan, including a ratio of water to Khed’s study [8]. When the amount of silica fume
binder X 1 =N/B, a ratio of silica fume to cement increases, the flow decreases. The tiny particle size
X 2 =SF/C, and water content X 3 =W. In the study, of SF makes the amount of water for wetting SF
the variation ranges of the three factors are particles increase. Therefore, the amount of free
illustrated in Table 7. Besides, the other ingredients water can be reduced, which causes a decrease in
were determined according to the research results in the slump flow of fresh concretes. At the same W/B
the previous steps including Viscoma-02/B= 0.1 ratio, the higher amount of binder is, the greater
liters/100 kg binder, W/C= 1.93, TC-F1/B = 1.1; slump flow of the SCC mix is. It could be due to the
1.0; 0.9 corresponding to W/B= 0.30; 0.33; 0.36 thicker layer of paste between aggregates.
29International Journal of GEOMATE, Aug., 2021, Vol.21, Issue 84, pp.24-33
Table 8. Composition and properties of SCCs
No Encoded variables Actual variables Slump- Slump- Passing Com- Abrasion Water-
flow flow, ability, pressive resistance tightness
A B C X1= X2= X3= W
time cm H 2 /H 1 strength index
W/B SF/C (kg/m3)
t 500 , s f’ c28 , ARI,
(%)
MPa g/cm2
1 -1 -1 -1 0.3 5 170 4.16 72 0.87 35.5 0.61 10
2 1 -1 -1 0.36 5 170 5.13 63 0.82 32.8 0.65 8
3 -1 1 -1 0.3 8 170 4.62 67 0.84 36.9 0.50 10
4 1 1 -1 0.36 8 170 5.12 60 0.80 34.5 0.53 8
5 -1 -1 1 0.3 5 180 4.14 78 0.91 36.5 0.54 12
6 1 -1 1 0.36 5 180 4.21 68 0.85 34.0 0.59 10
7 -1 1 1 0.3 8 180 4.13 71 0.89 42.2 0.41 12
8 1 1 1 0.36 8 180 4.98 66 0.86 39.0 0.42 10
9 -1.215 0 0 0.294 6.5 175 4.65 70 0.86 42.0 0.34 10
10 1.215 0 0 0.366 6.5 175 5.62 64 0.82 38.5 0.36 8
11 0 -1.215 0 0.33 4.68 175 5.12 67 0.85 40.5 0.70 8
12 0 1.215 0 0.33 8.32 175 4.98 63 0.81 40.8 0.41 10
13 0 0 -1.215 0.33 6.5 169 411 67 0.83 35.6 0.56 8
14 0 0 1.215 0.33 6.5 181 4.45 70 0.85 38.6 0.41 8
15 0 0 0 0.33 6.5 175 4.65 68 0.82 40.2 0.43 8
3.4.2 Compressive strength The compressive strength of specimens noted 7,
As given in Table 8, the compressive strength 8, 9, 10, 11, 12, and 15 meets the strength
at the age of 28 days of SCC samples was in the requirements with a safety factor at 1.1, which are
range of 32.8-42.2 MPa. The ratios of W/B and more significant than 38.5 MPa (see Fig. 12).
SF/C influence remarkably on the compressive
strength (see Fig. 11). The higher percentage of 45
38.5 MPa
Compressive strength, MPa
SF/C, the higher the compressive strength of SCC. 40
As a result, the efficiency of the pozzolanic 35
reaction of SF in a rich-cement environment of 30
SCC improves the strength. However, the increase 25
in compressive strength is not significant
20
compared to the increase in SF/C when the ratio
rises from 6.5% to 8%. 15
10
5
0
42.2 1 2 3 4 5 6 7 8 9 10 11 12 13 14 15
Mixtures
40.85
Fig. 12 Compressive strength of SCC samples
39.5
f'c28
3.4.3 Abrasion resistance index
38.15
ARI results shown in Table 8 were determined
according to ASTM C1138-19. The samples
36.8
tended to be abrasive at the edge of the piece rather
than in the center area. That is caused by the vortex
1.00 1.00 bringing steel balls to the outside.
0.50 0.50 The ARI of specimens noted 7, 8, 9, 10, 11, 12,
0.00 0.00 14, and 15 is less than 0.5 g/cm2 following ARI
B: SF/C -0.50 -0.50
A: W/B requirements (see Fig. 14). Those almost
-1.00 -1.00
corresponded with the samples archiving the
requirement of compressive strength.
Fig. 11 Diagram of response surface of f’ c28 The ratio of SF/C also considerably influenced
30International Journal of GEOMATE, Aug., 2021, Vol.21, Issue 84, pp.24-33
ARI. The ARI was inversely proportional to SF/ C f’ c28 = 40.55 - 1.37X 1 + 1.29X 2 + 1.43X 3 -
in the range of 5-7%. After that, the increase of 0.05X 1 X 2 - 0.08X 1 X 3 + 0.95X 2 X 3 - 0.67X 1 2 -
SF/C did not decrease the ARI of SCC 0.40X 2 2 - 2.80X 3 2
significantly. Thus, SF can enhance the (2)
compressive strength and increase the abrasion The Model F-value (Fischer variance) of 15.18
resistance to a specific limit for SCC. The results implies the model is significant. There is only a
agree with the suggestion that SCC with about 0.01% chance that a Model F-value this large could
6%SF having good performance [8]. occur due to noise.
To check the error between the regression
model and experiment, at the same time, and
0.7
compare properties of SCC using CS and using NS,
0.61
the two mixtures with the same composition given
in Table 9 were prepared. Their mechanical
0.52 characteristics were measured as shown in Table
ARI
10.
0.43
Table 9. The optimal SCC mixture (per m3)
0.34
Cement, Fly ash, SF, Coarse aggregate,
-1.00
(kg) (kg) (kg) (kg)
-0.50
A: W/B
0.00
0.50
1.00 342 221 27 828
0.50 0.00
1.00 -1.00
-0.50 CS or NS, Water, TC-F1, Viscoma-02,
B: SF/C
(kg) (liter) (liter) (liter)
Fig. 13 Diagram of response surface of ARI 783 177 6.49 0.59
0.8 Table 10. Properties of optimal and control SCCs
0.7
0.6 Optimal Control
Properties Unit
0.5 sample sample
ARI, g/cm2
0.4 Passing ability
0.85 0.9
0.3 (H 2 /H 1 )
0.2 Slump-flow cm 72 78
0.1 Slump-flow after
cm 69 72
0.0 casting 2 hours
1 2 3 4 5 6 7 8 9 10 11 12 13 14 15 Segregation/
Number of mixtures No No
Bleeding
Slump- flow time
Fig. 14 Abrasion resistance index of SCC samples s 4.8 3.5
(t 500 )
3.4.4 Watertightness Compressive
MPa 42.5 39.7
Ensuring water resistance is required for strength
hydraulic concretes. Depending on the project ARI g/cm2 0.34 0.35
specifications, the watertightness of concrete can Depth of abrasion
mm 1.51 1.55
be used to design. The watertightness of the mixes (ASTM C1138)
was from B8-B12. When the quantity of binder and Depth of abrasion
the SF content increases, the watertightness mm 6.2 7.2
(Yu-Wen Liu)
increases accordingly, as Deng-Deng Zheng et al.
Watertightness 10 10
reported [27]. That accounts for the filling role of
SF, making concrete structures denser.
The properties of both optimal and control
specimens meet specifications according to TCVN
3.5 Optimal SCC Mix and Control SCC Mix
12209:2018 and the project specifications in which
the compressive strength f’ c28 > 38.5 MPa, and
The experimental data of compressive strength
watertightness is higher than B8 and ARI < 0.5 g/
at the age of 28 days were analyzed to generate the
cm2. However, SCC using NS had better slump
following regression model and determine the SCC
flow and workability maintenance after 2 hours at
optimal mix (see Table 9)
78 and 72 cm than samples using crushed sand at
31International Journal of GEOMATE, Aug., 2021, Vol.21, Issue 84, pp.24-33
72 cm and 69 cm, respectively. corresponding to CS/B= 0.3, 0.33 và 0.36
The compressive strength of the optimal SCC respectively were suitable for SCC using 100%
using the CS was 42.5 MPa, slightly different from crushed sand.
that obtained from the model at 42.7 MPa and The optimal SCC mix using the crushed sand
nearly 7% higher than the value 39.7 MPa of the was figured out that meets all SCC specifications
control specimens using the river sand. of the project to construct a spillway surface
When compared with some studies SCC using structure with 72 cm in slump flow, 42.5 MPa in
100% CS, it can be seen that the compressive compressive strength at 28 days, and 0.34 g/cm2 in
strength of 43.5 MPa of the optimal mix with W/ abrasion resistance index, and B10 in
B = 0.34, SF/ C = 6.6% and FA/ B= 30% is slightly watertightness.
lower than 47.1 MPa of the specimens noted SCC using entirely crushed sand has slightly
SCC+5%SF with W/B=0.31, SF/C= 5.3%, and worse workability but better compressive strength
FA/B= 20% [8]; and remarkably greater than the and abrasion resistance than the control specimens
33.79 MPa of M100 sample with W/ B = 0.32, SF/ using natural sand.
C = 6.2%, FA/ B = 0% [7]. Both the compared The average depth of abrasion measured by
samples have smaller W/B and FA/ B ratios, which water-borne sand of Yu-Wen Liu was about four
indicates the efficiency of determining the optimal times greater than that by ASTM C1138-19.
mix used in this study.
The SCC sample using CS with the abrasion 5. REFERENCES
resistance (ASTM C1138) at the age of 28 days
was 1.51 mm, which is better than that of the [1] TCVN 12209: 2018 Self- Compacting
sample using NS with 1.55 mm. Compared to the Concrete- Specification and test method (in
two specimens named M40-0 and M50-0 with Vietnamese: Tiêu chuẩn quốc gia TCVN
f’ c28 = 37.3 MPa and 48.3 MPa, SF/C= 0 and 12.7%, 12209:2018 về Bê tông tự lèn - Yêu cầu kỹ
abrasion resistance at 28 days is 3,520 mm and thuật và phương pháp thử).
1,268 mm, respectively [13]. It can be seen that the [2] Takefumi S. and Yasunori M., Development
abrasion resistance of the optimal sample is almost of Combination - Type Self - Compacting
equivalent to the results of another study. Concrete and Evaluation Test Methods,
The SCC specimen using the CS had better Journal of Advanced Concrete Technology
abrasion resistance than that of the SCC specimen Vol. 1, No. 1, 2003, pp. 26-36
with the NS. The average depth of abrasion [3] Japan Society of Civil Engineers,
measured according to ASTM C1138-19 [15] was Recommendation for Self- Compacting
about four times less than that of Yu-Wen Liu's Concrete, 1999.
method [16]. That figure should be evaluated and [4] Okamura H. and Ouchi M., Self-compacting
used to simulate actual conditions more carefully concrete, Journal of Advanced Concrete
in further researches. Technology, Vol. 1, No. 1, 2003, pp.5-15.
The watertightness of the two SCC specimens [5] Decision No. 38/ QD-TTg of the Prime
using the crushed sand and the natural sand was Minister dated Jan. 7, 2020 on Approving the
similar. Vietnam Irrigation Strategy to 2030 and a
vision to 2045 (in Vietnamese: Quyết định số
4. CONCLUSIONS 38/QĐ-TTg của Thủ tướng chính phủ ngày
07/1/2020 về Phê duyệt Chiến lược thủy lợi
Based on the research results, the following Việt Nam đến năm 2030, tầm nhìn đến năm
conclusions can be drawn: 2045).
This study has come up with a procedure to [6] Directive No. 03/ CT-TTg of the Prime
determine the SCC optimal mix, including (1) Minister dated March. 30, 2015 on
determine the appropriate mixture of coarse Strengthening the effectiveness of the
aggregate with maximum bulk density according implementation of policies and laws on
to ASTM C 29-17; (2) determine the saturated minerals (in Vietnamese: Chỉ thị số 03/CT-
dosage of superplasticizer following BS EN 1015- TTg của Thủ tướng chính phủ ngày 30/3/2015
3; (4) design preliminary SCC mix based on the về việc Tăng cường hiệu lực thực thi chính
guideline of TCVN 12631:2020; (4) design and sách, pháp luật về khoáng sản).
conduct an experimental plan; (5) generate a [7] P. Mahakavi and R. Chithra, Effect of recycled
regression model and choose the optimal mix coarse aggregate and manufactured sand in
based on criteria. The optimal mix based on this self-compacting concrete, Australian Journal
process shows a good performance. of Structural Engineering, Vol. 21, 2020, pp.
The ratio of coarse aggregate at D10/ D20= 33-43.
45/55, and the dosages of superplasticizer at the [8] S. H. V. Mahalakshmi and V. C. Khed,
ratios of TC-F1/B= 1.1%, 1.0% và 0.9% Experimental study on M-sand in self-
32International Journal of GEOMATE, Aug., 2021, Vol.21, Issue 84, pp.24-33
compacting concrete with and without silica (SCC) using the compressible packing model,
fume, Materials Today: Proceedings, Vol. 27, the Chinese method and the European
2020, pp. 1061-1065. standard, Construction and Building Materials,
[9] Smain B., Belkacem M., Siham K.B., and Said. Vol. 43, 2013, pp. 382-388, 2013.
K., Performance of self-compacting concrete [19] ASTM C150- 20 Standard Specification for
with manufactured crushed sand, Advances in Portland Cement
Concrete Construction, Vol. 7, No. 2, 2019, pp. [20] ASTM C618- 19 Standard Specification for
87-96. Coal Fly Ash and Raw or Calcined Natural
[10] Vinayak S. and Popat K., Properties of Pozzolan for Use in Concrete
Concrete by Replacement of Natural Sand [21] TCVN 3116:1993 Heavyweight concrete -
with Artificial Sand, International Journal of Method for determination of watertightess (In
Engineering Research & Technology (IJERT), Vietnamese: Bê tông nặng - Phương pháp xác
Vol. 1, Issue 7, 2012. định độ chống thấm nước).
[11] Kumar S., Sanjay K., and Baboo R., Self [22] Nguyen N. Q., Study on the effects of
Compacting Concrete Using Fly Ash and limestone powder and fly ash on the properties
Silica Fumes as Pozzolanic Material, Journal of pumped concrete mixtures, Journal of
of Engineering Technology, Vol. 6, Issue 2, Science and Technology in Civil Engineering,
2017, pp. 394-407. Vol.1, 2007, pp. 30-35 (in Vietnamese:
[12] Kazim T. and Mehmet K., Abrasion Nguyễn Như Quý, Nghiên cứu ảnh hưởng của
Resistance and Mechanical Properties of Self- phụ gia mịn bột đá vôi và tro bay nhiệt điện
Compacting Concrete with Different Dosages đến tính chất của hỗn hợp bê tông bơm, Tạp
of Fly Ash/ Silica Fume, Indian Journal of chí Khoa học công nghệ xây dựng, Số 1, 2007,
Engineering & Materials Sciences, Vol. 18, tr. 30-35)
2011, pp. 49-60. [23] BS EN 1015-3 Methods of test for mortar for
[13] Sallal. R. A., Ali. N. H., Nadheer S. A., and masonry- Part 3: Determination of consistence
Yasir H. D., Underwater abrasion of steel of fresh mortar (by flow table)
fiber-reinforced self-compacting concrete, [24] Mohammad S. H., Abrasion on Concrete
Case Studies in Construction Materials, Vol. Surfaces Caused by Hydraulic Loading with
11, 2019. Water-Borne Sands, Report, 2015
[14] Nader G., Meysam N., and Mohammad. A.A., [25] ASTM C29-17, Standard Test Method for
Abrasion Resistance of Self-Consolidating Bulk Density and Voids in Aggregate
Concrete, Journal of Materials in Civil [26] TCVN 12631:2020, Self- compacting
Engineering, Vol. 26, 2014., pp. 296-303. concrete - Mix design (in Vietnamese: Tiêu
[15] ASTM C1138-19 Standard Test Method for chuẩn quốc gia TCVN 12631:2020 về Bê tông
Abrasion Resistance of Concrete tự lèn - Thiết kế thành phần).
[16] Yu W.L., Tsong Y., and Tsao H.H, Abrasion [27] D.-D. Zheng, T. Ji, C.-Q. Wang, C.-J. Sun, X.-
erosion of concrete by water-borne sand, J. Lin, and K. M. A. Hossain, Effect of the
Cement and Concrete Research, Vol. 36, Issue combination of fly ash and silica fume on
10, 2006, pp. 1814-1820. water resistance of Magnesium–Potassium
[17] G. R. de Sensale, I. R. Viacava, and A. Phosphate Cement, Construction and Building
Aguado, Simple and Rational Methodology Materials, Vol. 106, 2016, pp. 415-421, 2016.
for the Formulation of Self-Compacting
Concrete Mixes, Journal of Materials in Civil
Copyright © Int. J. of GEOMATE All rights reserved,
Engineering, Vol. 28, 2016, pp. 04015116-4 -
including making copies unless permission is obtained
04015116-10. from the copyright proprietors.
[18] Nassim S., Mahfoud B., Yahya S., and Nor E.
A., Composition of self -compacting concrete
33You can also read