Influence of the physical characteristics of sand and the crushed filler content on the properties of self-leveling mortars - SciELO
←
→
Page content transcription
If your browser does not render page correctly, please read the page content below
Cerâmica 67 (2021) 179-187
179                                                                              http://dx.doi.org/10.1590/0366-69132021673823070

     Influence of the physical characteristics of sand and the crushed filler
               content on the properties of self-leveling mortars
                                         T. P. Scolaro1*, J. C. Rocha1
 1
  Federal University of Santa Catarina, Department of Civil Engineering, Laboratory of Waste Valorization and
           Sustainable Building Materials, R. João Pio Duarte Silva, s/n, Florianópolis, SC, Brazil

                                                                   Abstract

     The properties of self-leveling mortars (SLMs) in the fresh and hardened state are strongly affected by their formulation. In this
     study, the influence of three different quartz sands (different physical characteristics) was investigated in SLMs, as well as the
     replacement of these sands by crushed basalt filler. The tests performed were: spreading, density in the hardened state, absorption by
     immersion, flexural strength, compressive strength, dynamic modulus of elasticity, water capillary absorption, and drying shrinkage.
     The results obtained show that the particle size distribution (PSD) of sand influenced most of the properties. The shape and texture
     of the sand grains did not seem to have much influence on the properties of SLMs when the PSD was different. The powdery (fine)
     material content of sand seemed to affect most notably properties in the fresh state and shrinkage. The increase in the content of sand
     replacement by filler decreased the workability of SLMs, however, it may improve the initial flexural and compressive strengths
     and reduce the drying shrinkage.
     Keywords: self-leveling mortar, quartz sand, crushed filler, mechanical strength, drying shrinkage.

INTRODUCTION                                                               use of crushed filler is necessary due to the lack of natural
                                                                           sand and the long transport distances. The use of by-
    Self-leveling mortars (SLMs) are different from                        products from stone crushers as a partial replacement for
traditional mortars due to their high fluidity. These mortars              natural sand reduces the environmental impact caused by
are often used in flooring systems, for the renovation of                  the conventional process of extracting natural sand. Also, a
irregular substrates and for the construction of new ones,                 significant production of the mortars and generation of these
by the formation of a flat and smooth surface [1]. As well                 by-products from quarries occurs next to the urban areas.
as self-compacting compounds, in self-leveling mortars,                    However, the influence of crushed filler on the properties
there are several factors that affect performance in the                   of SLMs must be evaluated. In addition, the dimensions
fresh and hardened state. Rizwan and Bier [2] emphasize                    of the sand grains should also be studied. According to
the importance of adequate formulations, with appropriate                  Katsiadramis et al. [13], coarse aggregates act as obstacles
contents of mineral additions, in order to optimize the water              in self-leveling systems, while fine aggregates favor fluidity.
demand, cement content, shrinkage, heat of hydration,                      The influence of coarse particles is related to the difficulty
compaction, and microstructure. The compounds used in the                  of movement between them, resulting from the existence of
production of SLMs change the amount of admixture needed                   a coefficient of friction between these particles, hindering
to obtain adequate consistency and affect their mechanical                 the fluidity. Benabed et al. [14] verified the influence of sand
properties. In recent studies, the influences of some factors              in self-compacting mortars. They observed that dune sand
have been assessed, such as the type and/or content of                     (fineness modulus of 0.78) reduces fluidity when compared
cement [1, 3-7], admixture [8, 9], mineral addition [10-12],               to crushed and river sands (fineness modulus of 2.21 and
and fine aggregate [8].                                                    2.45, respectively) because it requires more water. In binary
    Inert fillers, such as limestone, have often been used to              and ternary mixtures of crushed, dune, and river sands, it
optimize the workability (without segregation), packing,                   was found that an increase in the dune sand content causes a
and cost of SLM. The use of sands with high amounts of                     decrease in compressive strength. This is due to the fact that
powdery (fine) material and fillers generated as by-products               the larger surface area of this sand requires higher cement
of stone crushers in quarries may be some alternative                      content to coat the aggregate surface [14]. Canbaz et al. [8]
sources of fine material, helping to promote viscosity.                    studied the effect of natural river sand (0-1 and 0-3 mm)
Besides that, in the global context, building construction                 and crushed sand from a concrete company in self-leveling
consumes a large amount of natural resources and generates                 screeds. They reported a smaller spreading diameter in self-
a high volume of waste. Then, in large urban centers, the                  leveling screeds with river sand 0-3 mm with 5.4% powdery
                                                                           (fine) material, compared to those with river sand 0-1 mm
                                                                           with 1.0% fines, for the same superplasticizer content. This
* https://orcid.org/0000-0003-4296-0686                                    indicates that in addition to the fineness, the filler content of
T. P. Scolaro et al. / Cerâmica 67 (2021) 179-187                                                 180

the sand also influences the workability. Regarding the type,          Table I - Chemical and physical characteristics of cement
it was found that river sand has grains with a rounded shape,          and crushed filler.
which provides a higher spreading diameter for mixtures
                                                                                                          Cement CPV -          Crushed
when compared to crushed sand that has grains that are                             Characteristic
                                                                                                             ARI                 filler
more angular. Moreover, it was observed that the rounded
aggregate provides better casting and compaction to the                                SiO2 (%)              17.30                68.60
mixtures, resulting in higher compressive strengths and higher                      Al2O3 (%)                   -                 12.77
ultrasonic pulse velocity [8]. According to Belhadj et al. [15],                    Fe2O3 (%)                 3.03                 5.89
better mechanical results are verified in concretes with sands
with an angular shape. However, the authors compared sands                             CaO (%)               66.10                 5.17
with not only different shapes but also different natures.                             K2O (%)                1.38                 3.78
Regarding the surface texture, aggregates with rough surfaces                          SO3 (%)                4.63                     -
provide better mechanical locking and greater surface area to
                                                                                       CO2 (%)                6.93                 2.67
react with hydrated cement paste, generally leading to higher
strength, when compared to aggregates with a smooth surface.                        D50 (mm)                 19.46                51.47
However, rough texture aggregates demand more water for                           Specific gravity            3.16                 2.52
the same workability, which may be unfavorable from the
                                                                          Blaine specific surface
point of view of mechanical strength [16].                                                                    5416                2804
                                                                               area (cm²/g)
    Previous studies showed that the aggregate
characteristics and content may affect the properties of self-
compacting and self-leveling compounds [8, 14]. Moreover,                    100
it was reported that the powder of basalt waste may be                        90
successfully used in concrete [17]. However, the influence                    80
of sand and basalt filler has been seldom studied in SLMs.
                                                                     Volume (%)

                                                                              70
In this way, the novelty of this study is the evaluation of the               60
properties of SLMs with three different sands available in                    50
Southern Brazil and the partial replacement of these sands                    40
                                                                              30
by crushed basalt filler. This study intends to contribute to
                                                                              20
the identification of the main sand characteristic which can
                                                                              10
influence the properties of self-leveling mortars. Moreover,                   0
this work seeks to encourage the use of crushed fillers, due                       1                 10              100                   1000
to the important role that fines play in self-leveling mortars.                                   Particle diameter (µm)
The aim of this study is to evaluate whether the fresh and             Figure 1: Particle size distribution curve of crushed filler.
hardened SLMs properties are influenced by the different
sand characteristics - fine (powdery) content, particle                sand (M), fine sand (F), and very fine sand (V). The physical
size distribution, and shape/texture of the grains - and by            properties and the particle size distribution curves of these
the replacement of these sands by crushed filler, besides              sands are shown in Table II and Fig. 3, respectively. Fig.
discussing the feasibility of producing self-leveling mortars          4 shows images of grains from sands M, F and V. All
with these sands and crushed basalt filler.                            images were obtained with an optical microscope (SZ-2,
                                                                       Olympus) using reflected light. Before capturing the images,
EXPERIMENTAL                                                           samples of each type of sand were separated by quartering
                                                                       and subsequently dried in an oven at 105±5 °C for 72 h.
     Materials: the mortars were prepared with Portland cement         Regarding the shape and texture of the grains, according to
CPV-ARI, according to NBR 16697 standard [18] (equivalent              NBR 7389-1 standard [20], it was qualitatively verified that
to Type III Portland cement specified by ASTM C150                     the grains of sand M were sub-rounded, with low sphericity.
standard [19]). The chemical and physical characteristics of           In addition, it was possible to observe the powdery (fine)
this cement and the crushed basalt filler, from basalt quarry          material covering the M grains. Grains of sands F and V
located in Rio Grande do Sul (Brazil), are summarized in               were rounded and had high sphericity. A polycarboxylate
Table I. Fig. 1 shows the particle size distribution curve, and        superplasticizer with a specific mass between 1.080 and
Fig. 2 shows scanning electron microscopy (SEM) images                 1.120 g/cm3, pH between 4.5 and 6.5, and solid content
of the crushed filler. The SEM micrographs were obtained               of 51% was used as an admixture to achieve the desired
using a microscope (SM-6390LV, Jeol), operating at 10 kV.              spreading diameter.
All samples were coated with a thin layer of gold and kept in              Proportions and mixture procedures: self-leveling
a vacuum desiccator until the testing. The particles of crushed        mortars (SLMs) were produced with a water/cement
filler presented a morphology with an angular shape and                (w/c) ratio of 0.5 (wt%), considering a binder:aggregate
rough surface (Fig. 2).                                                (cement:filler+sand) ratio of 1:2 (mass), according to Table
     Three types of quartz sand were used, named medium                III. In mortar notation, the first letter represents the type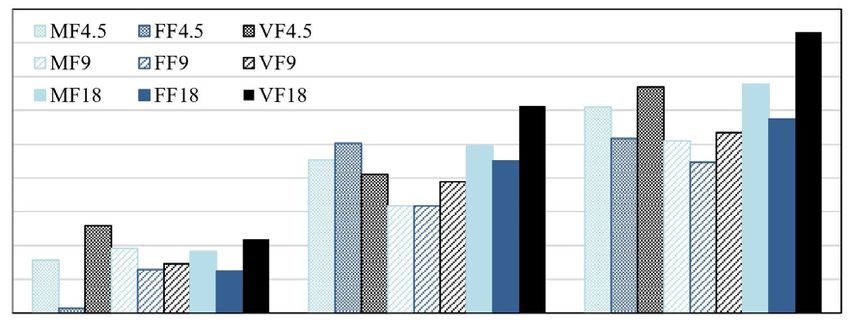
181                                                           T. P. Scolaro et al. / Cerâmica 67 (2021) 179-187

                                                                            a)                                                                           b)

Figure 2: SEM images of crushed filler.

Table II - Physical characteristics of sands.
                                     D10             D50                D90            Fineness       D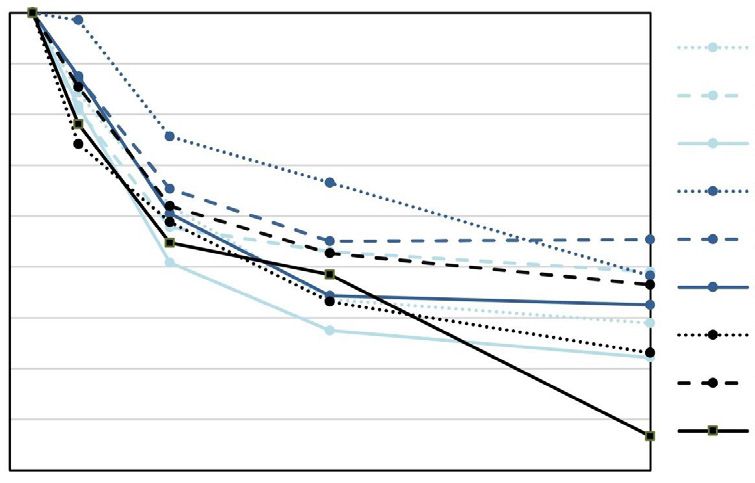
T. P. Scolaro et al. / Cerâmica 67 (2021) 179-187 182
to NBR 16541 standard [21]: 1) mixing of anhydrous prismatic specimens. According to ASTM C1708 standard [28],
materials at low speed for 60 s; 2) mixing at low speed for the specimens were demolded after 24 h and the initial length
30 s with the addition of 75% of water in the initial 10 s; 3) was recorded. The other readings were taken at 3, 7, 14 and 28
mixing at high speed for 60 s; 4) stop the mixer for 90 s for days after the specimens were molded. After demolding, the
scraping the bowl and paddle; and 5) mixing at low speed specimens were stored in an environment with relative humidity
for 60 s with the addition of the remaining 25% of water and (RH) >50%. The shrinkage was calculated according to:
superplasticizer in the initial 10 s. Then, the specimens were
molded in a room with 60%±5% relative humidity (RH) and ei = (Li – L0)/250.100% (A)
remained there until the tests (1 or 28 days).
Experimental tests: this study involved some visual where ei is the value of shrinkage at age i (%), Li is the length
analysis in the fresh state: leveling, edge quality, risks of at a certain age (mm), L0 is the length after demolding (mm),
segregation, and bleeding. To assess the workability, the i is the age of measurement, and 250 is the effective length
mortar spreading diameter was determined by filling a cone of mortar specimen (mm).
trunk with dimensions: fsup=70 mm, finf=100 mm, and h=50
mm. Later, the truncated cone was filled and the mortar RESULTS AND DISCUSSION
spread. The average of two perpendicular measurements of
diameter was taken. The spreading diameter of SLMs was Table IV summarizes some characteristics of self-
carried out to determine the superplasticizer content needed leveling mortars (SLMs) in the fresh and hardened state. The
for each mortar to reach a spreading between 25 and 30 cm, spreading diameter of all mortars was between 25 and 30 cm,
as recommended for SLMs [22], which need large flowability. according to the target range. The results of the voids index,
The density in the hardened state was determined in three determined by water absorption (by immersion), were not
40x40x160 mm prismatic specimens at 28 days of curing, notably influenced by the filler content and the type of sand.
following the recommendations of NBR 13280 standard However, although there was no pronounced difference in
[23]. The absorption by immersion and the voids index was the open porosity, the frequency of pores of different sizes
determined in two cylindrical specimens with f=50 mm and may vary in different mortars. Regarding density in the
h=10 mm, according to NBR 9778 standard [24]. To determine hardened state, the results were similar, showing that the
the dry weight, the specimens were dried for 72 h. After the filler content and the type of sand did not have a great impact
specimens were maintained immersed in water for 72 h, then on density. The density values were similar to those found
they were placed in a container full of boiling water for 5 h. by Barluenga and Hernández-Olivares [22] and Canbaz et
The specimens remained immersed in water until cooling al. [8] for SLMs, with values varying between 1720-2110
and then the immersed saturated weight was recorded using and 2200-2420 kg/m3, respectively.
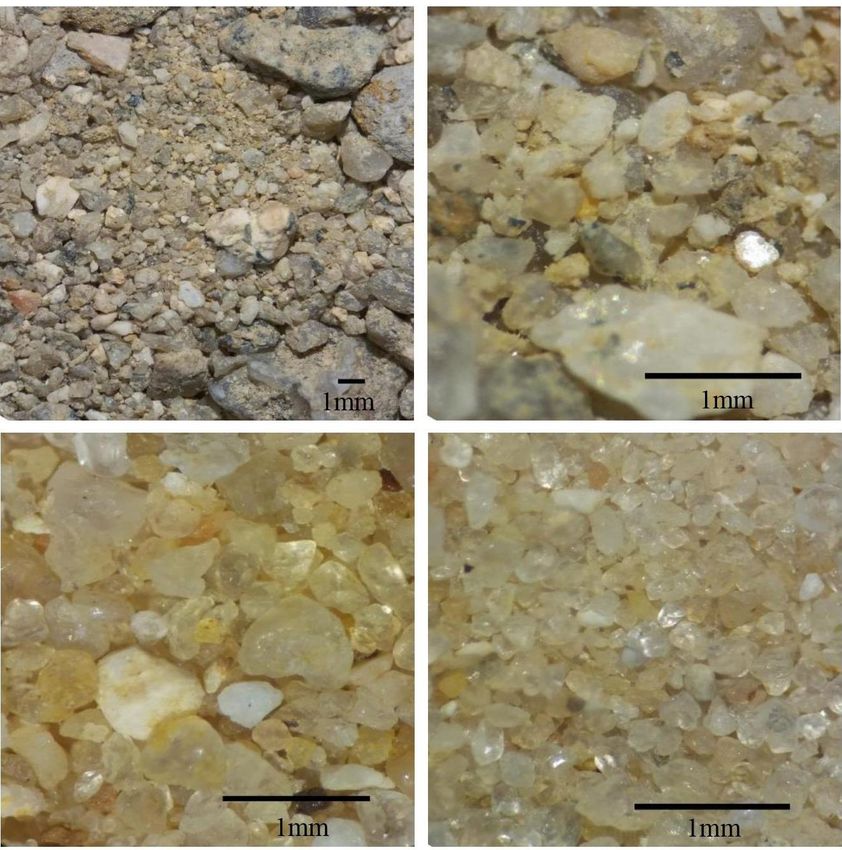
a hydrostatic balance. The saturated weight was determined Visual analysis: images of SLM spreading are shown
after drying the specimens with a damp cloth. To the flexural
and compressive strength tests, mortars were poured into Table IV - Characteristics of SLMs in the fresh and hardened
molds without any vibration or compaction and the demolding state.
was carried out within 24 h. The flexural strength of mortars
was evaluated with 3 prismatic specimens with dimensions of Spreading Voids
Absorption Density*
40x40x160 mm. The compressive strength was determined in Mixture diameter index
(%) (kg/m3)
each of the halves resulting from the flexural test (6 specimens), (cm) (%)
in accordance with NBR 13279 standard [25]. Specimens MF4.5 28.5 11.7 21.9 2036.7
were tested at 1 and 28 days of curing. The dynamic modulus MF9 26.0 11.4 21.7 2017.1
of elasticity was performed in three 40x40x160 mm prismatic
MF18 29.2 12.3 22.5 2057.4
specimens at 28 days of curing. The test was determined by
ultrasonic wave propagation, following the recommendations FF4.5 25.2 11.0 21.2 2090.6
of the NBR 15630 standard [26]. The water capillary FF9 26.0 11.0 20.8 2090.1
absorption was determined in two cylindrical specimens with FF18 30.0 11.4 21.0 2023.1
f=50 mm and h=10 mm at 28 days of curing, in accordance
with NBR 9779 standard [27]. The specimens were in contact VF4.5 25.7 11.5 21.2 2030.2
with water and the water level remained constant at 5±1 mm VF9 25.0 11.8 21.7 2022.5
above its lower face. The weight of the samples was recorded VF18 25.0 12.4 22.0 1984.6
at 10, 30 and 60 min and 3, 6, 24, 48 and 72 h after the contact * hardened state.
of the samples with the water. The mass of absorbed water per
unit area (g/cm2) was plotted as a function of the square root
of time (s0.5). Sorptivity, or capillary coefficient, is the slope in Fig. 5. It was possible to observe that the use of F sand
of the line fitted to the results. In this work, sorptivity was provided a smoother surface to the SLMs, while the use of
calculated in the initial period (1 h) of the capillary absorption. M sand caused higher roughness to the SLMs.
The drying shrinkage was evaluated in two 25x25x285 mm Workability: to reach the desired workability (spreading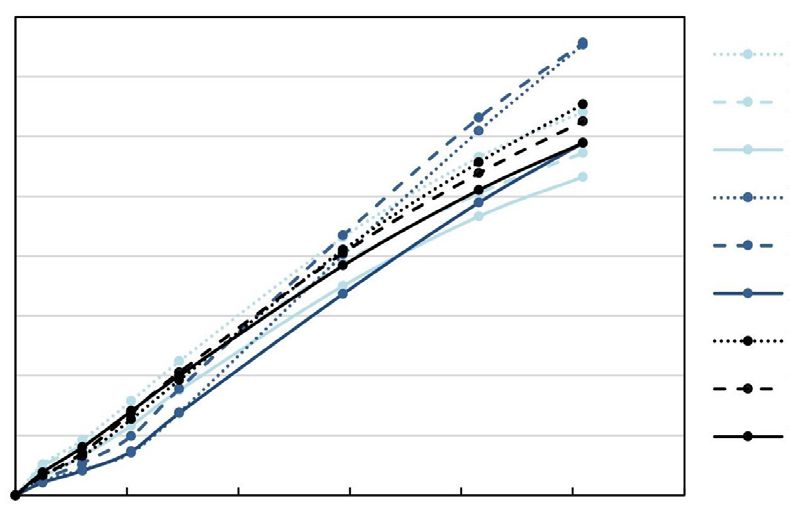
183                                       T. P. Scolaro et al. / Cerâmica 67 (2021) 179-187

                                                                        up to 43% and 17.5%, respectively, higher than mortars with
                                                                        sand V. At 28 days, the increase in compressive strength
                                                                        values was up to 14% and 20%, considering mortars with
                                                                        sands M and F, respectively, in comparison with mortars
                                                                        with sand V. The higher compressive strengths developed
                                                                        by the SLMs with sands M and F may be the result of the
                                                                        more continuous particle size distribution of these sands,
                                                                        which may have contributed to a better filling of the voids.
                                                                        SLMs with sand V showed lower strength values. This
                                                                        decrease in strength may be attributed to the increase in the
                                                                        surface area of finer aggregates, demanding more cement
                                                                        to cover the aggregate surfaces [14]. In SLMs with sand M,
                                                                        the increase in the replacement of sand by crushing filler up
                                                                        to 18% resulted in higher initial flexural and compressive
                                                                        strengths, while in SLMs with sands F and V, the initial
                                                                        strength increased with the increase in filler content up to
                                                                        9%. At 28 days there were no significant differences in the
                                                                        strengths of mortars with varying contents of fines. The use
                                                                        of crushed filler as a substitute for sand improved the initial
                                                                        flexural and compressive strengths of the SLMs, probably
                                                                        due to the filling effect, providing better packing to the
                                                                        particles. The larger pores were filled with crushed filler,
                                                                        which densified the hydrated cement paste structure and
Figure 5: Images of spreading of SLMs.                                  benefited the development of mechanical properties [17].
                                                                        Moreover, the filler particles acted as nucleation sites for
diameter between 25 and 30 cm), a higher superplasticizer               the precipitation of hydrates, accelerating the hydration of
content was needed in the SLMs with sand M (Table III).                 cement grains and increasing the compressive strength at
Although this sand showed the highest fineness modulus                  early ages [31].
of the sands used, it had grains that were visually less
rounded and less spherical compared to the other sands                                              10
                                                                    Flexural strength (MPa)

(Fig. 4), which may have caused a higher water demand [8],                                                                                                a)
in addition to a high powdery (fine) material content [29].                                          8
The presence of powdery material increases the specific
surface area, demanding a higher amount of water to wet all                                          6
particles in the mixture [30]. In regard to the other sands (F
and V), SLMs containing sand V demanded a slightly higher                                            4
amount of superplasticizer. The result was consistent with
the smaller fineness modulus of the sand V, as also reported                                         2
by Benabed et al. [14] since, in terms of shape and texture,
the sands did not differ significantly from each other. It was                                       0   MF4.5 MF9   MF18 FF4.5   FF9   FF18 VF4.5 VF9   VF18
also observed that a higher amount of superplasticizer was                                                                 1d     28d
added to the mortars as the crushed filler content increased
(and the amount of sand in the mixture decreased). With the
                                                                       Compressive strength (MPa)

increase in filler addition, the workability of the mixture                                         40
decreased due to the increase in the specific surface area of                                                                                             b)
                                                                                                    35
the particles, resulting from the replacement of sand by the                                        30
filler [17].
                                                                                                    25
     Flexural and compressive strengths: Figs. 6a and 6b
                                                                                                    20
show the results of flexural strength and compressive
strength, respectively. In general, it was verified that SLMs                                       15
using sands M and F showed better performance in terms                                              10
of flexural strength, both at 1 and 28 days. A similar trend                                         5
was observed in the behavior of mortars in relation to                                               0
compressive strength, in which higher results were obtained                                              MF4.5 MF9   MF18 FF4.5   FF9   FF18 VF4.5 VF9   VF18
in SLMs with sands M and F and smaller with sand V.                                                                        1d     28d
Considering mortars with the same filler content at 1 day,              Figure 6: Flexural (a) and compressive (b) strengths of SLMs at 1
mortars with sands M and F showed compressive strength                  and 28 days.
T. P. Scolaro et al. / Cerâmica 67 (2021) 179-187 184
Table V - Results of analysis of variance (ANOVA) of compressive strength results of SLMs at 1 and 28 days.
Matrix Variable SS DF MS F p
Filler content 83.04 2 41.52 94.73 0.000
Compressive Type of sand 33.37 2 16.68 38.07 0.000
strength at 1
day Filler content*Type of sand 45.11 4 11.28 25.73 0.000
Error 18.85 43 0.44
Filler content 0.16 2 0.08 0.03 0.967
Compressive Type of sand 104.07 2 52.03 21.56 0.000
strength at 28
days Filler content*Type of sand 83.20 4 20.80 8.62 0.000
Error 101.35 42 2.41
SS: sum of squares; DF: degrees of freedom; MS: mean squares.
Table VI - Results of Tukey test of compressive strength results of SLMs at 1 and 28 days.
Type of Filler M F V M F V M F V
Matrix
sand content 18 18 18 9 9 9 4.5 4.5 4.5
M 18 0.000 0.000 0.000 0.000 0.000 0.000 0.000 0.000
F 18 0.000 0.900 0.766 0.015 0.594 0.045 0.062 0.000
V 18 0.000 0.900 0.099 0.000 0.044 0.600 0.681 0.000
Compressive M 9 0.000 0.766 0.099 0.629 1.000 0.001 0.001 0.000
strength at 1 F 9 0.000 0.015 0.000 0.629 0.695 0.000 0.000 0.000
day V 9 0.000 0.594 0.044 1.000 0.695 0.000 0.000 0.000
M 4.5 0.000 0.045 0.600 0.001 0.000 0.000 1.000 0.034
F 4.5 0.000 0.062 0.681 0.001 0.000 0.000 1.000 0.025
V 4.5 0.000 0.000 0.000 0.000 0.000 0.000 0.034 0.025
M 18 0.033 0.001 0.083 0.958 0.000 0.050 1.000 0.005
F 18 0.033 0.959 1.000 0.002 0.661 1.000 0.092 0.981
V 18 0.001 0.959 0.825 0.000 0.999 0.916 0.004 1.000
Compressive M 9 0.083 1.000 0.825 0.006 0.415 1.000 0.205 0.904
strength at 28 F 9 0.958 0.002 0.000 0.006 0.000 0.003 0.812 0.000
days V 9 0.000 0.661 0.999 0.415 0.000 0.553 0.001 0.999
M 4.5 0.050 1.000 0.916 1.000 0.003 0.553 0.132 0.958
F 4.5 1.000 0.092 0.004 0.205 0.812 0.001 0.132 0.016
V 4.5 0.005 0.981 1.000 0.904 0.000 0.999 0.958 0.016
Tables V and VI present the results obtained in the of magnitude, in accordance with the small variations in
analysis of variance (ANOVA) and Tukey test of compressive density in the hardened state recorded for the mortars [32].
strength results. The confidence interval considered was Although the results of dynamic modulus of elasticity were
95%. From the results of ANOVA, it was observed that similar, higher values were observed for SLMs developed
the crushed filler content had a significant influence on the with sands M and F. In most cases, lower values were
compressive strength of mortars only at 1 day, while the verified in SLMs with sand V. This was consistent with
type of sand had a significant influence on this property the lower compressive strengths at 28 days showed by
at 1 and 28 days. Based on the results of the Tukey test, it these mortars. According to Canbaz et al. [8], the particle
was possible to verify between which mortars there were shape of the aggregates also affects the compaction of the
statistically significant differences in compressive strength. mixture and consequently the modulus of elasticity and
Dynamic modulus of elasticity: the values of dynamic compressive strength. In this context, rounded particles
modulus of elasticity for the SLMs are shown in Fig. 7. provide a structure with higher compaction, resulting in a
It was seen that the results found were in the same order higher dynamic modulus of elasticity. However, from the185 T. P. Scolaro et al. / Cerâmica 67 (2021) 179-187
results found in this study, it was observed that when the
Capillary absorption (g/cm2)
aggregates had quite different particle sizes, the shape was 1.60
a less relevant factor. This may be verified from the higher 1.40
MF4.5
values of dynamic modulus found for SLMs with sand M
MF9
1.20 MF18
compared to SLMs with sand V; although sand V had grains,
in general, more rounded, it presented a narrower particle 1.00 FF4.5
FF9
size distribution. Furthermore, it was observed that the 0.80
FF18
modulus of elasticity decreased in formulations with higher 0.60 VF4.5
levels of crushed filler and lower levels of sand. Although 0.40 VF9
there were no strong correlations between aggregate volume
0.20 VF18
and dynamic modulus of elasticity, this may be explained by
0.00
the assumption that aggregates are generally more rigid than 0 100 200 300 400 500 600
paste [33]. However, as previously mentioned, the results Time (s0.5)
were similar.
Figure 8: Water capillary absorption of SLMs.
35
Table VII - Sorptivity of SLMs.
Dynamic modulus of
30
Mixture Sorptivity (g.cm-2.s-0.5)
elasticity (GPa)
25 MF4.5 3.01x10⁻³
20 MF9 2.72x10⁻³
15 MF18 2.15x10⁻³
10 FF4.5 1.40x10⁻³
5 FF9 1.76x10⁻³
0
FF18 1.33x10⁻³
VF4.5 2.16x10⁻³
.5
F9
8
5
9
18
5
9
18
F1
4.
FF
4.
VF
F4
FF
VF
M
FF
VF
VF9 2.33x10⁻³
M
M
Figure 7: Dynamic modulus of elasticity of SLMs. VF18 2.66x10⁻³
Water capillary absorption: the water capillary 0.000
absorption values as a function of the square root of time a) MF4.5
-0.025
are shown in Fig. 8 and the sorptivity values are shown
Shirinkage (%)
MF9
-0.050
in Table VII. Evaluating the absorption 72 h after the -0.075
MF18
contact of the specimens with water, SLMs with sands M -0.100
FF4.5
and V showed, respectively, capillary absorptions up to -0.125
FF9
32% and 20.9% higher than their analogs with sand F. The -0.150
FF18
increase in capillary absorption is a negative aspect from -0.175
VF4.5
the point of view of durability since the phenomenon -0.200
VF9
is one of the forms of aggressive agent transport.
VF18
-0.225
According to Benachour et al. [34], two stages may be 0 7 14 21 28
observed: the initial stage, corresponding to the filling Time (day)
of large capillary pores, and a second stage, associated 0.225
with the filling of small pores. In this context, SLMs
Shirinkage (%)
0.200 b)
with sands M and V seemed to have a bigger amount of 0.175
larger capillary pores when compared to SLMs with sand
0.150
0.125
F (which may also be verified by the higher values of 0.100
sorptivity in the initial stage in mortars with sands M and 0.075
0.050
V). As for the smaller capillary pores, SLMs with sand 0.025
F would have the largest amount of pores. In general, 0.000
3d 3 - 28d 28d
capillary absorption decreased with the increase in the Figure 9: Drying shrinkage of SLMs: a) shrinkage vs. time; and b)
crushed filler content, as verified by Kazmierczak et al. shrinkage values during different periods.
[32]. Capillary absorption is not only influenced by the
pore size, but also by capillary connectivity. Although Drying shrinkage: Fig. 9a shows the drying shrinkage
the differences in water absorption values by immersion measured over 28 days and Fig. 9b the shrinkage in each
(Table III) were not so notable, the fineness of the sand period. Fig. 9a shows that the drying shrinkage values
affected capillary absorption more significantly. increased up to 28 days in all mortars. More prominentT. P. Scolaro et al. / Cerâmica 67 (2021) 179-187 186
increases in shrinkage progress were observed up to 14 days. specific surface area resulting from the replacement of sand
From 14 to 28 days, increases in shrinkage values were still by filler. However, the results indicated that the increase in
observed, however, they were not so notable. In Fig. 9b it filler content up to 18% and 9% improved the initial strengths
may be seen that, in general, regarding the SLMs with the of mortars with sands M and F, respectively, and the drying
same filler content, the SLMs that showed the highest initial shrinkage values decreased with the increase in filler content
shrinkage, also showed the highest shrinkage at the end of the from 4.5% to 9% in self-leveling mortars with M, F and V
analyzed period. The SLMs developed with sand F showed (fineness modulus of 2.09, 1.23 and 0.58, respectively).
the lowest shrinkage at 28 days and those with sand V, the
largest. The highest shrinkage in SLMs with sand V possibly ACKNOWLEDGMENTS
occurred due to the fact that this aggregate had high fineness,
with a fineness modulus of 0.58 [35]. The small continuous The authors acknowledge the Central Laboratory of
grain size of this sand may also have contributed to higher Electronic Microscopy (LCME) for technical support. They
shrinkage values. Although sand M had larger grains and a would also like to acknowledge CAPES for the financial
more continuous particle size distribution (PSD) compared support and CNPq for funding the research scholarship.
to sand F, it had a high content of powdery (fine) material,
which may have contributed, in addition to the use of fines, REFERENCES
to the porous structure refinement. Besides that, SLMs with
sand M had a higher content of superplasticizer added, which, [1] K. Onishi, T.A. Bier, Cem. Concr. Res. 40 (2010) 1034.
according to Ma et al. [36], may increase drying shrinkage [2] S.A. Rizwan, T.A. Bier, Constr. Build. Mater. 27 (2012)
values. Superplasticizers may indirectly modify the water or 398.
cement content in the mixture and the combined effect of [3] J.F. Georgin, J. Ambroise, J. Péra, J.M. Reynouard, Cem.
these factors may lead to higher shrinkage values [30]. The Concr. Compos. 30 (2008) 769.
drying shrinkage values decreased with the increase in filler [4] T. Le-Bihan, J.F. Georgin, M. Michel, J. Ambroise, F.
content from 4.5% to 9% in mortars with sands M, F and V. Morestin, Cem. Concr. Res. 42 (2012) 1055.
This result was contrary to those of Kazmierczak et al. [32], [5] C.O. Schaefer, M. Cheriaf, J.C. Rocha, Materials 10
who reported an increase in drying shrinkage in rendering (2017) 958.
mortars with the increase of crushed aggregate filler content [6] L. Xu, N. Li, R. Wang, P. Wang, Constr. Build. Mater.
added. Despite that the drying shrinkage generally increases 163 (2018) 225.
with the increase in the paste volume [33, 37], it is believed [7] S. Zhang, X. Xu, S.A. Memon, Z. Dong, D. Li, H. Cui,
that when added in contents up to 9%, the filler used occupied Constr. Build. Mater. 167 (2018) 253.
the pores, contributing to the decrease of shrinkage [38]. [8] M. Canbaz, İ.B. Topçu, Ö. Ateşin, Constr. Build. Mater.
116 (2016) 321.
CONCLUSIONS [9] J. Yang, L. Liu, Q. Liao, J. Wu, J. Li, L. Zhang, Constr.
Build. Mater. 201 (2019) 401.
Based on the results obtained, it was observed that the [10] L. Yang, Y. Zhang, Y. Yan, J. Clean. Prod. 127 (2016)
powdery (fine) material content and sand grain shape and 204.
texture may influence the self-leveling mortars workability, [11] R. Jaafri, A. Aboulayt, S.Y. Alam, E. Roziere, A.
which was verified by the superplasticizer demand for the Loukili, Cem. Concr. Res. 120 (2019) 52.
same spreading diameter. About the properties in the hardened [12] Q. Wang, R. Jia, Constr. Build. Mater. 226 (2019) 11.
state, it was observed that the shape and texture of the grain [13] N.J. Katsiadramis, A.B. Sotiropoulou, Z.G.
did not seem to have much influence on the properties of Pandermarakis, EPJ Web Conf. 6 (2010) 23002.
self-leveling mortars when the particle size distribution was [14] B. Benabed, E.-H. Kadri, L. Azzouz, S. Kenai, Cem.
different between sands. The content of powdery material Concr. Compos. 34 (2012) 1167.
seemed to affect most notably properties in the fresh [15] B. Belhadj, M. Bederina, K. Benguettache, M.
state and shrinkage. The superplasticizer demand and the Queneudec, Adv. Concr. Constr. 2 (2014) 13.
dimensional change increased as the content of powdery [16] P.K. Mehta, P.J.M. Monteiro, Concrete microstructure,
material increased in the sand. From a practical point of properties and materials, McGraw-Hill (2014).
view, among the three evaluated sands, the use of sand F [17] M. Dobiszewska, A.K. Schindler, W. Pichór, Constr.
(with the lowest fineness modulus) was more feasible due Build. Mater. 177 (2018) 222.
to the better surface aspect of self-leveling mortars (smooth [18] ABNT NBR 16697, “Cimento Portland: requisitos”,
surface) and less superplasticizer demand to achieve the Ass. Bras. Norm. Técn., Rio Janeiro (2018).
desired spreading diameter. Furthermore, the employment [19] ASTM C150, “Standard specification for Portland
of sand F in self-leveling mortars provided good mechanical cement”, Am. Soc. Test. Mater. (2020).
performance and the lowest drying shrinkage among the [20] ABNT NBR 7389-1, “Agregados: análise petrográfica
mortars evaluated. Regarding the crushed basalt filler, do agregado para concreto-parte 1: agregado miúdo”, Ass.
self-leveling mortars with higher filler contents demanded Bras. Norm. Técn., Rio Janeiro (2009).
higher amounts of superplasticizer, due to the increase in the [21] ABNT NBR 16541, “Argamassa para assentamento e187 T. P. Scolaro et al. / Cerâmica 67 (2021) 179-187 revestimento de paredes e tetos: preparo da mistura para a [28] ASTM C1708, “Standard test methods for self-leveling realização de ensaios”, Ass. Bras. Norm. Técn., Rio Janeiro mortars containing hydraulic cements”, Am. Soc. Test. (2016). Mater. (2016). [22] G. Barluenga, F. Hernández-Olivares, Constr. Build. [29] B. Felekoğlu, Constr. Build. Mater. 22 (2008) 646. Mater. 24 (2010) 1601. [30] A.M. Neville, J.J. Brooks, Concrete technology, [23] ABNT NBR 13280, “Argamassa para assentamento e Bookman (2013). revestimento de paredes e tetos: determinação da densidade [31] P. Lawrence, M. Cyr, E. Ringot, Cem. Concr. Res. 35 de massa aparente no estado endurecido”, Ass. Bras. Norm. (2005) 1092. Técn., Rio Janeiro (2005). [32] C.S. Kazmierczak, M. Rosa, D.C.M. Arnold, Amb. [24] ABNT NBR 9778, “Argamassa e concreto endurecidos: Constr. 16 (2016) 7. determinação da absorção de água, índice de vazios e massa [33] E. Rozière, S. Granger, P. Turcry, A. Loukili, Cem. específica”, Ass. Bras. Norm. Técn., Rio Janeiro (2009). Concr. Compos. 29 (2007) 626. [25] ABNT NBR 13279, “Argamassa para assentamento e [34] Y. Benachour, C.A. Davy, F. Skoczylas, H. Houari, revestimento de paredes e tetos: determinação da resistência Cem. Concr. Res. 38 (2008) 727. à tração na flexão e à compressão”, Ass. Bras. Norm. Técn., [35] A. Belferrag, A. Kriker, S. Abboudi, S. Tié Bi, J. Clean. Rio Janeiro (2005). Prod. 112 (2016) 3048. [26] ABNT NBR 15630, “Argamassa para assentamento e [36] B. Ma, X. Wang, W. Liang, X. Li, Z. He, Constr. Build. revestimento de paredes e tetos: determinação do módulo Mater. 21 (2007) 2017. de elasticidade dinâmico através da propagação de onda [37] B. Bissonnette, P. Pierre, M. Pigeon, Cem. Concr. Res. ultrassônica”, Ass. Bras. Norm. Técn., Rio Janeiro (2009). 29 (1999) 1655. [27] ABNT NBR 9779, “Argamassa e concreto endurecidos: [38] A. Itim, K. Ezziane, E.-H. Kadri, Constr. Build. Mater. determinação da absorção de água por capilaridade”, Ass. 25 (2011) 3603. Bras. Norm. Técn., Rio Janeiro (2013). (Rec. 14/08/2020, Rev. 12/11/2020, Ac. 12/12/2020)
You can also read