Kohupātiki Marae - Ngati Hori TANK July 2017 - Ravensdown
←
→
Page content transcription
If your browser does not render page correctly, please read the page content below
Kohupātiki Marae

              Ngati Hori
                 TANK
                July 2017
Ngati Hori Freshwater Management Plan 2009/12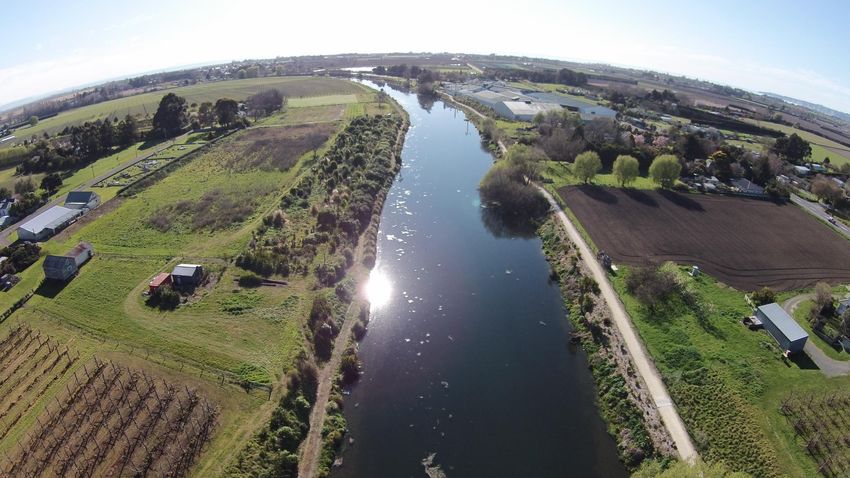
Whakapapa Kaitiakitanga Ngati Hori
Te Tahatu o te Rangi m Hikitanga Te Rangi
                                                          Te Poa Tuhaha m Anateira

 Te Whakawhirinaki m Te Pakaru o te                     Ngamihi Te Kehu m Charles
               Rangi                                               Chadwick
       Te Koari m Te Uhu                             Te Hore Ngarangi m Erena Rapana Te Tuku
                                                        Kaitiaki Tohunga o te Awa

Te Hoerakau                 Ahere Te Koari                 Hararutu m Wiremu Teo Paipa
 m Raukawa                 m Marara Nukai                               Kaitiaki Tohunga o te Awa
    Pohe
        Ngapu o te Rangi
            m Paru                           Te Pakaru
                  Ramarihitakatoaawanga      o te rangi           Wakatakahia
                    m Horomona Kahui
         Mita                                      Te Oiroa
         Ngapu                                       Parehuia           Akata m Tame McGuire
                            Raihania Kahui                          Kai Rangahau Kaitiaki Tohunga o te Awa

       Hararutu                                            Akinehi
                                                            (Aki)    Ann Ramarihi Takatoawanga

         Te Haumihiata                                     Kaitiaki No te Rangatahi Puawaitanga
                                                          Whakahoutia
                                                                              Moko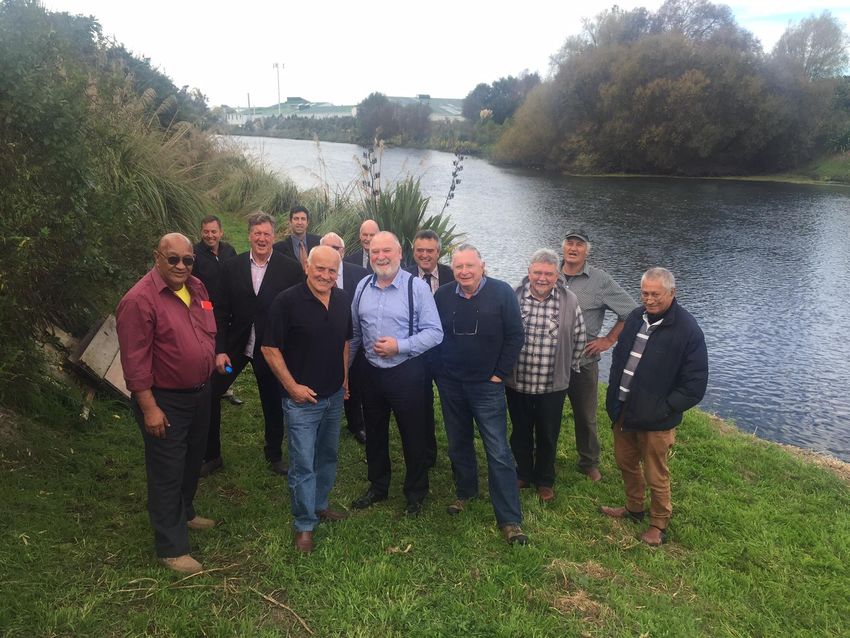
“Matauranga Māori”
                               “Observation over time”
Our plan is based around the following priorities of Ngāti Hori in freshwater:

                           =    Achieving sufficient water flow
                                =    Improving water quality
      =    Protection and restoration of traditional riparian vegetation
              =    Protection and restoration of fish and fish habitat

   To m a i n t a i n o u r p h y s i c a l , m e n t a l , e m o t i o n a l , s p i r i t u a l &
                            p s yc h o l o g i c a l we l l b e i n g

  “Information is not knowledge, knowledge is
 only arrived at through direct experience” Einstein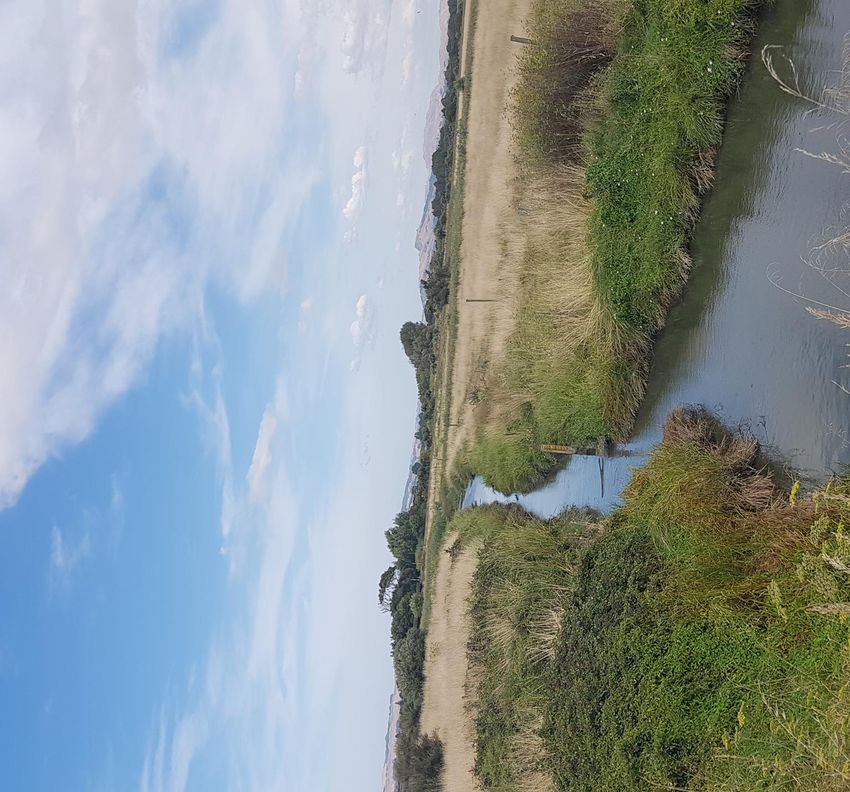
PĀKOWHAI

 RUAHĀPIA

            KOHUPĀTIKI
TE KARAMŪ
                                                                                WAITANGI

                                                                          WAIPUREKU

                                             MATAHIWI

                                                                     TUKITUKI

                     Ngati Hori Freshwater Management Plan 2009/12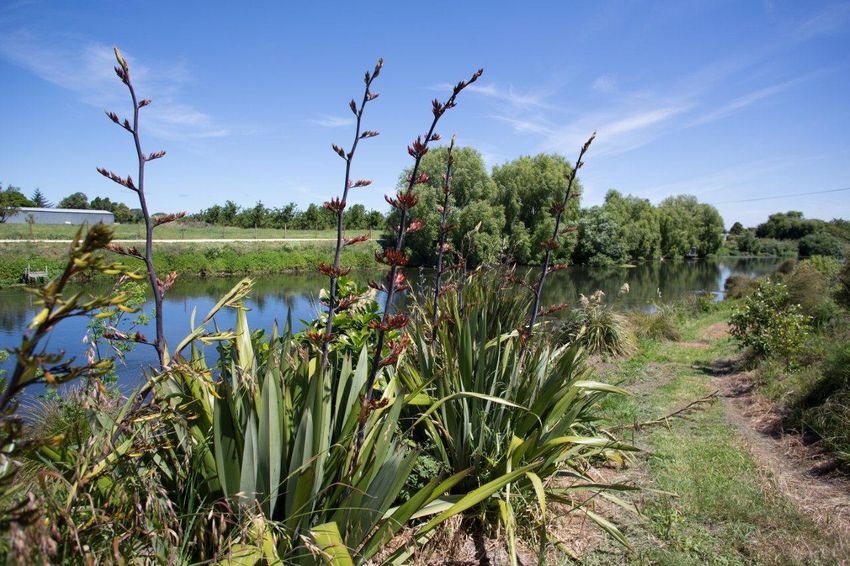
Ngaruroro – Karamū
                                         Kohupātiki Marae
       Te Aranga Marae
                                                   Matahiwi
                                                   Marae
                                  Ruahapia Marae

                                Waipatu Marae

Mangaroa Marae
   Korongata Marae

                             Heretaunga Ararau

             Mihiroa Marae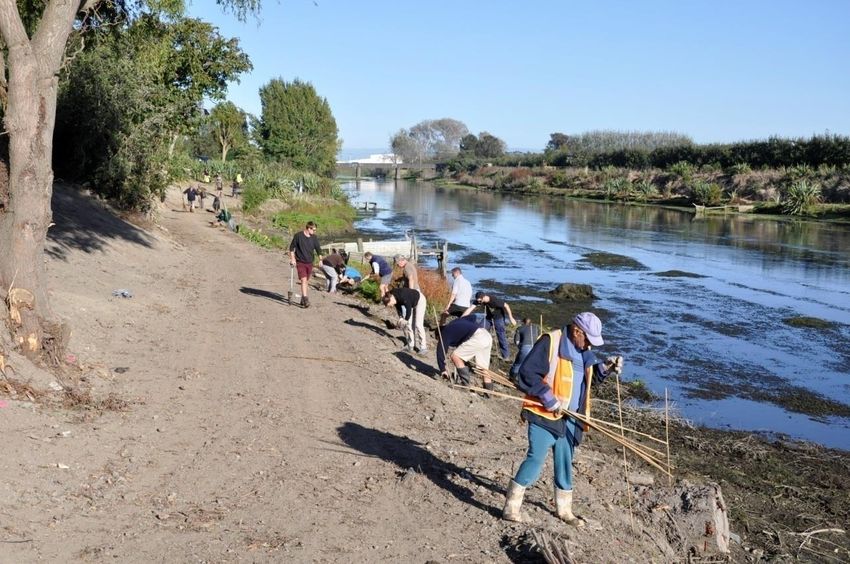
Pākowhai Park Concept Plan
Whakatū Landscape & Awa
   Enhancement Plan

Second Phase Cycle Path Whakatu

“ As a human family, we must
decide, will we be selfish, short-
   sighted or co-operative &
          visionary?”
               Severn Cullis-Suzuki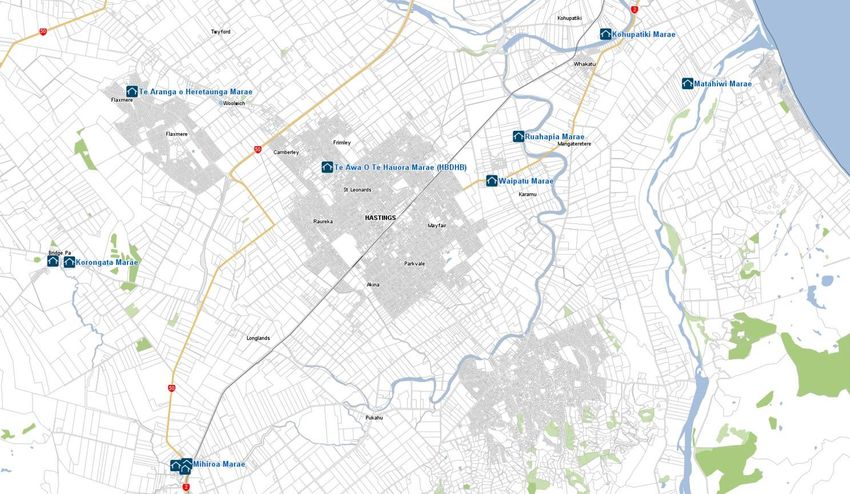
“Change is imminent, the most powerful thing we can do is to build a
                     beautiful path forward.”
                                          Severn Cullis-Suzuki, Haida Gwai
OTANENUIARANGI PĀ
Ngati Hori Freshwater Management Plan 2009/12
Waitangi Estuary Concept Plan

Ngāti Hori Freshwater Management Plan 2009/12
Waitangi Celestial Star
      Compass
NGĀ MIHI
KI A KOUTOU KATOA
Lisa McGlinchy
Pa McGowan
Department of Conservation
Enviroschools HB
Fish & Game
Forest & Bird
Guardians of HB Fisheries
Dr Mike Joy, Massey University
Ngā Kaitiaki o te Awa a Ngaruroro
Ngā Whenua Rāhui
Ngā Kura O Clive me Haumoana me
Mangateretere me Te Ara Hau
Te Kohanga Reo O Whakatu
Lindisfarne Collage
Naiper Boys High
Peterhead Kura
Hastings District Council
Hawke’s Bay Regional Council
Hawke’s Bay District Health Board
Ngāti Kahungunu Iwi Inc
Surveying the Bay
Te Taiwhenua o Heretaunga
Whakatū Community
Whakatū Industry
Whānau, Friends & NeighboursMatauranga Maori
WAI Māori priorities for Ngāti Hori
Achieving sufficient water flow
Improving water quality
Protection and restoration of traditional riparian vegetation
Protection and restoration of fish and fish habitat
To maintain our physical, mental, emotional, spiritual &
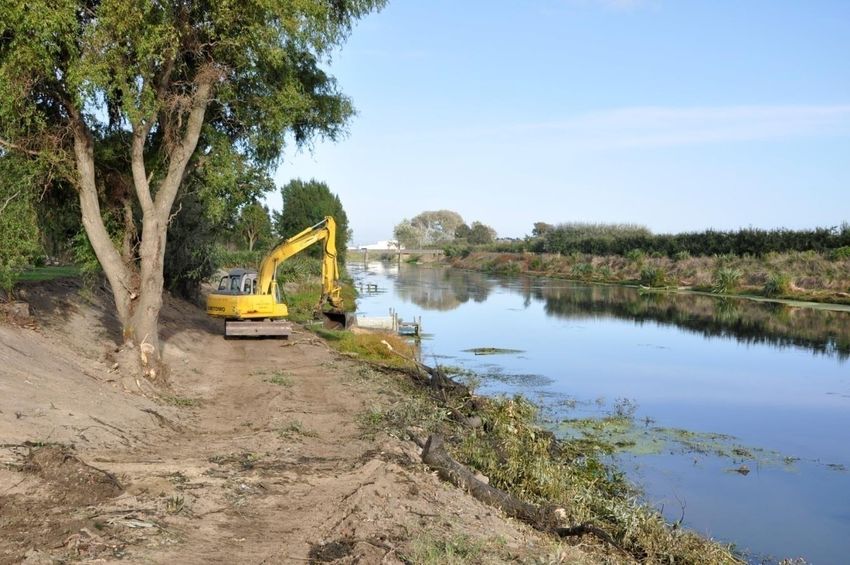
psychological wellbeingEXCESIVE WEED GROWTH SEDEMENT
The Awa degraded
“You wont change things by fighting the existing. To change something
build a new model that makes the existing model obsolete.”
Buckminster Fuller
INDUSTRIAL STORM WATER
TANK ISSUESWHERE TO FROM HERE?
• Water quality
• Endemic fresh water fish Species
• Water flow
Will we be creative, inovative or
STATUS QUO
ASK YOURSELF?
Ngati Hori Freshwater Management Plan 2009/12Kohupatiki Marae Wai Maori, Wai ora, Nau Mai Haere Mai “Tihei Mauri Ora”
Summary of Baseline     Dr Ngaire Phillips
  Technical Report    Technical Focus Group
Ravensdown Napier           Meeting
   Reconsenting
                        Kohupātiki Marae
                          18 May 2021
Water quality and ecology
team
Dr Ngaire Phillips1, Dr Mike Stewart1,
Dr Sharon DeLuca2,
Team leader, Water Environmental
Marine Ecology
quality, ecotoxicology Chemistry
1Streamlined Environmental
2 Boffa Miskell
3 Wai Kokopu Consulting
Kendall Leitch1, 2, Dr Rebecca Eivers1, 3,
Technical support Technical supportPurpose of
presentation
• Provide a brief background
of the study area
• Address some key
questions based on our
technical investigations
• Answer any questions you
may have on the Technical
Report Ravensdown settling
pondReceiving environment/background
information • Site stormwater discharged via settling
Ravensdow pond to Ravensdown and Awatoto
n Napier
Drains.
• Ultimate receiving environment is
Waitangi Tūtaekūri River and Waitangi Estuary –
Drain
identified as outstanding waterbodies
Settling (Plan Change 7).
Mission Awatoto pond
Drain Drain Ravensdow
n Drain
• Upstream catchments input
Mixing
Zone contaminants via the Mission and
Tūtaekurī Waitangi Drains and comprise a
Blind Arm
mixture of agriculture, commercial,
industrial and urban landuses.
Tūtaekurī River
• Council operated pump controls
upstream flows through stop bank to
Ngaruroro River
Waitangi Estuary Awatoto Drain.Focus of our investigations • Discharge and receiving environment water quality • Potential risk of process chemicals • Potential effects on downstream receiving environment
What is the current quality of
   the discharge and the
  receiving environment?
Water quality
monitoring programme
• Compliance water quality monitoring
                                                Ravensdow
  defined by resource consent                    n Napier

    • Weekly discharge (condition 5b)

    • Monthly ambient receiving
      environment (condition 5c and 6h)

    • 6-monthly rainfall receiving
      environment (condition 6i)

 Key
 Red stars are ambient (AS) and rainfall
 (SWS) sampling sites.
 Blue stars are rainfall only sampling sites.
Discharge quality – Compliance
• Very high level of compliance with consent
conditions for discharge flow (100%), pH (94%),
Total Suspended Solids (TSS) (100%), and fluoride
(100%).
Source: Death &
• Very high compliance has also generally been
Ekelund (2019)
observed for Soluble Reactive Phosphorus
(SRP) and Total Phosphorus (TP) limits,
excluding 2013 – 2014 (TP) and 2017-2018
(SRP)Receiving environment quality (based on 2013 and
2019 data)
Metals/metalloids
• Nickel below guideline
• Under ambient conditions, nickel, copper
• Aluminium exceeds guideline at
and aluminium elevated in mixing zone and
upstream sites also
some sites further downstream
• Copper just exceeds guideline
downstream
• Sources other than the Ravensdown
• Some metal concentrations high (or higher) at
discharge contributing to
upstream sites under ambient conditions e.g.
cadmium, zinc. downstream concentrations of these
metals.
• Under wet weather conditions, cadmium,
fluoride and sulphur elevated in mixing zone.
• Only cadmium exceeds guideline.Receiving environment quality - (based on 2013 and
2019 data)
Nutrients and other parameters
• Under ambient conditions, all
• Guidelines exceeded upstream as
nutrient concentrations other than
well as in mixing zone and
nitrate are comparable upstream
downstream
and downstream
• Under wet weather conditions, • But guidelines are still exceeded
mixing zone nutrient concentrations upstream as well as in mixing
elevated compared to upstream zone and downstreamWhat changes have there
been over time in discharge
and receiving environment
water quality?Discharge quality – summary of trends (2007 –
Meaningful trend =2020)
statistically significant and
with greater than 1% change per year.
Ke ➔
y
Significant but Meaningful MeaningfulMeaningful trend AS1 S F ~ Al
Not meaningful (indicative only)
~ No change in trend
S F Al AS2
Receiving Environment Waitangi Drain
Ambient monitoring (2012 – 2020) S F Al AS3
Metals/metalloids S F Al ~
AS4 Ravensdown
Discharge
Awatoto Drain
Mixing Zone
AS5 S F ~ Al
AS6
S F ~ Al
S ~ F ~ Al ~
AS7Meaningful trend AS1 TN, NH4-N, NO3-N,
NO2-N+NO3-N,
Not meaningful (indicative only) SRP, TP (all )
~ No change in trend
SRP TP
TN, NH4-N, NO3-N, AS2
NO2-N+NO3-N (all )
Receiving Environment Waitangi Drain
SRP TP
Ambient monitoring (2012 – 2020) TN, NH4-N, NO3-N,
NO2-N+NO3-N (all ) AS3
TN, NH4-N, NO3-N,
Nutrients NO2-N+NO3-N,
SRP, TP (all ) AS4 Ravensdown
Discharge
Awatoto Drain
Mixing Zone
AS5 TN, NH4-N, NO3-N,
AS6 NO2-N+NO3-N,
SRP, TP (all )
TN, NH4-N, NO3-N,
NO2-N+NO3-N,
TN NH4-N, NO3-N, SRP, TP (all )
NO2-N+NO3-N,
AS7
SRP, TP (all ~ )Meaningful trend SWS1 F
Not meaningful (indicative only)
~ No change in trend
F SWS2
Waitangi Drain
F SWS3
Receiving Environment
F SWS4
Rainfall monitoring (2014 – 2019) F SWS5
F
SWS6
Metals/metalloids F SWS7
SWS8
Ravensdown
Discharge
F Awatoto Drain
Mixing Zone SWS9
SWS1
0 F
F
SWS1
1 F~Meaningful trend SWS1 NH4-N
Not meaningful (indicative only)
~ No change in trend
NH4-N SWS2
Waitangi Drain
Receiving Environment NH4-N SWS3
Rainfall monitoring (2014 – 2019) NH4-N SWS4
SWS5
NH4-N
Nutrients SWS6
NH4-N
NH4-N SWS7 Ravensdown
Discharge
SWS8
Awatoto Drain
NH4-N
Mixing Zone
SWS9
SWS10
NH4-N
NH4-N
SWS11 NH4-N ~How much dilution of the
discharge occurs in the Receiving
Environment?Mixing Zone Dye
Study
• Added Rhodamine dye (red) to
discharge at high and low tide
• Collected water samples at 7
locations between discharge point
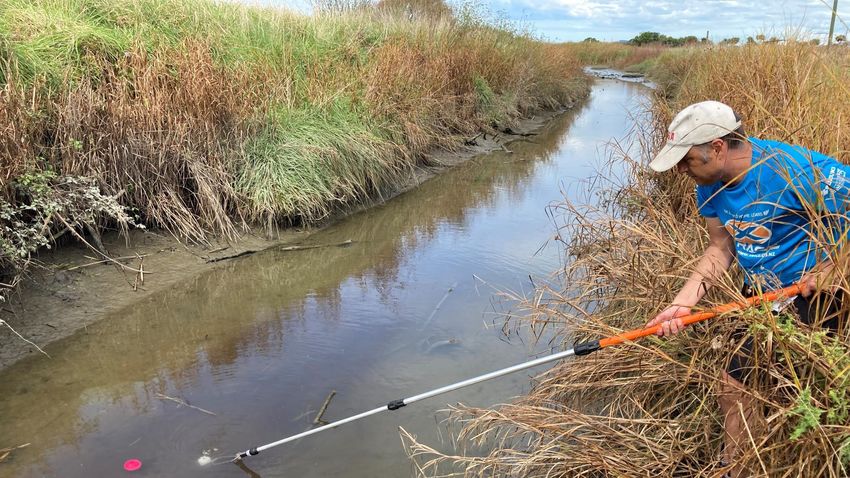
and boundary of mixing zoneDye study results – Low Tide
20 Run 1
15
Dilution
Run 2
10 3.0
2.5
5 2.0
Dilution
1.5
0
Increasing Distance and Time since 1.0
discharge 0.5
0.0
Increasing Distance and Time since
dischargeDye study results – High Tide
Run 1
80
60
Dilution
40 120 Run 2
100
20
80
Dilution
0 60
Increasing Distance and Time since 40
Surface Run 1discharge
Sub-Surface Run 1 20
0
Increasing Distance and Time since
Surface Run 2discharge
Sub-Surface Run 2What is the Risk of Effects from
Process Chemicals?Risk Assessment of Process Chemicals
• Ravensdown use nine
process chemicals as part of
the operation of the plant.
• Process chemicals are not
required to be measured in
discharge or receiving
environment
• Use chemical and
ecotoxicological properties
to assess potential risk.
Assumes all the chemicals enter the settling
Highly conservative method pond, with no degradation or evaporation.
Also assumes lowest dilution from dye study.Summary of ecological risk for process chemicals
• Under low tide, potential elevated risks
for the majority of the process chemicals
Will their use increase the
• Under high tide, potential elevated risk of
risk of ecological impacts?
6 process chemicals, however risks much
lower than under lower tide and as most
readily biodegradable, effects considered
unlikely
Would any process • None of the chemicals in the formulations
chemical bioaccumulate? are likely to bioaccumulate.Is the discharge impacting the
downstream marine
environment?Effluent Toxicity
Testing
• Whole Effluent Toxicity testing is undertaken every 4
years on 3 species
• Sample also analysed for some nutrients and metals,
as well as pH
• Compliance = no significant toxicity to any test
species at a dilution of no more than 100:1.
• Toxicity Test results (2014, 2019 and 2020) fully
compliant on all occasions.
• 2020 results – dilutionsAre dilutions in receiving environment sufficient
to minimize risk of toxicity from discharge?
Dilutions during Dilutions during Dilutions
From March
low tide high tide sometimes much
2021 dye study
1: 1.7 – 1: 17.8 1: 2.1 – 1: 113.6 less than 100:1
Ecotoxicity tests show no
Are there likely to be toxicity at much lower than
toxic effects from the 100:1 dilution but tidal
discharge? phase may be important
Need to consider multiple lines of evidenceMarine Ecology Monitoring Programme
• 4 yearly monitoring of the
receiving environment ecology Ravensdown
(Condition 6) discharge
• benthic macrofauna
• fish (not surveyed in 2020)
• periphyton and macrophytes
• sediment health and
potential for metal
accumulation
July 2020 Survey sites
RAV1-2 = Ravensdown Drain, AWA1-3 = Awatoto Drain, TUT1-2 = Tutaekuri Blind
Arm, NGA = reference siteDiversity measures
Average number of taxa per site Average Shannon-Wiener Diversity Index Score per site
Impacts likely within mixing zone and potentially beyond the boundary but recovery
with distance downstream.What other influences on faunal composition?
Average abundance of main taxonomic groups Percent of sediment grain size in each category
• Coarser grain size within mixing zone may be contributing to lower
abundance and diversity.
• Also sites in the Ravensdown and Awatoto Drain show some influence of
freshwater.Overall conclusions from technical
investigations
Discharge quality • High level of compliance for most discharge parameters
Receiving environment quality
• Some water quality parameters are elevated downstream
Monitored parameters
of the discharge during rainfall events and exceed
guidelines
Process chemicals
• Based on worst case, some process chemicals present a
potential risk, particularly at low tide
Ecological effects
• The discharge consistently shows no toxicity in laboratory
Ecotoxicity tests at the compliance level of 100:1 dilution
• Potential effects may be tidally influenced
Marine ecology • Marine benthic communities are likely to be impacted by
the discharge within the mixing zone. However there is
little evidence of effects beyond the mixing zone
Overall effects • Using a weight of evidence approach, the overall effects
from the current discharge are likely to be minorAir Discharges Ravensdown Napier May 2021
Purpose of presentation

• Background on how air
  quality effects are
  assessed
  - The site and
    contaminants discharged
    to air
  - How effects are assessed
  - Data reviewed
  - The receiving
    environment (where we
    assessed)
  - Overall conclusions
Site overview
Manufacturing
plant
Acid plant
Rock Store and
Super Store Sulphur Store
& MelterWhat’s discharged
PM10 and PM2.5
Dust Odour
• Manufacturing Plant
• Manufacturing plant and
• Manufacturing Plant & handling • Heath sulphur melter
• Nuisance • Nuisance
Fluoride
• Manufacturing plant Sulphur dioxide & acid mist
• Plants and frosting windows
• Acid plant
• Health and plantsHow air discharges are assessed?
• Follow Ministry for the
Environment Guidance
• Dispersion modelling to predict
levels in receiving environment
• Measuring concentrations
in ambient air
• Guidelines &
standards for
human health &
ecosystems
• Conservative – maximum Background
emission rates and worst case air quality
meteorologyData review
• Ambient monitoring data
- Direct measurement of
• Stack emissions concentrations in air
measurements - Can compare directly to Air
Quality Guidelines and
- Acid and manufacturing Standards
plant stacks
- Particulate matter (PM10,
- Values to go into the PM2.5), Sulphur dioxide
dispersion model (SO2), Fluoride (F) and
• Wind data Hydrogen Sulphide (H2S)
- Used as input to dispersion
model
- Analysis of ambient
monitoring data to identify
where peak concentrations
come fromWhere winds blow from
Receiving environment

• Identify sensitive
  locations
  - Community
  - Agricultural/ecosystems
• Establish background
  concentrations (i.e.
  levels with out the site)
  - From review of ambient
    monitoring data
  - Published data and
    guidelines
Overall conclusions
• SO2 exposure within health • Results feed into:
& ecosystem - Human health Impact
standards/guidelines Assessment
• New Manufacturing Plant - Ecological Assessment
(Fluoride and SO2
stack will reduce fluoride discharges)
within ecosystem guidelines
• PM10 & PM2.5 levels within
health guidelines/standards
where people may be
exposed
• Odour and dust levels
acceptable given location
and separation to sensitive
receiversReconsenting of Ravensdown Napier Works: Technical
Focus Group 18 May 2021
Dr Francesca Kelly
Public Health Physician, Environmental Medicine Limited
Environmental Health Effects Assessment in preparation for Ravensdown Ltd, Napier Manufacturing Works
Community Characterisation
Hazard Identification
Health effects associated with hazards (dose-response)
Exposure Assessment
Risk Characterisation
(Relevant health-based guidelines)
Assess public health risk
Human Health Aspects of Spray Treatment for PAM April, 60
2004Approach taken in assessment:
• Discharges are sources of potential exposure to hazards (pollutants)
• Risk relates to amounts and duration of exposure
• Routes of exposure considered:
▪ Inhalation of pollutants in ambient air;
▪ Drinking water sources, roof supply;
▪ Other exposures from human contact with the environment - coastal
recreation including estuary;
▪ Local food sources including wild harvesting.
61Expert review guidance
documents
• AMBIENT AIR:
▪ The World Health Organisation (WHO) expert review reports for
ambient air quality and air pollution policies (WHO 2000; 2006; 2013)
include protection of those who may be more vulnerable to adverse
health effects because of age or health difficulties. Therefore these
guidelines are conservative and protective.
• WATER and FOOD:
▪ WHO, Food and Agriculture Organisation (FAO) and European Food
Safety Authority (EFSA) provide assessments for food contamination
guidelines based on lifetime exposure and include infants.
▪ To assess health effects, both epidemiological and toxicological
information is used, tailored to the hazard exposure.
62Community characterisation
• Cultural community characterisation has been adopted from the Regulatory
Assessment. Consultation is expected to inform this.
• Residential communities have been identified as sensitive to potential
human health effects through air discharges. The location for potential
effects are assessed in the Air Report.
• Recreational use at the beach 150 m to the east of the site, and associated
car park.
• Recreational water use and kai harvesting at the coast and in the estuary.
63The central area of air effects assessment
▪ Health effects assessment
looks also outside the
modelling zones eg schools,
marae, residential homes and
elder care
▪ However the exposures
further away will be less in
amount and frequency with
lower risk
64The locational area for water discharge effects
assessment
65Hazards in air discharges
• Particulate
▪ PM10, traditionally monitored and in the National Environmental
Standard (NES)
▪ PM2.5, a smaller size of particulate associated with health effects
▪ Depositable “dust” and fugitives from despatch, stores, materials
delivery
• Sulphur dioxide
• Sulphur trioxide/”acid mist”
• Hydrogen sulphide (assessed for odour effects)
• Fluorides
66Human intake of fluoride
• Food and water are the main source of daily fluoride for humans.
• 2 to 4 mg/day normative in adults with “world diet” (WHO, Environmental
Health Criteria 227, Fluorides, 2002 ).
• Fluoride is generally regarded as a desirable nutrient for child dental health.
• Beverage and food (cooking water) contribution to daily fluoride is
influenced by concentration in water supplies.
• Inhalation can add a minor amount to fluoride exposure, estimated 0.02
mg/day for an adult living in proximity, using worst case air assessment
modelling.
67Risk from air discharges
• Particulate
▪ PM10, traditionally monitored and in NES, past monitoring shows sporadic
exceedances of 24-hour standard. Minor health effects.
▪ PM2.5, monitoring data shows no exceedances of annual average guideline (10
µg/m³). Less than minor health effects.
▪ Monitoring data includes spikes from fires and restarts
• Sulphur dioxide less than minor effects for health, NES compliance shown in Air
Report, normal operations, includes worst case dispersion conditions.
• Sulphur trioxide/”acid mist” releases, prevented by operational processes
• Hydrogen sulphide less than minor effects for health
• Fluorides less than minor health effects from inhalation, very low exposure
68Finding out the issues for health effects
• Technical assessment of effects risk from hazards
• Use of evidence-based guidelines for comparison
• Contemporary health issues
• Voiced local concerns
• Active consultation including health representatives (District Health Board,
Regional Council)
• Active consultation with community representatives including wild food
harvesters
69You can also read