Determining the Effect of Extreme Weather Events on Human Participation in Recreation and Tourism: A Case Study of the Toronto Zoo - atmosphere
←
→
Page content transcription
If your browser does not render page correctly, please read the page content below
atmosphere
Article
Determining the Effect of Extreme Weather Events on
Human Participation in Recreation and Tourism:
A Case Study of the Toronto Zoo
Micah J. Hewer
 Department of Physical and Environmental Sciences, University of Toronto at Scarborough, Toronto,
 ON M1C 1A4, Canada; micah.hewer@utoronto.ca

 Received: 20 December 2019; Accepted: 8 January 2020; Published: 15 January 2020

 Abstract: This study devises a novel approach for defining extreme weather events and assessing
 their effects on human participation in recreation and tourism, based on a case study of attendance at
 the Toronto Zoo (Toronto, ON, Canada). Daily zoo attendance data from 1999 to 2018 was obtained
 and analyzed in connection with daily weather data from local weather stations for the maximum
 temperature, minimum temperature, total precipitation, and maximum wind speed. The “climatic
 distance” method, used for evaluating representative weather stations for case studies in applied
 climatology, was employed to rank and select surrounding weather stations that most accurately
 captured daily weather observations recorded at the Toronto Zoo from 1990 to 1992. Extreme weather
 events can be defined as lying in the outermost (most unusual) 10 percent of a place’s history. Using
 this definition as the foundation, a percentile approach was developed to identify and assess the
 effects of extreme weather events across the following thresholds: the 99th percentile, the 95th
 percentile, and the 90th percentile, as well as less than the 1st percentile, less than the 5th percentile,
 and less than the 10th percentile. Additionally, revealed, theoretical, and binary thresholds were also
 assessed to verify their merit and determine their effects, and were compared to the extreme weather
 events defined by the percentiles approach. Overall, extreme daily weather events had statistically
 significant negative effects on zoo attendance in Toronto, apart from a few cases, such as the positive
 effect of usually warm daytime temperatures in the winter and usually cool nighttime temperatures
 in the summer. The most influential weather event across all seasons was extremely hot temperatures,
 which has important implications for climate change impact assessments.

 Keywords: extreme weather events; tourism; recreation; participation; attendance; zoos and
 aquariums; climate change

1. Introduction
     Tourism climatology is the study of the relationship between recreation and tourism and weather
and climate [1–3]. Within the context of tourism climatology, zoos and aquariums have only recently
been assessed regarding the weather sensitivity and climate change vulnerability of this type of
recreation and tourism activity. The first study to look at the weather sensitivity of zoo attendance and
assess climate change impacts was conducted by Aylen [4], who looked at Chester Zoo in the United
Kingdom. Following this, Hewer and Gough [5] assessed the weather sensitivity of attendance at
the Toronto Zoo in Canada, and then conducted a follow-up climate change impact assessment [6].
Both Aylen et al. [4] and Hewer and Gough [5] used a revealed preferences approach including
multiple weather variables to create predictive weather sensitivity models. The next series of tourism
climatology papers that focused on zoo attendance emerged from the United States, looking at thermal
comfort for the Phoenix and Atlanta zoos [7], as well as the effect of synoptic weather systems for the

Atmosphere 2020, 11, 99; doi:10.3390/atmos11010099                          www.mdpi.com/journal/atmosphere
Atmosphere 2020, 11, 99 2 of 17
Atlanta and Indianapolis zoos [8]. Another tourism climatology paper that examined zoo attendance
was conducted by Hewer and Gough [9], which looked at the effect of seasonal climatic anomalies on
attendance at the Toronto Zoo (Toronto, ON, Canada). Interestingly, both the Pekins and Debbage [7]
and the Hewer and Gough [9] papers were published as part of the last special issue on tourism
climatology in the MDPI journal Atmosphere. Most recently, Su and Lin [10] used a regression
modeling approach similar to the work of Aylen et al. [4] and Hewer and Gough [5] to explore the
weather sensitivity of zoo attendance at the Taipei Zoo in Taiwan. With only seven studies to date,
zoos and aquariums have only begun to be studied in the context of tourism climatology. Despite
findings suggesting that zoo and aquarium attendance is highly sensitive to weather and climate
variability, other activities, such as visiting parks and protected areas, have received much more
attention internationally within the tourism climatology literature [11–25].
Tourism climatology, which involves both the study of weather sensitivity and an assessment
of climate change impacts, has been a growing field of study since the 1970s [26,27]. More recently,
there have been calls for tourism climatology research that considers the effects of extreme weather
events on human participation in recreation and tourism [28,29]; however, no known study to date
has responded to these calls. Furthermore, there has been difficulty in the broader climatology
and meteorology literature in terms of defining what constitutes an extreme weather event [30,31].
However, the United States National Centers for Environmental Information (NCEI), a division of
the National Oceanic and Atmospheric Administration (NOAA) [32], has put forward the following
definition: “extreme events are defined as lying in the outermost (most unusual) 10 percent of a place’s
history”. The current study uses this definition as a foundation to devise a method for identifying
extreme weather events from within the observational climate record (daily weather station data)
and determining their effect on human participation in recreation and tourism, based on attendance
data from the Toronto Zoo (1999 to 2018). This study will further contribute to understanding the
relationship between the weather and climate and zoo attendance, while also establishing a novel
method for addressing the need for tourism climatology research that studies the effect of extreme
weather events on human participation in recreation and tourism.
Within the tourism climatology literature that has focused on attendance at zoos and aquariums,
several non-climatic factors have been identified as influencing human participation. For example,
weekends and holidays have been clearly shown to be associated with increased zoo attendance, both
in Toronto [5,6] and in the United Kingdom [4]. Time, which is often a proxy for population growth and
zoo expansion, has also been shown to result in increased zoo attendance in Toronto [5,6], the UK [4],
and Taiwan [10]. Furthermore, previous studies in Toronto [9] and Taiwan [10] have also identified
the positive effect of “animal stars” and other special attractions on zoo attendance, along with the
negative effect of external events, such as disease epidemics, political instability, and competing
events. It is therefore important to consider the potentially confounding effects of non-climatic factors
in any tourism climatology study which examines the effects of weather and climate variability on
human participation.
2. Methods and Materials
The Toronto Zoo in Ontario, Canada, was selected for this case study on tourism climatology.
This was a convenient sample given that the researcher already possessed daily zoo attendance data
from 1999 to 2015. However, after working out the methods for this study, the zoo was contacted once
again, and an updated data set was retrieved, allowing the study to consider 20 years of the most
recent daily zoo attendance data (1 January 1999 to 31 December 2018). The Toronto Zoo is also the
largest zoo in Canada and the 5th largest zoo worldwide, making it an important zoo to study, while
also enabling generalization of the results for other zoos in similar climates.
Daily weather data from 1999 to 2018 was retrieved from Environmental Canada’s historical
climate data archive. In this regard, local weather station data was used. However, there are numerous
weather stations with applicable data in proximity to the zoo and weather data was also collected byAtmosphere 2020, 11, 99 3 of 17
Atmosphere 2020, 11, x FORCanada
an old Environment PEER REVIEW
weather 3 of 17
station (Metro Zoo) that was in operation on the zoo property
itself, from 1977 to 1992. Previous tourism climatology studies focusing on the Toronto Zoo have all
Zoo have all used different weather stations for data acquisition. Initially, Hewer and Gough [5]
used different weather stations for data acquisition. Initially, Hewer and Gough [5] established the
established the weather sensitivity of zoo attendance (based on data from 1999 to 2014) and retrieved
weather sensitivity of zoo attendance (based on data from 1999 to 2014) and retrieved their climate data
their climate data from the closest weather station, which is Buttonville Airport. Conversely, when
from the closest weather station, which is Buttonville Airport. Conversely, when Hewer and Gough [6]
Hewer and Gough [6] conducted a climate change impact assessment that required climate data from
conducted a climate change impact assessment that required climate data from 1981 to 2014, again,
1981 to 2014, again, the closest station with the necessary data was used (Richmond Hill weather
the closest station with the necessary data was used (Richmond Hill weather station). However, when
station). However, when Hewer and Gough [9] were looking at the effect of seasonal climatic
Hewer and Gough [9] were looking at the effect of seasonal climatic anomalies on zoo attendance,
anomalies on zoo attendance, they introduced a new method for evaluating representative weather
they introduced a new method for evaluating representative weather stations, referred to as “Climatic
stations, referred to as “Climatic Distance”. They concluded that the Toronto Pearson Airport best
Distance”. They concluded that the Toronto Pearson Airport best reproduced average monthly weather
reproduced average monthly weather conditions at the Toronto zoo from 1977 to 1992, and thus used
conditions at the Toronto zoo from 1977 to 1992, and thus used that station for their study.
that station for their study.
This study will also employ the climatic distance method [9,33], but will evaluate the ability of
This study will also employ the climatic distance method [9,33], but will evaluate the ability of
test stations to replicate daily weather data from 1990 to 1992 at the Toronto Zoo. This change was
test stations to replicate daily weather data from 1990 to 1992 at the Toronto Zoo. This change was
made because the current study considers daily weather extremes, not seasonal climatic anomalies,
made because the current study considers daily weather extremes, not seasonal climatic anomalies,
and also because there is a clear urban heat island effect in Toronto [34,35], so stations that acted like
and also because there is a clear urban heat island effect in Toronto [34,35], so stations that acted like
the zoo in the 70s and 80s may no longer be representative of the 90s. Finally, instead of averaging the
the zoo in the 70s and 80s may no longer be representative of the 90s. Finally, instead of averaging
climatic distance ranks across all weather variables considered and selecting one weather station, this
the climatic distance ranks across all weather variables considered and selecting one weather station,
study retrieved data from the most representative station for each weather variable considered. Table 1
this study retrieved data from the most representative station for each weather variable considered.
shows the results of the climatic distance analysis and Figure 1 is a map of the study area, showing the
Table 1 shows the results of the climatic distance analysis and Figure 1 is a map of the study area,
Toronto (Metro) Zoo and the five surrounding weather stations that were evaluated. The daily-scale
showing the Toronto (Metro) Zoo and the five surrounding weather stations that were evaluated.
weather variables that were of interest to this study were the maximum temperature (Tmax), minimum
The daily-scale weather variables that were of interest to this study were the maximum temperature
temperature (Tmin), total precipitation (Ptot), and maximum wind speed (Wspd). Based on the results
(Tmax), minimum temperature (Tmin), total precipitation (Ptot), and maximum wind speed (Wspd).
of the climatic distance analysis, Tmax data was retrieved from the Toronto downtown station, while
Based on the results of the climatic distance analysis, Tmax data was retrieved from the Toronto
Tmin and Ptot data came from the Oshawa station. Wspd data was taken from Buttonville Airport;
downtown station, while Tmin and Ptot data came from the Oshawa station. Wspd data was taken
seeing that there was no Wspd data recorded at the Metro zoo to evaluate Cdist, data was taken from
from Buttonville Airport; seeing that there was no Wspd data recorded at the Metro zoo to evaluate
the closest station by default.
Cdist, data was taken from the closest station by default.
Figure 1. A map of the Greater Toronto Area in southern Ontario (Canada), including the Toronto
Figure 1. A map of the Greater Toronto Area in southern Ontario (Canada), including the Toronto
(Metro) Zoo, as
(Metro) Zoo, as well
well as
as five
five surrounding
surrounding weather
weather stations.
stations.Atmosphere 2020, 11, 99 4 of 17
Table 1. The proximity (physical distance) of five surrounding weather stations in relation to the
Toronto (Metro) Zoo and their climatic distance (Cdist) based on daily weather data from 1990 to 1992.
Station km Tmax Cdist Tmax Rank Tmin Cdist Tmin Rank Ptot Cdist Ptot Rank
Buttonville 15.3 0.157 3 0.273 3 0.801 3
Toronto 23.6 0.125 1 0.351 5 0.644 2
Oshawa 27.6 0.185 4 0.207 1 0.641 1
Pearson 37.8 0.148 2 0.271 2 0.845 4
Udora 49.8 0.219 5 0.298 4 0.919 5
Furthermore, the revealed temperature, precipitation, and wind speed thresholds from the work
of Hewer and Gough [5] were also tested, in addition to the extreme weather thresholds. Additionally,
the theories of Dwyer [36] and Smith [37] were tested, which suggest that above average temperatures
in the winter will cause tourism participation to increase, while above average temperatures in the
summer will cause tourism participation to decrease. Finally, binary thresholds for precipitation and
wind speed were also assessed to determine the effect of any presence of precipitation or measured
wind speed on zoo attendance, compared to the effect of extreme precipitation and wind speeds.
This study treats seasons differently than any other tourism climatology paper that focused on zoo
attendance [4–10]. The reason for this unique treatment of seasons is due to the methodology designed
to determine the effect of extreme weather events. To explain, in order for the methods to be reliable,
any months combined into one season for the purpose of analysis must have similar temperatures and
attendance levels, otherwise we will be comparing differences in attendance between months rather
than differences in zoo attendance between days with extreme and non-extreme weather conditions.
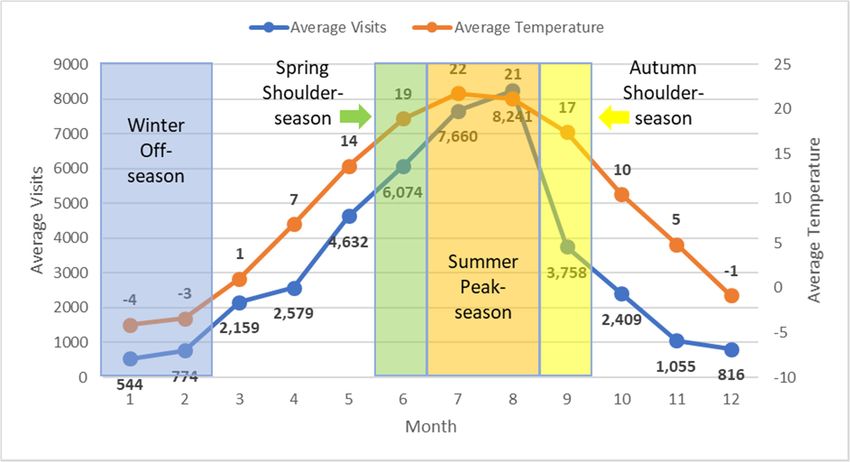
Figure 2 illustrates the monthly seasonality of both average monthly temperatures and average monthly
attendance at the Toronto Zoo. From this figure, it is apparent that July and August could be combined
to make up the summer peak-season while January and February were combined to make up the
winter off-season. However, only June could be used to represent the spring shoulder-season and only
September was used to represent the autumn shoulder-season. As a result, certain months were not
included in the analysis; nonetheless, the effect of extreme weather events on tourism participation is
still captured across all four seasons.
Furthermore, efforts were also made to identify and control for the potentially confounding
effects of several non-climatic factors. These factors included increases in attendance due to weekends
and holidays [4–6]; increasing attendance due to the progression of time within the observational
record [4–6,10]; increasing attendance due to animal stars, such as the giant pandas [9,10], as well as
special attractions, such as Dinosaurs Alive [9,10]; and finally, decreasing attendance due to external
events, such as the terror attacks in the autumn of 2001 and the SARS disease epidemic in the spring of
2003 [9,10]. For each percentile considered, especially for the most extreme two percentiles (99th, 95th,Atmosphere 2020, 11, 99 5 of 17
Atmosphere 2020, 11, x FOR PEER REVIEW 5 of 17
Figure 2. The seasonality of average zoo attendance and average temperature in Toronto (Canada)
Figure 2. The seasonality of average zoo attendance and average temperature in Toronto (Canada)
from 1999 to 2018 (also showing the constitution of the four seasons being analyzed).
from 1999 to 2018 (also showing the constitution of the four seasons being analyzed).
3.3.Results
Results
3.1.
3.1.Extreme
ExtremeDaytime
DaytimeTemperatures
Temperatures(Daily
(DailyMaximum
MaximumTemperature)
Temperature)
Daily −16.0−16.0 ◦ C,
Dailymaximum
maximumtemperatures
temperatures fromfrom1999
1999to to
2018 at the
2018 Toronto
at the TorontoZooZooranged fromfrom
ranged to 19.1
to 19.1
with an average temperature of 0.2 ◦ C, during the winter months of January and February. During
°C, with an average temperature of 0.2 °C, during the winter months of January and February. During
the
thewinter
winteroff-season,
off-season,days dayswith
withusually
usuallywarm warmdaytime
daytimetemperatures
temperatureshad hadaasignificant
significanteffect
effecton onzoo
zoo
attendance (Table 2A). Specifically, days with the warmest 5% of winter temperatures (>9 ◦ C) had
attendance (Table 2A). Specifically, days the warmest 5% of winter temperatures (>9 °C) had the
the greatest
greatest effect
effect onon zoo zooattendance,
attendance,resulting
resultingininan anaverage
averageof of 950
950 additional visitors and and aa 187%
187%
increase
increasecompared
comparedtotoattendance
attendanceon onwinter
winterdays
dayswhenwhentemperatures
temperatureswere werenot notextreme
extreme(ranging
(rangingfrom from
−7 to 7 ◦ C, n = 899). The theoretical threshold represents average winter temperatures, revealing
−7 to 7 °C, = 899). The theoretical threshold represents average winter temperatures, revealing that
that
when when temperatures
temperatures werewere above
above average,
average, zoozooattendance
attendanceincreased
increasedon on average
average by 385 385 visitors,
visitors,
demonstrating
demonstrating a 114% increase compared to attendance on days when winter temperaturesbelow
a 114% increase compared to attendance on days when winter temperatures were were
average. Days with
below average. Daysextremely cold daytime
with extremely winter temperatures
cold daytime had a significantly
winter temperatures negative effect
had a significantly on
negative
average
effect on daily zoo attendance,
average where dayswhere
daily zoo attendance, with the coldest
days with1% theofcoldest
winter 1%temperatures (Atmosphere 2020, 11, 99 6 of 17
temperatures were not extreme. Hewer and Gough [5] reported a revealed temperature threshold of
>26 ◦ C during the shoulder seasons (March to June and September to October), for attendance at the
Toronto Zoo. This revealed temperature threshold was confirmed within the current study, showing
that when temperatures exceeded 26 ◦ C, average zoo attendance decreased by 500 visitors; an 8%
reduction compared to attendance on days when daily maximum temperatures during June were
equal to or less than 26 ◦ C. However, the results also demonstrate that warmer temperatures beyond
the revealed threshold cause zoo attendance to decline at an even greater rate.
Table 2. The effect of extreme daytime temperatures (daily maximum) on zoo attendance in Toronto,
across four different seasons.
Threshold Condition (◦ C) n Mean ∆ %∆ t p
A—Winter Off-Season (January and February)
99th >13.3 12 756.7 149% 1.868 0.044
95th >9 57 949.9 187% 4.292 7 112 621.9 122% 4.668 0.2 586 384.6 114% 10.027Atmosphere 2020, 11, 99 7 of 17
attendance dropping by 2306 visitors, representing a 28% decrease, compared to attendance on days
when temperatures were not considered extreme.
During the autumn shoulder-season month of September, daily maximum temperatures ranged
from 9.5 to 34.1 ◦ C, with an average daytime temperature of 22.5 ◦ C. The autumn shoulder-season
was by far the least sensitive to daytime temperature extremes, with only usually cold temperatures
having a significant effect on zoo attendance (Table 2D). Although days that recorded extreme heat
(>28 ◦ C) did result in fewer visitors than on days with non-extreme temperatures, the differences were
not statistically significant. Furthermore, even the revealed shoulder-season temperature threshold of
>26 ◦ C [5] was not found to be statistically significant during the month of September. The greatest
effect on zoo attendance was observed on days when the coldest 5% of September temperatures were
recorded (9 ◦ C) resulted in
a 187% increase in average daily visitors, but was only equal to an additional 950 visitors, whereas the
most influential threshold in the summer (>34.7 ◦ C) only resulted in a 53% decrease in average daily
attendance, but was equal to 4353 fewer visitors.
3.2. Extreme Nighttime Temperatures (Daily Minimum Temperature)
Daily minimum temperatures for the Toronto Zoo from 1999 to 2018 during the winter months of
January and February ranged from −26.7 to 7 ◦ C, with an average nighttime temperature of −7.9 ◦ C.
During the winter off-season, usually warm winter temperatures caused average daily attendance
to increase and extremely cold winter temperatures caused average daily attendance to decrease
(Table 3A). Although the greatest magnitude of change in zoo attendance was observed in response
to usually warm winter temperatures, the extreme cold thresholds demonstrated a greater statistical
power and significance. The most influential temperature threshold was observed when the warmest
5% of days occurred (>2 ◦ C), resulting in an average of 595 additional visitors and a 113% increase
compared to zoo attendance on days when nighttime temperatures were not considered to be extreme
(ranging from −16.9 to +0.5 ◦ C, n = 891). The theoretical threshold associated with average winter
temperatures (>7.9 ◦ C) was also highly significant, indicating that when winter temperatures were
above average, zoo attendance increased by 81% (307 additional visitors, on average) when compared
to attendance on days when temperatures were below average. Finally, the most influential extreme
cold threshold was associated with days when the coldest 1% of winter temperatures were recorded,
resulting in a 75% reduction in average daily attendance, or 392 fewer visitors, when compared to days
when temperatures were not considered extreme.
During the spring shoulder-season month of June, daily minimum temperatures ranged from
3.5 to 22.5 ◦ C, with an average nighttime temperature of 13.58 ◦ C. Interestingly, visitors seemed to
have a significant aversion to hot nights during the spring shoulder-season month of June, to such a
degree that when nighttime temperatures were warmer than average, zoo attendance decreased by an
average of 527 visitors, revealing a 8% reduction compared to attendance when June temperatures were
below average (Table 3B). Looking at the usually cold thresholds, only the less than 10th percentile
threshold resulted in significant differences, but suggested that when the coldest 10% of nighttime
temperatures were recorded in the month of June, average daily zoo attendance increased by 907
visitors, representing a 15% increase compared to days when minimum temperatures were not extremeAtmosphere 2020, 11, 99 8 of 17
(this threshold demonstrated the greatest magnitude of effect on zoo attendance). Conversely, the most
influential extreme heat threshold was associated with the warmest 5% of nights in June (>19 ◦ C),
resulting in an average of 760 fewer visitors and a 13% reduction compared to zoo attendance on days
when minimum temperatures were not considered to be extreme (ranging from 9.4 to 18 ◦ C, n = 476).
Table 3. The effect of extreme nighttime temperatures on zoo attendance in Toronto, across four
different seasons.
Threshold Condition (◦ C) n Mean ∆ %∆ t p
A—Winter Off-Season (January and February)
99th >4 10 510.5 97% 1.678 0.064
95th >2 45 594.8 113% 3.211 0.001
90th >0.5 103 472.6 90% 4.087 7.9 579 306.9 81% 7.819Atmosphere 2020, 11, 99 9 of 17
thresholds (t = −10.322, p < 0.001), resulting in 1881 fewer visitors on average and a 23% reduction
compared to days when minimum summer temperatures were less than or equal to 18 ◦ C.
During the autumn shoulder-season month of September, daily minimum temperatures ranged
from 1.5 to 23 ◦ C, with an average nighttime temperature of 12.3 ◦ C. The autumn season was by far the
least sensitive to extreme nighttime temperatures, seeing that none of the tested thresholds resulted in
statistically significant differences between means (Table 3D). In the month of September, zoo visitors
were no longer as sensitive to extremely warm nights as they were in the spring shoulder-season
month of June, despite the same temperature extremes being observed and tested. Zoo visitors in
the month of September were also not positively impacted by usually cool nights, like they were in
the summer months, probably because usually cool nights in September are much colder than they
are in the summer. Finally, zoo visitors in the month of September were generally not sensitive to
temperature variability, in that even the theoretical threshold which compared attendance on days
with above average minimum temperatures to attendance on days with below average minimum
temperatures did not return any statistically significant results (resulting in an average of only five
additional visitors, representing a 0% difference between means for these two groups).
Overall, zoo attendance during the summer peak-season months of July and August was most
sensitive to extreme nighttime temperatures, exhibiting both the greatest magnitude of effect on average
daily visitors and the greatest statistical power among tests. However, the winter off-season months
of January and February were also highly sensitive to extreme nighttime temperatures, displaying
the greatest percent change associated with attendance on days with extreme minimum temperatures
compared to days with normal minimum temperatures. Interestingly, the shoulder-season months of
June and September were the least sensitive to extreme nighttime temperatures, which is contrary to
the findings related to the sensitivity of zoo attendance to weather variability in general [5,6].
3.3. Extreme Precipitation (Daily Total Precipitation)
Total daily precipitation during the winter off-season months of January and February in Toronto
from 1999 to 2018 ranged from 0 to 35 mm, exhibiting a seasonal average of 2.0 mm, making the winter
season the driest season of the year. The winter season was the least sensitive to daily precipitation
extremes, but was still sensitive to precipitation in general (Table 4A). For example, neither the 99th
percentile of daily precipitation (>21 mm) nor the 95th percentile of daily precipitation (>10.6 mm)
resulted in statistically significant differences between means for zoo attendance, when compared to
days when total precipitation was not considered to be extreme (ranging from 0 to 6.2 mm, n = 1013).
Looking closer at this finding, it was determined that above average temperatures on a weekend in the
winter had an overriding effect over the influence of extreme precipitation, thereby confounding the
results on the 99th and 95th percentile thresholds. The overriding effect of warm weekends against
extreme precipitation for zoo attendance is contrary to the contentions of de Freitas (1990, 2003, 2016) for
beach tourism, which state that precipitation and wind have an overriding effect on ideal temperatures.
Although the wettest 10% of days during the winter season did result in a statistically significant
decline in daily zoo attendance, the magnitude of the effect and significance of the results were not as
pronounced as they were for the revealed (>2 mm) and binary thresholds (>0 mm) thresholds, to such
a degree that the greatest influence on daily zoo attendance was observed when comparing days with
precipitation to days without precipitation. In this case, days with precipitation recorded an average of
152 fewer visitors, representing a 26% reduction compared to days with no precipitation.
During the spring shoulder-season month of June, total daily precipitation ranged from 0 to
67.4 mm, with a seasonal average of 3.16 mm, making the spring season the wettest season in the year.
Daily zoo attendance was highly sensitive to precipitation extremes and precipitation in general during
the month of September (Table 4B). The most influential effect on zoo attendance was observed during
the wettest 2% of days in the spring (>26.7 mm), resulting in an average of 2253 fewer visitors, which
is a 36% reduction compared to attendance on days when precipitation was not extreme (ranging
from 0 to 10.2 mm, n = 525). The revealed threshold (>2 mm) reported by Hewer and Gough [5]Atmosphere 2020, 11, 99 10 of 17
was found to be highly significant, but it is worth noting that as precipitation increased, the effect on
attendance became more pronounced, and the binary threshold (>0 mm) was more influential than the
revealed threshold.
Table 4. The effect of extreme precipitation on zoo attendance in Toronto, across four different seasons.
Threshold Condition (mm/d) n Mean ∆ %∆ t p
A—Winter Off-Season (January & February)
99th >21 12 205.7 38% 0.427 0.339
95th >10.6 57 −126.0 −23% −1.141 0.129
90th >6.2 113 −118.5 −22% −1.644 0.051
Revealed >2 261 −144.1 −25% −3.322 0.000
Wet/Dry >0 446 −152.4 −26% −3.928 0.000
B—Spring Shoulder-Season (June)
98th >26.7 12 −2253.0 −36% −5.503 17.6 29 −2037.9 −32% −5.729 10.2 59 −1918.2 −31% −6.543 2 152 −1733.5 −27% −7.926 0 234 −1780.5 −26% −9.063 35 12 −995.1 −12% −1.014 0.166
95th >15.4 59 −1712.9 −21% −4.234 8 120 −1889.5 −23% −6.773 2 238 −1995.3 −24% −9.486 0 397 −1834.1 −22% −10.178 25.4 11 −2128.0 −54% −3.784 0.001
95th >18 30 −1626.7 −41% −3.499 0.001
90th >9.4 60 −1685.0 −43% −4.960 2 131 −1298.8 −32% −4.483 0 194 −1202.9 −29% −4.472 2 mm) reported by Hewer and Gough [5]; where days with more than 2 mm of rain
resulted in 1995 fewer visitors on average, representing a 24% reduction in attendance compared to
days with less than or equal to 2 mm of rain. One additional aspect to note relates to the finding that
the 99th percentile of daily precipitation did not have a statistically significant effect on zoo attendance.
When looking closer at this finding, it was determined that mild weekends during the summer were
often associated with above average attendance, even with the occurrence of extreme precipitation,
thereby confounding the results of the analysis for the 99th percentile of summer precipitation.
During the autumn shoulder-season month of September, total daily precipitation ranged from
0 to 50 mm, with a seasonal average of 2.88 mm. September zoo attendance was highly sensitive to
both extreme precipitation and the occurrence of precipitation in general (Table 4D). Although the
spring season recorded a greater magnitude of effect on zoo attendance for extreme precipitation,
the autumn season recorded a higher percentage change, when comparing attendance on days with
extreme precipitation to days with normal precipitation (ranging from 0 to 9.4 mm, n = 533). TheAtmosphere 2020, 11, 99 11 of 17
most influential precipitation threshold was associated with the wettest 2% of days, which caused
zoo attendance to decline by an average of 2128 visitors, indicating a 54% reduction compared to
days when daily precipitation was not considered to be extreme. Finally, both the binary (>0 mm)
and revealed (>2 mm) thresholds had highly significant negative effects of daily zoo attendance, but
the magnitude of influence did not plateau there, as suggested by Hewer and Gough [5]; rather, it
continued to increase in magnitude as the amount of precipitation increased.
3.4. Extreme Wind Speed (Daily Maximum Wind Speed)
The daily maximum wind speed in Toronto from 1999 to 2018 during the winter season months of
January and February ranged from 30 km/h), increasing
wind speeds had a significantly negative effect on average daily zoo attendance during the winter
season. The greatest effect was observed in relation to the revealed threshold of Hewer and Gough [5],
resulting in 70 fewer visitors on average and a 12% reduction when compared to attendance on days
with wind speeds less than or equal to 40 km/h. It is important to note, however, that it is very likely
that the insignificant results from the percentile thresholds associated with extreme wind speeds may
have been confounded by the coincidence of warm weekends; where, once again, warm weekends
displayed a higher than average attendance, despite the coinciding presence of high winds.
During the spring shoulder-season month of June, the maximum daily wind speed ranged fromAtmosphere 2020, 11, 99 12 of 17
11 days had rain, 73%) and 95th (36 out of 50 days had rain, 72%) percentiles. Nonetheless, the negative
effect of extreme wind on zoo attendance during the summer months was found to be greater than the
negative effect of extreme precipitation, thereby illustrating a combined effect.
Table 5. The effect of an extreme wind speed on zoo attendance in Toronto, across four different seasons.
Threshold Condition (km/h) n Mean ∆ %∆ t p
A—Winter Off-Season (January and February)
99th >70 12 −96.6 −18% −0.643 0.267
95th >59 57 15.0 3% 0.131 0.448
90th >54 112 28.6 5% 0.364 0.358
Revealed >40 397 −69.6 −12% −1.662 0.048
Windy/Calm >30 662 −59.0 −10% −1.393 0.082
B—Spring Shoulder-Season (June)
98th >61 11 −264.2 −4% −0.452 0.330
95th >56 29 −1230.9 −20% −3.120 0.002
90th >50 51 −670.2 −11% −2.177 0.017
Revealed >40 131 −715.6 −11% −3.134 0.001
Windy/Calm >30 282 −778.9 −12% −3.821 65 11 −2855.3 −35% −3.672 0.002
95th >50 50 −2008.2 −25% −4.520 44 116 −1061.8 −13% −3.138 0.001
Revealed >40 220 −980.7 −12% −4.083 30 563 −859.3 −10% −4.976 61 10 −2726.1 −70% −8.374 50 24 −1878.3 −49% −3.748 46 53 −1342.1 −35% −3.258 40 110 −1082.5 −27% −3.329 0 250 −727.1 −18% −2.608 30 km/h) wind thresholds.
4. Discussion
Looking at the considerable differences in the way tourism participation responded to extreme daily
weather events across the seasons, this study emphasizes the importance of defining different seasonsAtmosphere 2020, 11, 99 13 of 17
related to tourism participation for a given activity and analyzing the effect of weather and climate
variability, as well as extreme weather events, on those seasons separately. For example, the results
of this study indicate that the winter off-season was most sensitive to daytime temperature extremes
(maximum temperatures), while the spring shoulder-season was most sensitive to precipitation
extremes. Moreover, the summer season was most sensitive to nighttime temperature extremes
(minimum temperatures) and the autumn shoulder-season was most sensitive to wind speed extremes.
It became clear that each season was associated with its own degree of weather sensitivity to the
various weather variables and weather extremes that were explored. This finding has important
implications for previous studies that combined many months or even multiple seasons into one season
for analysis, especially modeling-based studies that defined weather sensitivity and held that statistical
relationship constant within their predictive models. For example, Jones and Scott [14,15] modeled the
peak and shoulder seasons for park visitation separately, which was good, but the shoulder season
was likely too large and needed to be separated to include an off season, as tourism participation
does not respond in the same way to weather and climate variability in the spring as it does in the
winter [23,33]. Furthermore, Hewer and Gough [5,6] modeled zoo attendance using an off-season and
shoulder-season and peak-season model, which was an improvement, but both this study and the
analogue study of Hewer and Gough [9] demonstrate that tourism participation does not respond in the
same way to weather and climate variability in the spring as it does in the autumn, thus requiring the
shoulder seasons to be modeled/analyzed separately. To further support this contention, the modeling
studies of Hewer and Gough [5,6] suggested that the shoulder seasons were most weather-sensitive
and that tourism participation in both the spring and autumn responded in the same way. However,
the analogue study of Hewer and Gough [9] found that the autumn season was the only season not to
be affected by seasonal climatic anomalies. Conversely, the current study has found the spring season
to have a greater sensitivity to temperature and precipitation extremes, while the autumn was more
sensitive to maximum windspeeds.
Considering the revealed weather thresholds reported by Hewer and Gough [5] for zoo attendance
in Toronto, the current study validated each of these thresholds across the various seasons for which
they applied, apart from maximum temperatures (>26 ◦ C) in the autumn season, which again relates
back to the fact that Hewer and Gough [5] combined the spring and autumn into one shoulder season.
Furthermore, there were even a few cases where the revealed threshold of Hewer and Gough [5]
proved to be the most influential threshold when compared to the thresholds set by the percentiles,
as well as the binary thresholds of wet versus dry or windy versus calm. For example, the revealed
precipitation threshold of >2 mm was found to have the greatest magnitude of effect on zoo attendance
during the summer peak-season. Additionally, the revealed windspeed threshold of >40 km/h had
the greatest magnitude of effect on zoo attendance during the winter off-season. In the absence of
revealed thresholds, we also tested theoretical thresholds defined by the seasonal average, based on
the assumptions of Dwyer [36] and Smith [37], who stated that above average temperatures in the
winter would increase tourism participation, while above average temperatures in the summer would
decrease attendance. This assumption proved true for both maximum and minimum temperatures
during the winter. Furthermore, above average temperatures in June caused attendance to decline, but
there was no significant effect of above average temperatures in September. Additionally, the binary
thresholds of wet versus dry and windy versus calm resulted in statistically significant effects on zoo
attendance across all four seasons apart from windspeed in the winter, and in one case, was even the
most influential threshold tested (for total precipitation in the winter). The binary thresholds typically
indicated the direction of the effect that would be seen among the extreme percentile thresholds, but
the binary thresholds often resulted in lesser magnitudes of effect, yet had a stronger statistical power.
Although it was not the focus of the current study, heat waves are an important aspect of extreme
weather events, with major implications due to observed and projected warming under global climate
change. NOAA [38] defines heat waves as “a period of unusually hot weather that typically lasts
two or more days”. Conversely, this study only considered the effect of single-day heat extremes.Atmosphere 2020, 11, 99 14 of 17
Therefore, future research in the field of tourism climatology that develops a novel methodology (due
to the absence of any previous studies) that assesses the effect of heat waves (periods with multiple
and consecutive days of extreme heat) on human participation in recreation and tourism, remains an
important area of future research. Just as the methodology in this current study would be appropriate
for application in future research examining other tourism activities beyond zoo attendance, a research
methodology designed to assess the impacts of heatwaves on tourism participation would be useful
for application with zoo attendance along with other tourism contexts, such as park visitation, beach
use, or general sight-seeing.
Finally, this novel method for identifying extreme weather events and determining their effect on
human participation in recreation and tourism has important implications for future impacts under
projected climate change. Firstly, climate science suggests that extreme weather events are already
increasing and will continue to increase, both in frequency and intensity, as the weather and climate
become less stable and more variable under future climate change [39]. Therefore, the effects reported
in this study are likely to become more frequent and more intense. However, it was found that the
effect of extreme daily weather events had both negative and positive implications for zoo attendance
in Toronto, depending on the weather variable and operating season. For example, usually warm
daytime temperatures had a significantly positive effect on zoo attendance in the winter off-season, but
both extreme heat and usually cold temperatures had significantly negative effects on zoo attendance
in the spring and summer seasons. Similarly, usually warm nighttime temperatures had a positive
effect on participation in the winter, but extremely warm nighttime temperatures had a negative effect
in the spring and summer. In comparison, extremely cool nighttime temperatures had a negative effect
in the winter, but usually cool nighttime temperatures had a positive effect in the spring and summer.
However, when extreme precipitation and wind speeds were found to affect zoo attendance across the
seasons, the effects were always negative. The most important finding in relation to climate change
impacts and specifically a warmer climate is that extremely warm seasonal temperatures had the
greatest influence on zoo attendance, compared to extreme cold, extreme precipitation, and extreme
wind speed. In general, therefore, the results of this study suggest that an increasing intensity and
frequency of extreme weather events under projected climate change will have negative effects on zoo
attendance, especially during the spring shoulder and summer peak seasons, with a slight off-setting
effect increasing zoo attendance in the winter season, yet to a much lesser degree. Therefore, future
studies attempting to assess the impacts of projected climate change on human participation in
recreation and tourism, should endeavor to quantify and include the effects of extreme weather events.
5. Conclusions
We will draw some conclusions from the results by identifying which weather variable had the
greatest effect on zoo attendance within each season. During the winter off-season months of January
and February, the most influential weather variable was the daily maximum temperatures (Tmax),
being best represented by the 95th percentile threshold (>9 ◦ C), where average daily attendance
increased by 950 visitors (+187%), and was found to be statistically significant (t = 4.292, p < 0.001). For
the spring shoulder-season month of June, Tmax was once again the most influential weather variable
for zoo attendance, but this time, it was the coolest 2% of days (34.7 ◦ C), resulting in an average of 4353 fewer visitors (−53%); a difference that was
statistically significant (t = −7.792, p < 0.001). Interestingly, during the autumn shoulder-season month
of September, Tmax was not the most influential weather variable. Instead, zoo attendance was more
influenced by a combination of total precipitation and maximum wind speed. The most influential
weather variable in the month of September was the maximum wind speed, being best represented
by the windiest 2% of days (>61 km/h), resulting in an average of 2726 fewer visitors (−70%), whichAtmosphere 2020, 11, 99 15 of 17
was statistically significant (t = −8.374, p < 0.001). However, extreme wind speeds were found to be
highly correlated with rain events during the month of September. Therefore, we cannot attribute all
of this effect to wind speed alone, since total precipitation likely confounded the results and created a
combined effect. Extreme precipitation was also very influential in terms of September zoo attendance,
where the wettest 2% of days (>25.4 mm) resulted in an average of 2128 fewer visitors each day (−54%),
which was found to be statistically significant (t = −3.784, p = 0.001).
Returning to the NCEI definition of extreme weather events “as lying in the outermost (most
unusual) 10 percent of a place’s history” [32], this concept was represented by the 90th and theAtmosphere 2020, 11, 99 16 of 17
9. Hewer, M.; Gough, W. The effect of seasonal climatic anomalies on zoo visitation in Toronto (Canada) and
the implications for projected climate change. Atmosphere 2016, 7, 71. [CrossRef]
10. Su, A.; Lin, Y. Factors affecting yearly and monthly visits to Taipei Zoo. Theor. Appl. Climatol. 2019, 135,
463–472. [CrossRef]
11. Wall, G.; Harrison, R.; Kinnaird, V.; McBoyle, G.; Quinlan, C. The implications of climate change for camping
in Ontario. J. Recreat. Res. Rev. 1986, 13, 50–60.
12. Richardson, R.; Loomis, J. Adaptive recreation planning and climate change: A contingent visitation approach.
Ecol. Econ. 2004, 50, 83–99. [CrossRef]
13. Loomis, J.; Richardson, R. An external validity test of intended behaviour: Comparing revealed preference
and intended visitation in response to climate change. J. Environ. Plan. Manag. 2006, 49, 621–630. [CrossRef]
14. Jones, B.; Scott, D. Implications of climate change for visitation to Ontario’s provincial parks. Leisure 2006, 30,
233–261. [CrossRef]
15. Jones, B.; Scott, D. Climate change, seasonality and visitation to Canada’s national parks. J. Parks Recreat.
Adm. 2006, 24, 42–62.
16. Scott, D.; Jones, B.; Konopek, J. Implications of climate and environmental change for nature-based tourism
in the Canadian Rocky Mountains: A case study of Waterton Lakes national park. Tour. Manag. 2007, 28,
570–579. [CrossRef]
17. Scott, D.; Jones, B.; Konopek, J. Exploring the impact of climate-induced environmental changes on future
visitation to Canada’s Rocky Mountain national parks. Tour. Rev. Int. 2008, 12, 43–56. [CrossRef]
18. Hadwen, W.; Arthington, A.; Boon, P.; Taylor, B.; Fellows, C. Do climatic or institutional factors drive seasonal
patterns of tourism visitation to protected areas across diverse climate zones in eastern Australia? Tour.
Geogr. 2011, 13, 187–208. [CrossRef]
19. Buckley, L.; Foushee, M. Footprints of climate change in US national park visitation. Int. J. Biometeorol. 2011,
56, 1173–1177. [CrossRef]
20. Monahan, W.; Fisichelli, N. Climate exposure of US National Parks in a new era of change. PLoS ONE 2014,
9, e101302. [CrossRef]
21. Fisichelli, N.; Schuurman, G.; Monahan, W.; Ziesler, P. Protected area tourism in a changing climate: Will
visitation at US National Parks warm up or overheat? PLoS ONE 2015, 10, e0128226. [CrossRef] [PubMed]
22. Hewer, M.; Scott, D.; Gough, W. Tourism Climatology for Camping: A Case Study of two Ontario Parks
(Canada). Theor. Appl. Climatol. 2015, 121, 401–411. [CrossRef]
23. Hewer, M.; Scott, D.; Fenech, A. Seasonal Weather Sensitivity and the Implications of Climate Change for
Park Visitation: A case study of Pinery Provincial Park (Ontario, Canada). Tour. Geogr. 2016, 18, 297–321.
[CrossRef]
24. Hewer, M.; Scott, D.; Gough, W. Differences in the Importance of Weather and Weather-based Decisions
among Campers in Ontario parks (Canada). Int. J. Biometeorol. 2017, 61, 1805–1818. [CrossRef] [PubMed]
25. Hewer, M.; Scott, D.; Gough, W. Differential Temperature Preferences and Thresholds among Summer
Campers in Ontario’s Southern Provincial Parks: A Canadian case study in tourism climatology. Theor. Appl.
Climatol. 2018, 133, 1163–1173. [CrossRef]
26. Perry, A. Weather, climate and tourism. Weather 1972, 27, 199–203. [CrossRef]
27. Yapp, G.; McDonald, N. A recreation climate model. J. Environ. Manag. 1978, 7, 235–252.
28. Gössling, S.; Scott, D.; Hall, C.M.; Ceron, J.-P.; Dubois, G. Consumer behaviour and demand response of
tourists to climate change. Ann. Tour. Res. 2012, 39, 36–58. [CrossRef]
29. Hewer, M.; Gough, W. Thirty years of assessing the impacts of climate change on outdoor recreation and
tourism in Canada. Tour. Manag. Perspect. 2018, 26, 179–192. [CrossRef]
30. Vaidyanathan, A.; Kegler, S.; Saha, S.; Mulholland, J. A statistical framework to evaluate extreme weather
definitions from a health perspective. Bull. Am. Meteorol. Soc. 2016, 97, 1817–1830. [CrossRef]
31. Cattiaux, J.; Ribes, A. Defining single extreme weather events in a climate perspective. Bull. Am. Meteorol.
Soc. 2018, 99, 1557–1568. [CrossRef]
32. National Oceanic and Atmospheric Administration (NOAA). National Centers for Environmental Information
(NCEI). 2019. Available online: https://www.ncdc.noaa.gov/climate-information/extreme-events (accessed
on 20 December 2019).Atmosphere 2020, 11, 99 17 of 17
33. Hewer, M.; Gough, W. Using a multi-year temporal climate analogue approach to assess the impacts of
projected climate change on seasonal park visitation in Ontario. Weather Clim. Soc. 2019, 11, 291–305.
[CrossRef]
34. Gough, W.; Rosanov, Y. Aspects of Toronto’s climate: Heat island and lake breeze. Can. Meteorol. Oceanogr.
Soc. Bull. 2001, 29, 67–71.
35. Mohsin, T.; Gough, W. Characterization and estimation of urban heat island at Toronto: Impact of the choice
of rural sites. Theor. Appl. Climatol. 2012, 108, 105–117. [CrossRef]
36. Dwyer, J. Predicting daily use of urban forest recreation sites. Landsc. Urban Plan. 1988, 15, 127–138.
[CrossRef]
37. Smith, K. The influence of weather and climate on recreation and tourism. Weather 1993, 48, 398–404.
[CrossRef]
38. NOAA. SciJinks—Its All about Weather: Heatwaves. 2019. Available online: https://scijinks.gov/heat/
(accessed on 20 December 2019).
39. National Academy of Sciences. Global Warming is Contributing to Extreme Weather Events. 2019.
Available online: https://sites.nationalacademies.org/BasedOnScience/climate-change-global-warming-is-
contributing-to-extreme-weather-events/index.htm (accessed on 20 December 2019).
© 2020 by the author. Licensee MDPI, Basel, Switzerland. This article is an open access
article distributed under the terms and conditions of the Creative Commons Attribution
(CC BY) license (http://creativecommons.org/licenses/by/4.0/).You can also read