Spatiotemporal Characteristics of Long-Term Annual Average Air Temperature over Sri Lanka
←
→
Page content transcription
If your browser does not render page correctly, please read the page content below
International Journal of Multidisciplinary and Current
                                                             Educational Research (IJMCER)
                                 ISSN: 2581-7027 ||Volume|| 2 ||Issue|| 6 ||Pages 87-97||2020||

  Spatiotemporal Characteristics of Long-Term Annual Average
               Air Temperature over Sri Lanka
                  1,
                       Wijeratne V.P.I.S.,2,Manawadu L., 3,Kaushalya G.N.
 Department of Geography, University of Colombo, CumarathungaMunidasaMawatha, Colombo 03, Sri Lanka

ABSTRACT:Air Temperature plays an important role in perceiving climate change over the world caused by
many physiographic and anthropogenic activities. The most recent climate change related studies have focused
on changes of metrological variables such as temperature and precipitation. This research mainly aimed to
examine the spatiotemporal variation of the annual average air temperature over Sri Lanka from 1981 to 2019.
The NASA POWER weather database were used to extract the annual average temperature for 57 major and
minor observatories in Sri Lanka. Spatial interpolation techniques, cluster and outlier analysis in ArcGIS,
regression analysis and standard deviation method were used to fulfill the study objectives. The result of this
research revealed that the annual mean air temperature of the country has slightly increased from 0.85oC during
the last 39 years. Jaffna is the area which shows highest increment (0.84oC) of air temperature and NuwaraEliya
shows the lowest increment of air temperature (0.77oC) in the country during the study period. Also, it can be
identified that there are a few extremes of annual mean air temperature and those extremes can be well
correlated with the impact of El Niño and La Niño. In the decade of 2001 to2010, the temperature has shown
downward trend and after 2010 again it has shown upward trend until 2019. Also, two distinct clusters were
identified in the northwest and middle part of the country and most of the meteorological stations located in the
country have shown an increasing trend of annual air temperature from 1981 to 2019.

                                         I.     INTRODUCTION
Air temperatures are rising over the world and the spatial pattern of worming is not uniform globally. Some
areas of the earth surface are warmer than others; some have no evidence of change, and even have cooled
(Brunet et al, 2007). Air temperature plays a big role in studying and detecting climate changes brought about
by different anthropogenic activities; such as high urbanization, Industrialization. Fuel combustions, formation
of heat islands and greenhouse gas emissions, etc. (Subarna, 2017). Depletion of the ozone layer, changes in sea
level, changes in rainfall patterns and global warming can be identify as a main current climatic changes in the
world. Among these, global warming has greatly influenced the current spatial and temporal changes caused to
the climate change. The United Nations Framework Convention on Climate Change (UNFCCC) refers to
climate change as the direct or indirect attribution of human activities that change the composition of the global
atmosphere timelines (UNFCCC, 1992).The global climate is a system of interconnectedness with the sun, the
earth, oceans, land, glaciers, and the biosphere. Climate conditions in an area or region are defined as the long-
term average (at least thirty years) of the behavior of meteorological elements in that area or region. Also,
factors such as temperature, rainfall, humidity, air pressure, wind speed and solar heating are considered as
elements of weather. The behavior of these meteorological elements in a given area determines the climatic
conditions of that area based on the prevailing long-term average. Global warming is the result of various
processes that increase the temperature of the Earth's atmosphere. Temperature measurements taken using
instruments around the world, both on land and on sea, have shown that, over the last 100 years, the earth’s
surface and the bottom part of the atmosphere has warmed by an average of 0.6°C (Subarna, 2017). In this fact,
eleven years of the last twelve years have been among the hottest since temperatures were reported to have risen
by the end of the century. Even small increases in average global temperature can have devastating effects on
human health, ecosystems, plants, animals and renewable energy systems. Rising temperatures in the Arctic
have already reduced the average ice cover, disrupting polar bears' eating habits and the lifestyles of the Inuit
communities (Bilbao, 2019).

In addition, Greenhouse Gas (GHGs) emissions from human activities since the Industrial Revolution have been
considered as a major contributor to global warming (IPCC AR4, 2007). Rising atmospheric temperatures
directly affect to the situations such as droughts, sea level rise, changes in local weather conditions, extreme
weather events, and hurricanes (Sujeewa, 2011). Such effects of climate change have led to an increase in this
kind of research and studies in many parts of the world today. Especially, changes in both temporal and spatial
atmospheric temperature can be identify globally as well as regionally. Global temporal temperature patterns
vary from month to month and from year to year.

| Volume 2 | Issue 6 |                                 www.ijmcer.com                                      | 87 |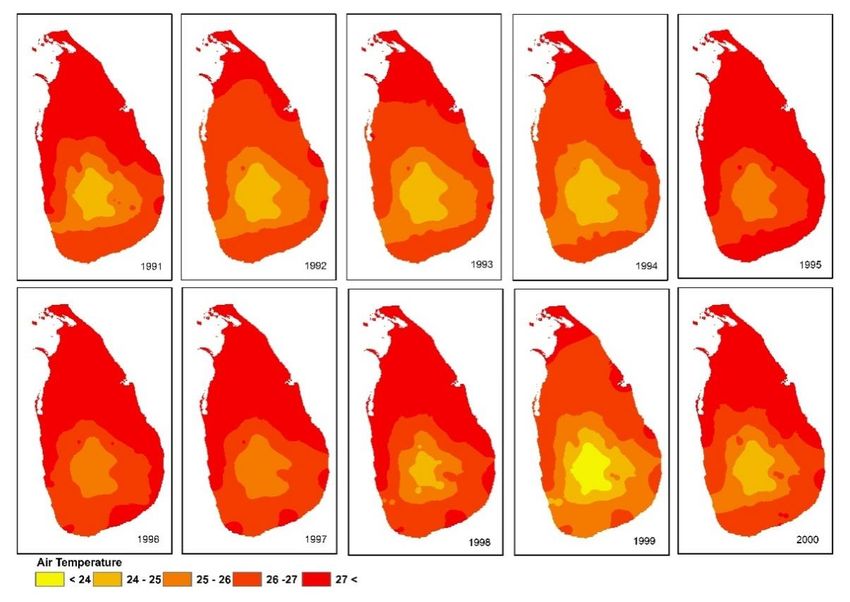
Spatiotemporal Characteristics of Long-Term Annual…

But in the northern and the southern hemisphere different seasons identified based on the temperature can be
seen; spring, summer, autumn and winter. These temperature patterns are born with the oscillations of the earth
and the effects of the sun. But in the tropical countries like Sri Lanka, this kind of seasons can't be identified.
But, most of the countries in tropical areas have a temperature patterns in relation to the rainfall seasons.Sri
Lanka, which has a complex climate in the tropics, has also seen a number of changes over the past decade due
to global warming. These include changes in rainfall patterns, changes in rainfall intensity, variability in the
prevailing monsoon seasons in the country, variation in climatic zones, changes in the water capacity of water
sources and drought conditions. Sri Lanka is still a developing country with a majority of people inheriting an
agricultural lifestyle based on climate patterns, the potential for adaptation to such climate change is very low.
As a result, many people suffer annually due to the inability to cope with the problems caused by climate
change.Although humans have an innate ability to recognize patterns of climate and weather in the past, they
have a little ability to distinguish complex weather conditions today in Sri Lanka. Much of the past climate and
climatic patterns were determined by natural conditions, but nowadays it has become increasingly difficult to
identify a pattern due to increased human influence on these climatic conditions, and the ability to adapt to those
conditions also has diminished. Severely damaged by sea level rise, coastal erosion and inundation due to global
warming of low-lying areas especially southwest of the country. As an island, Sri Lanka’s coastal region can be
identify as a highly populated (34% of the total population) area in the country. Therefore, this was directly
affected for the population who are living in the coastal areas in Sri Lanka. Accelerated sea level rise may also
cause loss of houses, damage on roads, hotels and other coastal structures and water quality problems due to
salinity intrusion upstream in rivers.

Altitude rather than latitude is the main cause of regional changes in air temperature over Sri Lanka. With some
modified effect due to rainfall, the mean monthly temperature changes slightly depending on the seasonal
movement of the sun. The average annual temperature in Sri Lanka is mostly homogeneous in the lowlands and
rapidly declining in the highlands. In the lowlands, the mean annual temperature at altitudes of 100 to 150 m
varies from between 26.5 oC to 28.5 oC and the average annual temperature is 27.5oC. As the altitude of the
highlands increase, the temperature rapidly. The average annual temperature in NuwaraEliya, which is 1800m
above sea level, is 15.9 is oC. January is generally the coldest month for the average monthly temperature, and
April and August are the hottest months. The average annual temperature varies from 27oC in the coastal
lowlands of the central highlands (above 1900m above sea level) to 16oC in NuwaraEliya (Department of
Meteorology, 2019). However, recently climate change induced high temperature is a major issue in Sri Lanka
and weather extremes in Sri Lanka has increased. Therefore, it is very important to examine the long-term air
temperature variability in Sri Lanka. Recently, a number of studies have focused on long-term air temperature
changes and most of previous analyses assessing changes in the extreme state of the climate have employed
daily records for describing and analyzing trends of extreme temperatures over the world (Brunet, 2017). The
most recent studies have focused on identify the changes of climate related elements in the different parts of the
world. Most of them have been studies on spatial and temporal variability of air temperature in different regions.
Samantha, (2011) has studied about the monthly mean air temperature using GIS and Remote Sensing in Papua
New Guinea. Main objective of this research work was to develop a statistical model to forecast the temperature
(monthly) in the eastern part of Papua New Guinea. Spatial interpolation technique in ArcGIS (Spline) has been
used to create the distribution maps of air temperature. According to the results of the study, the range of
temperature was 6.5°C in the month of June, where maximum temperature was 25.8°C and minimum was
19.3°C. Furthermore, the study has been found that the vegetation canopy coverage and digital elevation model
data set are the main variables for the temperature modelling in the study area. Finally, the study has been
suggested, that these two variables are likely to be major factors to control the temperature.

Datsenko et al. (2010) has studied about the spatiotemporal variability of air temperature fields at the range of
temporal scales from one month to several years and the data of instrumental observations in the 20 th century at
meteorological stations of China were used for the analysis of the research. This research has found that there
was a considerable qualitative difference between the properties of spatiotemporal variability of surface air
temperature fields in Northern Eurasia and China.Sujeewa (2019) has focused to study on warming trends
trough detailed analysis of changes in surface temperature observation in the last 140 years (1871 – 2010) in Sri
Lanka. In this study statistical techniques has been used to analyze the historical temperature observation to
detect climate changes in Sri Lanka. Boxplot diagram and interpolation technique were used to present the
temperature distribution in Sri Lanka. According to the results of this study local climate has recorded as a
positive worming trend and temperature has risen and climate has clearly wormed in Sri Lanka. The highest rate
of changes in temperature were observed in the dry climatic zone in Puttalam. The minimum temperature has
increased by 0.047oC per year from 1851 to 1920.

| Volume 2 | Issue 6 |                                 www.ijmcer.com                                       | 88 |
Spatiotemporal Characteristics of Long-Term Annual…

Furthermore, the results shows that, the highest rate of decreasing of temperature was observed in the wet zone
in Rathnapura. Gananapragasamet al. (2018) has used a comprehensive set of statistical metrics to investigate
the historical trends in averages and extremes of rainfall and temperature in Sri Lanka. In this study
Nonparametric Mann–Kendall test and Sen–Thiel regression were used to analyze the linear trends and the
modified seasonal Mann–Kendall test was then applied for the seasonal data. Results of the study have been
shown that, during May, 15 per cent of the stations showed a significant decrease in wet days, which may be due
to the delayed southwest monsoon to Sri Lanka from 1961 to 2015. A remarkable increase in the annual
average temperature of minimum temperature and maximum temperature was observed as 70 per cent and 55
per cent of the stations respectively. 80 per cent of the main stations demonstrated statistically, there was a
significant increase of minimum temperature during June and July in the entire period. Daily temperature range
has exhibited a widespread increase at the stations located within the southwestern coast region of Sri Lanka.
Nagamuthu (2016) has studied the spatial and temporal patterns of temperature in the Northern Province of Sri
Lanka from 1972 to 2014. Statistical Analysis (Average) and spatial analysis (Interpolation technique) were
used as main analyses of the study. The results has been shown that the average air temperature of Northern
Province was 28.4oC. During the First Inter Monsoon Season, the average temperature was 29.2oC and in the
Second Inter Monsoon Seasons, the study area has received an average temperature not exceeding
28.8oC.Mannar has the highest Average Annual Temperature in the Northern Province of Sri Lanka. According
to the findings of the study, average temperature of the study area has varied every month and year. Seasonally,
during the southwest monsoon season the study area received the most amounts of the temperature and during
the northeast monsoon season, study area received less amount of the temperature. Furthermore, the study found
the geographical factors determine the spatial variations of the temperature and the rainfall of the study area.

                                        II.     METHODOLOGY
STUDY AREA:Sri Lanka lies between latitude 05°55’N and 09°50’N; longitude 79°42’E and 81°52’E, with
65,610 square kilometers extent (Figure 1). It is an island in the northern Indian Ocean and the Bay of Bengal
located at the northeast side of the island and the Arabian Sea located at the northwestern side of the island.The
central part of the island is a highland, mostly above 300 meters from the sea level and is the source of the major
rivers of the country which flow across the lowlands into the Indian Ocean. The four rainfall seasons in the
country, first inter-monsoon (March-April), southwest monsoon (May-September), second inter-monsoon
(October-November) and northeast monsoon and convectional rain (Burt &Weerasinghe, 2014). These
topographical features influence strongly on spatial variation of rainfall of the country. Mean annual rainfall
varies from under 1000 mm in the southeastern and northwestern coastal areas to over 5000 mm in the western
slope of the central hills. Therefore, Sri Lanka can be divided to four main climatic zones; wet zone,
intermediate zone, dry zone and arid zone. Air temperature of the country slightly vary throughout the year
except in the central highlands. In the lowland the mean annual temperature is observed to be 27°C with an
approximate daily range of 6°C. In the central highlands with altitude 2524 meters (Sujeewa, 2011).

                                           Figure 1: Study Area Map

| Volume 2 | Issue 6 |                                 www.ijmcer.com                                       | 89 |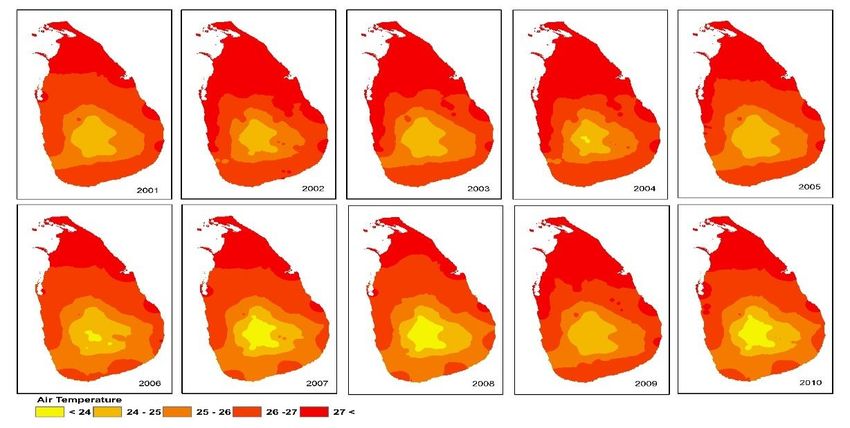
Spatiotemporal Characteristics of Long-Term Annual…

DATA: Annual average temperature data were analyzed for 57 major and minor meteorological stations
established by meteorological department of Sri Lanka over the country. Metrological stations have been
selected considering three major climatic zones (wet, intermediate and dry) in Sri Lanka. Temperature data were
extractedfrom the NASA/POWER satellite-based weather system for the above selected stations from 1981 to
2019 (39 years). The NASA POWER Data Access Viewer (DAV) contains meteorology related parameters and
according to the research conducted by Monteiro et al, 2017, indicated that there is a high positive significant
performance for air temperature and this study has proved that NASA/POWER products could be used as a
source of climatic data with a reasonable confidence for both regional and national spatial scales (Monteiro et al,
2017). Therefore, this study used this NASA/POWER meteorology database as the main data source.

METHODS: Spatial and Geostatistical analyses were used to fulfill the specific objectives of this study and
methods applied are describe below

Spatial Interpolation Techniques: Spatial interpolation was used to create surface maps and identified the
spatial pattern of the annual mean temperature in each year from 1981 to 2019. The cross validation method
was used to assess and compared the different interpolation surfaces and Root Mean Square Error (RMSE) were
adopted to evaluate the accuracy of the interpolation methods (Equation 1) for the obtained sample locations in
this study. RMSE indicates the deviation between estimated and actual values. Hence, smaller RMSE
contributes to better estimation capability (Ros&Tosaka, 2020).

         RMSE =                                         Equation

Where, Di is the observed SFH value and Ri is the estimated SFH value and n is the number of sample points.
This study used the IDW interpolation technique for preparing surface coverage which shows the lowest RMSE
value in the cross validation process. Also zonal statistical method in GIS was used to extract statistics of the
data for identifying the changes of air temperature.

Cluster and Outlier Analysis:Cluster and Outlier Analysis (Anselin Local Moran’s I) were used to identify the
statistically significant hot spots, cold spots and spatial outliers in the temperature values over Sri Lanka. The
analysis identified different types of geographical classes. At the first, this technique identified spots that have
either high or low values in concordance with their surroundings. Secondly, the analysis identifiedanomalies
areas where a spot has a value that very different from neighbors, whether much higher or lower. There are also
cases where no associations can be made (Sánchez-Martín et al, 2019). The mathematical equations for this
analysis uses by ESRI can be mentioned as follows;

                                                             Equation 2

                                        ͞ is the mean of the corresponding attribute, xi,jis the spatial weight
Where xi is an attribute for feature i, X
between feature i and j, and;

                                                        Equation 3

With n equating to the total number of features.
     I.      Regression Statistical Analysis
Simple regression analysis were conducted to examine the trend and correlation for the temperature over the
study area to understand the different physiographic factors (humidity and wind speed) influence on
spatiotemporal pattern of the temperature in Sri Lanka.

                                               III.     RESULTS
Spatiotemporal Variability of Air Temperature over Sri Lanka: Nearly fourdecades (39 years) data were
analyzed to examine the spatial and temporal changes of mean annual air temperature of Sri Lanka. The results
revealed that the air temperature of Sri Lanka has increasedby0.85oC with more fluctuations over the period of
1981 to 2019. When considering the spatial pattern of the air temperature, relatively high temperature areas can
be expected in the dry zone in Sri Lanka, whilst wet zone of the country has shown a downward trend. There is

| Volume 2 | Issue 6 |                                  www.ijmcer.com                                       | 90 |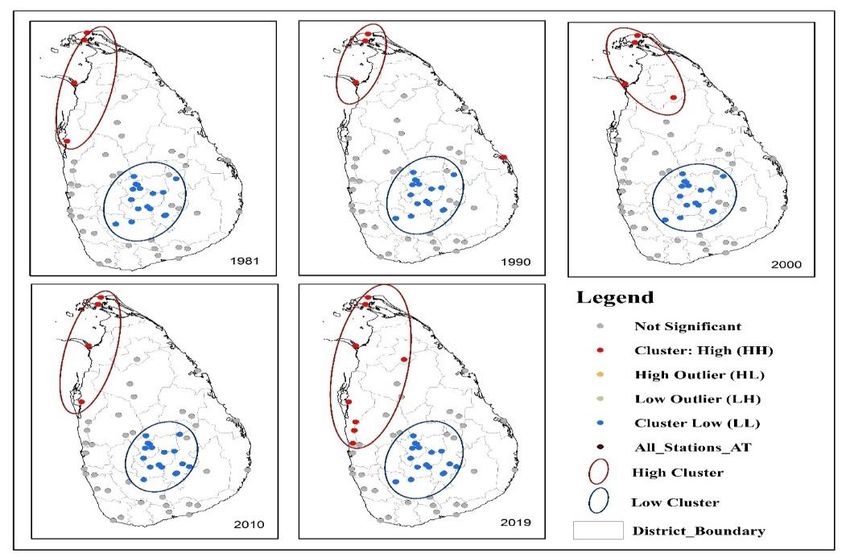
Spatiotemporal Characteristics of Long-Term Annual…
a slightly increasing trend (0.02oC per year) of mean air temperature in Sri Lanka and has clearly depicted it
with a slight positive trend (R2= 0.0117). The mean air temperature trend line from 1981 to 2019 has shown in
figure 2. However, the maximum air temperature of the country has increased from 1981 to 2019 and the
minimum temperature has also shown a slight upward trend during the study period. The maximum air
temperature has increased from 0.02154oC by annually. A few number of air temperature extremes can be
highlighted in 1984, 1987, 1995, 1999, 2008 and 2018. Except extreme air temperature of the study area it has
shown positive significant trend over 39 period.
27.5
27 y = 0.0038x + 26.273
R² = 0.0117
Temperature oC
26.5
26
25.5
25
24.5
24
1984
1991
1998
2008
2015
1981
1982
1983
1985
1986
1987
1988
1989
1990
1992
1993
1994
1995
1996
1997
1999
2000
2001
2002
2003
2004
2005
2006
2007
2009
2010
2011
2012
2013
2014
2016
2017
2018
2019
Year
Figure 2: Annual Mean Temperature Distribution (1981 - 2019)
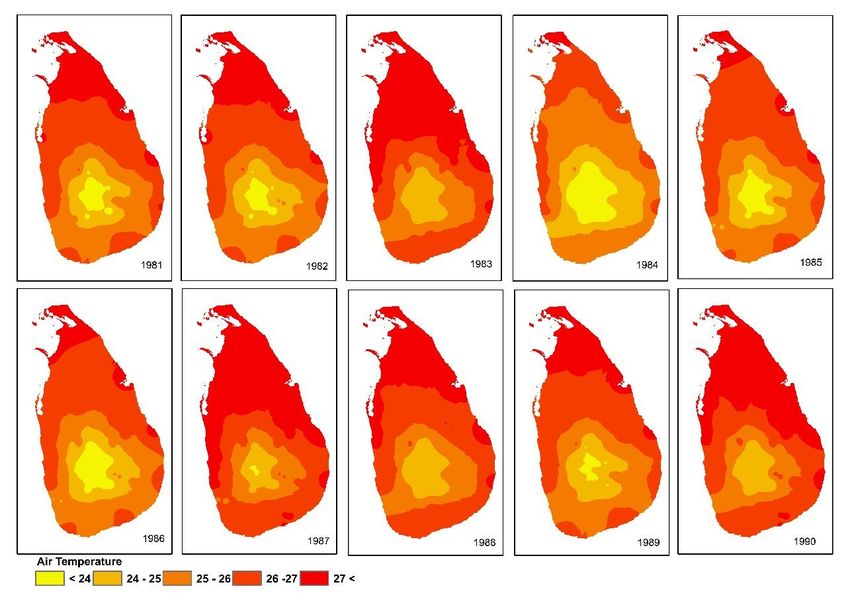
First Decade (1981-1990) : There is a slightly positive increment (0.05237oC per year). The highest mean
temperature of this ten years period has appeared in 1987 and the lowest in 1984. The values of those years were
26.7oC and 25.3oC respectively. Except the air temperature of 1987 and 1984 extremes, the extent of the higher
and lower temperature has fluctuated during the study period. The higher temperature area has gradually
expanded towards the lower areas and covered area of the wet zone in Sri Lanka.
Figure 3: Spatiotemporal changes of Air Temperature (oC) from 1981 to 1990
Spatial variability of air temperature in the first study decades (1981-1990) can be shown in figure 3 and
generally, highest annual average air temperature area of the map (27oC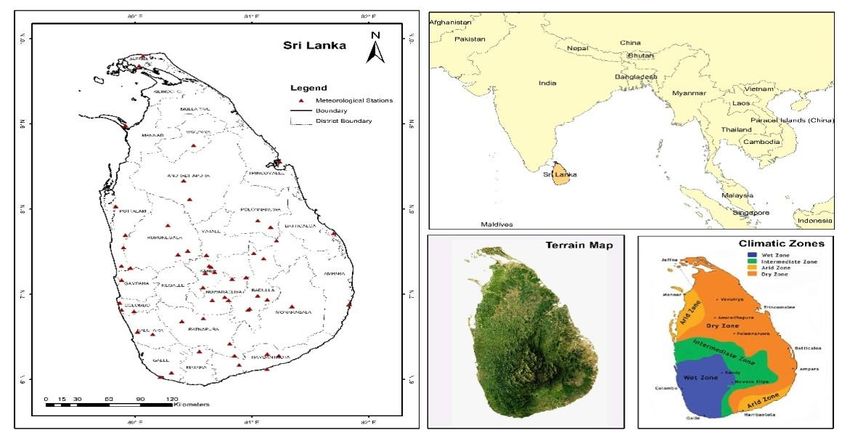
Spatiotemporal Characteristics of Long-Term Annual…

temperature values (
Spatiotemporal Characteristics of Long-Term Annual…
Figure 5: Spatiotemporal changes of Air Temperature from 2001 to 2010
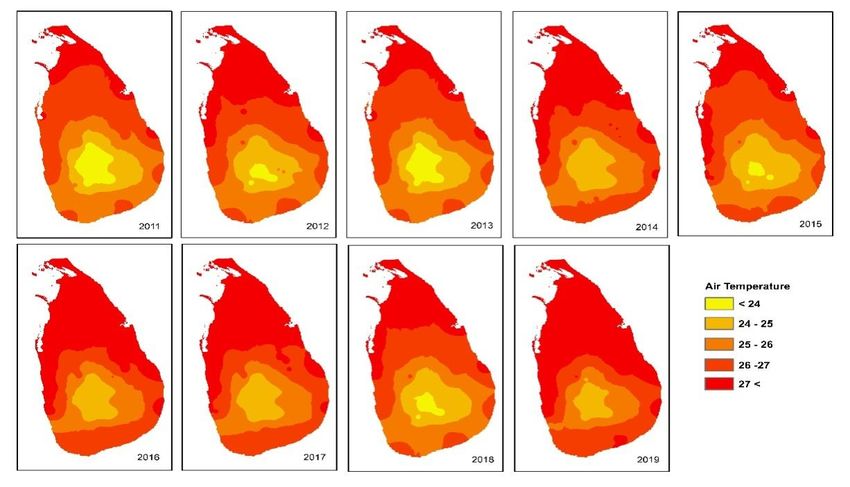
Fourth Decade (2001-20010):Again after 2010, it has dramatically increased with some fluctuations. The
temperature has increased from 0.10196oC annually throughout the decade.The highest mean temperature
can be seen in 2019 and the lowest can be seen in 2011. The values were 26.9oC and 25.9oC respectively.
Lower temperature area of the Sri Lanka has gradually decreased due to the increment of air temperature in
this decade. The spatial and temporal pattern of air temperature in 2011 to 2019 has shown in figure 6. The
spatial pattern of 2011-2019 decade can be seen lower temperature in the middle part of the country and the
area of the low temperature has fluctuated. In 2014, area of the highest temperature has expanded towards
the southern part of the country and low temperature areas cannot be seen. The same spatial pattern can be
seen in 2016 and 2017. Again small extend ofthe middle part can be seen in 2018 and in 2019, most of the
areas covered with high temperature values and the lowest temperature areas cannot be seen. Therefore, it
can be identified that the annual average air temperature of the central part of the country has increased.
Figure 6: Spatiotemporal changes of Air Temperature from 2011 to 2019
| Volume 2 | Issue 6 | www.ijmcer.com | 93 |Spatiotemporal Characteristics of Long-Term Annual…
When considering the temperature pattern of the study period, it shows a cyclic pattern and there is a decreasing
pattern from 1981 to 1994 and after that it shows increasing trend for next 10 years. However after 2005 it has
again changed for the next 10 years until 2015 and after that it has increased again. Difference of the
temperature values from the mean can be shown in figure 7.
Figure 7: Standard Deviation of Mean Air Temperature from 1981 to 2019
CLUSTER AND OUTLIER ANALYSIS FOR ANNUAL AIR TEMPERATURE: The cluster and
outlier analysis allowed to both groupings and areas where anomalies exist. It helped to identify the critical
areas and expansion of different clusters. The results indicated that the two prominent clusters in the country;
such as high-high cluster and low-low clusters. High-high cluster mainly describes the critical areas and such an
area can be identified in the northwest part of the country. High-high cluster has expanded in 2019. At the first,
in 1981 this cluster can be identified in Jaffna and Mannar districts. However, in 2019 it has expanded
toafewmore districts; Vaunia and Puttalm.The low-low clusters of air temperature can be identified in the
central part of the country. NuwaraEliya, Kandy, Badulla and Ratnapura are the administrative districts mainly
come under low-low cluster.Almost all these districts belong to the wet zone of the country.
Outlier in which a high value is surrounded primarily by low values, and Outlier in which a low value is
surrounded primarily by high values. However, high and low outlier clusters cannot be identified of annual
mean air temperature in this study area. The results of the cluster and outlier analysis can be shown in figure 8.
Figure 8: Cluster and Outlier Analysis for selected years.
| Volume 2 | Issue 6 | www.ijmcer.com | 94 |Spatiotemporal Characteristics of Long-Term Annual…
III INCREASING TREND OF ANNUAL AIR TEMPERATURE
Based on the regression analysis, the annual average air temperature of Sri Lanka has shown slightly increasing
trend (R2=0.0117) from 1981 to 2019. Jaffna is the area which shows highest increasing trend in air temperature
and NuwaraEliya shows the decreasing air temperature trend in the country during the study period. The R2
values were 0.4256 and 0.0067 respectively (figure 9).
Figure 9: Trend of Annual Air Temperature in Jaffna and NuwaraEliyafrom 1981 to 2019.
Most of the metrological stations located in the wet zone have shown the increasing trend of annual air
temperature during the study period. Especially in Colombo, Bandarawela, Galle and Katunayake have shown a
positive significant trend over the study period and R2 were 0.1423, 0.0351, 0.0124 and 0.1531 respectively
(figure 10). Finally, the results can be concluded that the annual average air temperature of the country has
increased during the study period (1981-2019) and significant spatial changes also can be identified over the
study area.
Figure 10: Trend of Annual Air Temperature in Colombo, Bandarawela, Galle, Katunayake .
IV. DISCUSSION
This study mainly focus to identify the spatiotemporal changes of annual average air temperature over Sri Lanka
from 1981 to 2019. The overall temporal changes of air temperature has slightly increased with some
fluctuations. A few extremes of air temperature can be identified every decade and some global changes
(climate change, El Niño and La Niño, sea level rise, GHGs) can be influenced on extreme changes of air
temperature in Sri Lanka. Also, both physiographic and anthropogenic factors can be directly or indirectly
caused to the increment of annual air temperature. However, according to the literature, El Niño and La Niño
impact can be taken as the most prominent influencing factor.
According to the results of the study, the first decade of the study period has shown slight increasing trend over
Sri Lanka and two distinct extremes can be identified in 1984 and 1987. The highest annual temperature value
| Volume 2 | Issue 6 | www.ijmcer.com | 95 |Spatiotemporal Characteristics of Long-Term Annual…
recorded in 1987 and the lowest in 1984. The strong El Niño event recorded in the 1987-1988 and La Niño
werein 1984-1985 (NOAA, 2020) have influenced on the highest and lowest air temperature in this decade.
Also, same trend were happened in the second decade of the study period (1991-2000). There were two distinct
extremes recorded in 1995 and 1999. The El Niño and La Niño recorded in the 1995-1996 and 1999-2000
(NOAA, 2020) may have influenced on this air temperature extremes. After 2000, there were decreasing trend
in 2001 to 2010 and La Niño impact of this decade were very high Again there were increasing trend from 2011
to 2019.
Also two temperature clusters can be identified over Sri Lanka and high-high cluster can be seen in the
northwest part of the country or dry zone of the country. Low-low cluster was belongs to the wet zones of Sri
Lanka. It can be clearly discussed that the topographical changes and rainfall pattern has highly influenced on
annual air temperature changes in the country.
V. CONCLUSION
This study aimed to identify the long-term spatial and temporal changes of annual air temperature in Sri Lanka
and the NASA POWER dataset was used to extract annual average air temperature in the country. Spatial
interpolation, cluster and outlier analysis and statistical methods were used to identify the spatiotemporal pattern
of air temperature in the country. The results of the study revealed that, the annual average temperature has
slightly increased from 1981 to 2019. However, it has shown some extremes and those extremes can be well
correlated with the impact of El Niño and La Niño events. In the decade of 2001 to2010, the temperature has
shown downward trend and after 2010 again it has shown upward trend until 2019. Also, two distinct clusters
were identified in the northwest and middle part of the country and most of the meteorological stations located
in the country have shown an increasing trend of annual air temperature from 1981 to 2019. Both physiographic
and anthropogenic factors can influence and global changes also can be well correlated with this trend.
Therefore, this study will help for researchers to understand the past and current trend of annual air temperature
variation and it can be applied for many future researches. Also, decision makers can take appropriate decisions
to minimize the future risk over the study area.
REFERENCES
1. Along Zhang, Ruizhong Gao, Xixi Wang, Tingxi Liu, L. F. (2020). Historical Trends in Air Temperature ,
Precipitation, Water, https://doi.rg/10.3390/w12010074.
2. Bilbao, J., & Rom, R. (2019). Temporal and Spatial Variability in Surface Air Temperature and Diurnal
Temperature Range in. https://doi.org/10.3390/cli7010016
3. Brunet, M., Jones, P. D., Sigro, J., Saladie, O., Aguilar, E., & Moberg, A. (2007). Temporal and spatial
temperature variability and change over Spain during 1850 – 2005. 112, 1–28.
https://doi.org/10.1029/2006JD008249
4. Characteristics, S., Climatemedieval, O. F., & Revisited, T. (2011). CHARACTERISTICS OF CLIMATE.
June, 1487–1500. https://doi.org/10.1175/BAMS-D-10-05003.1
5. Datsenkoa, N. N. Ivashchenkoa, D. M. Sonechkinb, Q. Q. Chunc, and B. Y. (2011). Spatiotemporal
Scaling of Surface Air Temperature Fields in China Russian Meteorology and Hydrology, Vol. 36,
N(April), 239–243. https://doi.org/10.3103/S1068373911040030
6. Gnanapragasam, N., Vithanage, M., Hyun-Han Kwon , M. C. M. Iqbal, S. Pathmarajah, Obeysekera, J.
(2018). Five Decadal Trends in Averages and Extremes of Rainfall and Temperature in Sri Lanka.
Advances in Meteorology, December. https://doi.org/10.1155/2018/4217917
7. José-Manuel Sánchez-Martín, & Blas-Morato, J.-I. R.-G. 2 and R. (2019). Hot Spot Analysis versus
Cluster and Outlier Analysis : An Enquiry into the Grouping of Rural Accommodation in Extremadura (
Spain ). https://doi.org/10.3390/ijgi8040176
8. Krinner, G., Germany, F., Shongwe, M., Africa, S., France, S. B., Uk, B. B. B. B., Germany, V. B., Uk, O.
B., France, C. B., Uk, R. C., Canada, M. E., Erich, M., Uk, R. W. L., Uk, S. L., & Lucas, C. (2013). Long-
term Climate Change: Projections, Commitments and Irreversibility.
9. Nagamuthu, P. (2019). Temporal and Spatial Variations of the Atmospheric Temperature in the Northern
Province of Sri Lanka. International Research Journal of Environmental Sciences, May 2016, 136.
https://www.researchgate.net/publication/331973683%0ATemporal
10. Nieto-isidro, S. (1998). Spatial and temporal patterns of annual precipitation variability over the Iberian
Peninsula. 0088(November 2018). https://doi.org/10.1002/(SICI)1097-0088(19980315)18
11. Panda, A. (2019). Trend analysis of seasonal rainfall and temperature pattern in Kalahandi , Bolangir and
Koraput districts of Odisha , India. June, 1–10. https://doi.org/10.1002/asl.932
12. Ros, F. C., & Tosaka, H. (2018). Analysis of rainfall distribution in Kelantan river basin , Malaysia.
02020, 1–8.
| Volume 2 | Issue 6 | www.ijmcer.com | 96 |Spatiotemporal Characteristics of Long-Term Annual…
13. Samanta, S., Pal, B., & Pal, D. K. (2011). Modeling of Monthly Mean Air Temperature through Remote
Sensing and GIS techniques. March 2014.
14. Subarna, D., Mdqjnd, W., Whodk, S., Ghqjdq, G., & Nhfhqghuxqjdq, X. M. L. (2017). Analysis of Long-
Term Temperature Trend as an Urban Climate Change Indicator.
15. Sujeewa, K. D. (2011). EMPIRICAL ANALYSIS OF TEMPERATURE CHANGE IN SRI LANKA
DURING THE LAST 140 YEARS ( 1871-2010 ) By K . D . SUJEEWA A Master ’ s Thesis Submitted to
the Institute of Environmental Science and Meteorology College of Science University of the Philippines
Dilim. June.
| Volume 2 | Issue 6 | www.ijmcer.com | 97 |You can also read