2020 U.S. Houzz Kitchen Trends Study - Houzz Inc.
←
→
Page content transcription
If your browser does not render page correctly, please read the page content below
2020
U.S. Houzz Kitchen
Trends Study

                 © Houzz Inc.   1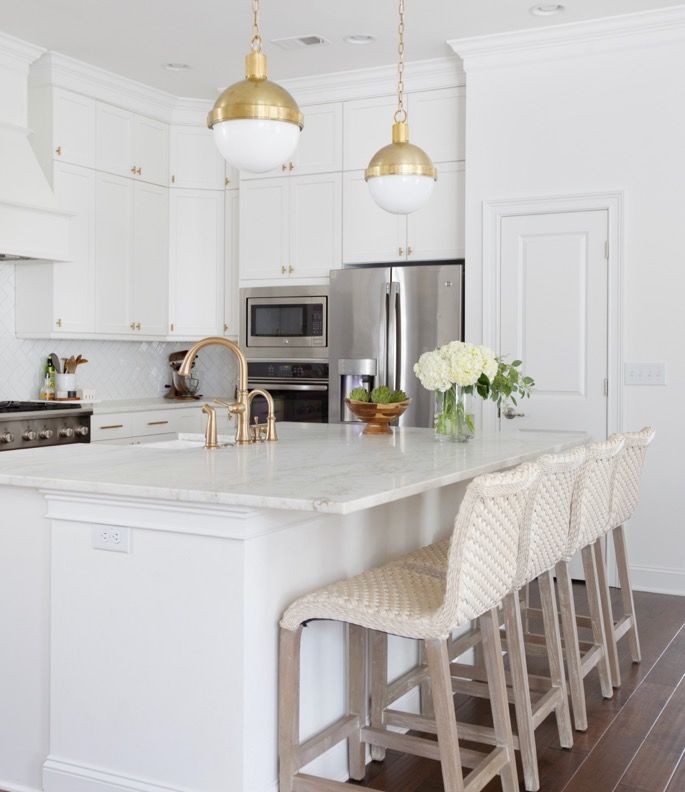
© Houzz Inc.
Contents

Big Ideas                  3

Scope & Spend              4

Look & Feel                15

Products & Features        20

Methodology & Appendixes   31

                                © Houzz Inc.   2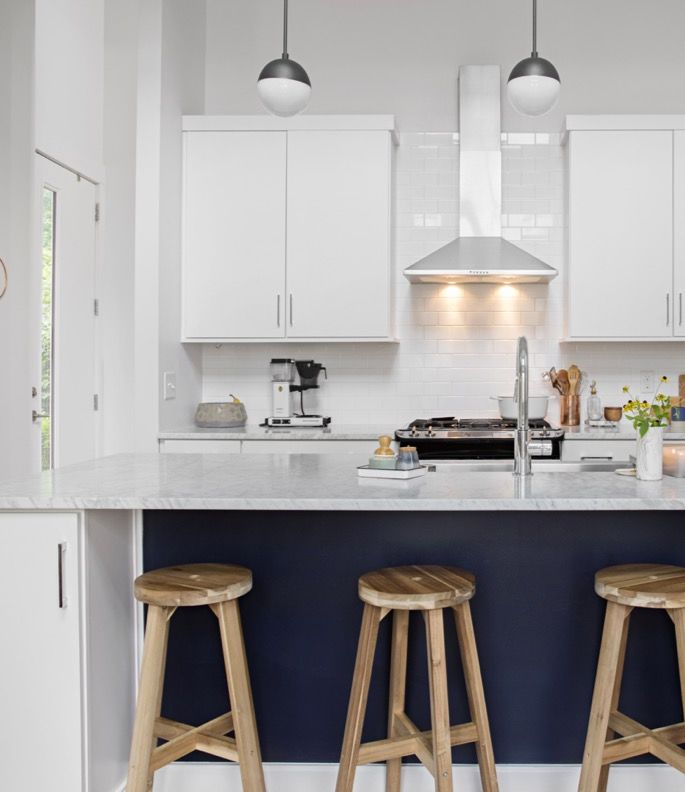
Big Ideas

                                                                                The Island Is a Crown Jewel of the Kitchen                Farmhouse Loses Steam, Full-Wall Backsplash Emerges

                                                                                Islands are a prominent feature in a renovated kitchen,   Transitional style, followed by contemporary style,
                                                                                with one in two homeowners opting to add a new            continues to lead in popularity among homeowners
                                                                                island or upgrade an existing one. Storage and over-      changing their kitchen’s style (21% and 16%,
                                                                                head lighting are the norm in upgraded islands (98%       respectively). The third most popular style is new, as
                                                                                and 92%, respectively). Over half of islands house new    modern style springs forward (15%) and farmhouse style
                                                                                appliances (52%) such as microwaves and                   loses steam (11%). In a surprising twist, homeowners
                                                                                dishwashers. Additionally, sizable proportions and        who upgrade their backsplash are embracing a feature
                                                                                standout colors make many islands pop. For example,       wall, installing the backsplash from the countertop all
                                                                                gray and blue are top choices for 39% of contrasting      the way up to the ceiling (11%) or to the upper cabinets
                                                                                island cabinets, while white and wood are top picks for   or range hood (63%). That said, neutral palettes still
                                                                                29% of contrasting island countertops.                    prevail in today’s upgraded kitchens.

                                                                                Kitchen Spend Increases, Project Scope Retracts           Features on the Rise

                                                                                Financial investment in kitchen projects continues to     Blue in kitchen walls is an emerging trend, appearing in
                                                                                grow, with median spend on major remodels                 7% of upgraded kitchens (up from 5% last year).
                                                                                completed in mid-2019 at $35,000, up 17% from a year
                                                                                ago ($30,000). However, the breadth of kitchen            Hardwood returned to the No. 1 spot in flooring
                                                                                renovations has declined for the second year in a row.    materials (29%), while vinyl/resilient flooring took the
                                                                                For example, upgrades to countertops and sinks are        No. 3 spot (14%).
                                                                                not as widespread (89% and 83%, respectively)
                                                                                compared with two years ago (94% and 90%). Similar        After rapid gains in market share from 2016 to 2018,
                                                                                trends apply to opening the kitchen to other interior     engineered quartz continued its rise in countertop
This report is designed for an 11-by-17-inch page format. To print on 8.5-
by-11-inch paper, select Fit to Page in the print settings prior to printing.   rooms and changing the layout or size.                    materials but at a slower rate (to 51% versus 48% a
                                                                                                                                          year ago).
                                                                                © Houzz Inc.                                                                                                         3
© Houzz Inc.
Scope & Spend

                © Houzz Inc.   4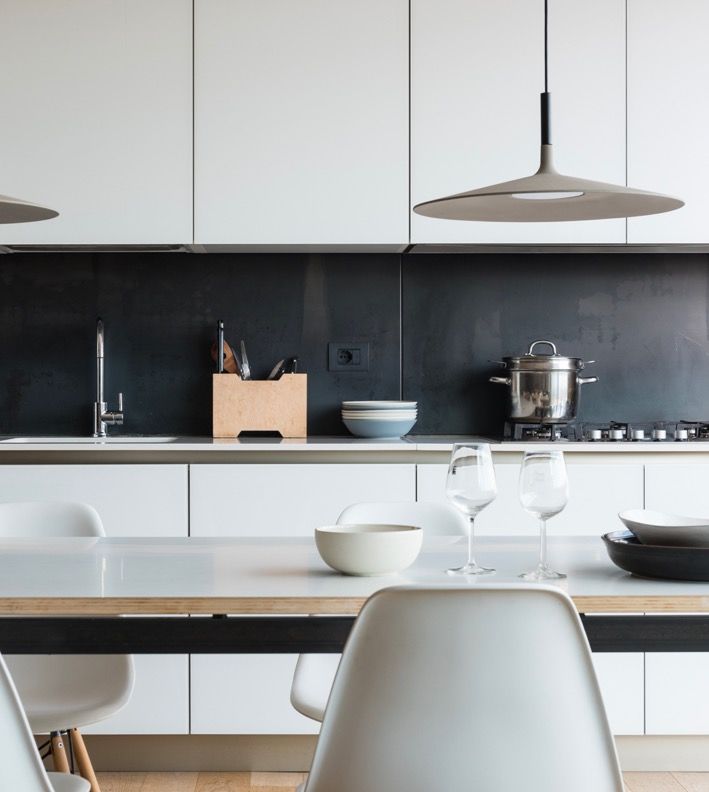
Most of Us Wait for
the Right Time to Renovate
                                                                              Kitchen Renovation Triggers*
“Wanted to do it all along and finally have the means” is                                                      2018   2019   2020
now the top reason to renovate a kitchen (37%), with
“can no longer stand the old kitchen” moving to the No.                       Wanted to do it all    37% #
                                                                              along and finally
2 spot (34%). As with master bathroom renovations, the                                               33%
                                                                              have the means
decision to remodel is increasingly triggered by old                                                 36%
kitchens that have deteriorated or broken down (27%).
In fact, kitchen deterioration is at the highest level seen
                                                                              Can no longer          34%
in Houzz’s five-year history of tracking kitchen project
                                                                              stand the old
motivators and is a testament to the aging housing                            kitchen                34%
stock in the U.S.                                                                                    40%

                                                                              Wanted to              31%
                                                                              personalize a
                                                                              recently purchased     29%
                                                                              home                   31%

                                                                              Old kitchen            27% #
                                                                              deteriorated or
                                                                                                     17%
                                                                              broke down
                                                                                                     20%

*Percentages reflect proportion of homeowners who have completed, are
currently working on or are planning a kitchen renovation during 2019-20      Recently inspired to   13%   #

(2020 study), 2018-19 (2019 study) and 2017-18 (2018 study).                  make certain           9%
#Percentage    point difference between 2020 and 2019 study findings; shows   changes
only statistically significant differences at 90% confidence levels.                                 9%

                                                                              © Houzz Inc.                                    5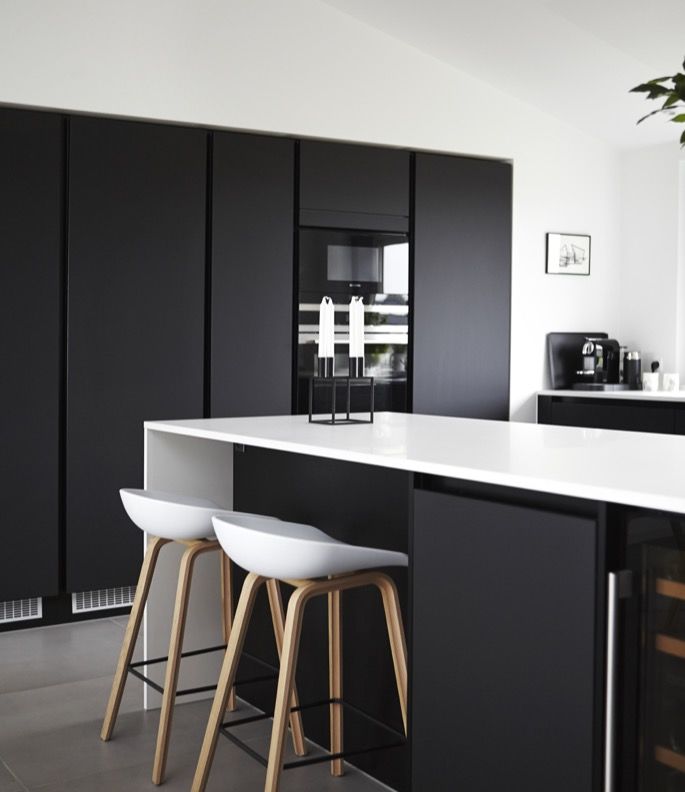
Our Spend on Kitchens
Continues to Rise
                                                                          National Median Spend* on Major and Minor Kitchen Remodels**   Mid-2018
Median spend on major kitchen remodels completed in                                                                                                 Mid-2019
mid-2019 was $35,000, a 17% increase compared with
remodels completed in mid-2018 ($30,000). This is
consistent with an increase in median spend on major
remodels completed throughout 2018 relative to
projects completed throughout 2017, as reported in the                                    $35,000
annual Houzz & Home Study ($30,000 versus $28,000,                        Major Remodel
respectively).
                                                                                          $30,000
A major kitchen remodel is roughly four times more
expensive than a minor remodel, which had a median
spend of $8,000.

                                                                                          $8,000

                                                                          Minor Remodel

                                                                                          $8,000

*Median spend reflects spend of homeowners who had completed a kitchen
remodel by mid-2019 (2020 study) and by mid-2018 (2019 study).

**Major kitchen remodel is one in which at least all the cabinets and
appliances are replaced. Minor kitchen remodels are all other remodels.

                                                                          © Houzz Inc.                                                                    6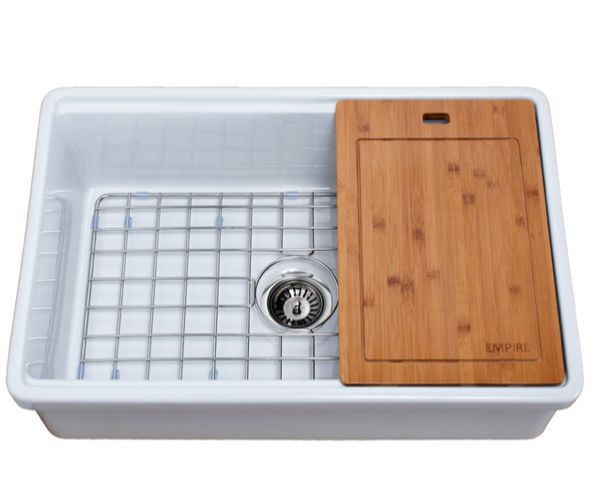
Homeowners in San Jose,
CA, Are Top Spenders
Among the top 50 U.S. metropolitan areas by                             Top 15 U.S. Metropolitan Areas1 by Median Spend* on Major and Minor Kitchen Remodels**
population, San Jose had the highest median spend
on major kitchen remodels in the last two years
                                                                        Metropolitan Area                       Major Remodel                          Minor Remodel
($50,000). Other major cities on the West Coast (San
Francisco), in the Midwest (Milwaukee) and on the                       San Jose, CA                              $50,000                                $12,250
East Coast (Boston and Washington, D.C.) share the
                                                                        San Francisco, CA                         $40,000                                $13,000
second-place spot ($40,000). Las Vegas, Pittsburgh
and San Antonio, Texas, have the lowest spend on                        Boston, MA                                $40,000                                 $6,000
major kitchen remodels. (See Appendix A for median                      Washington, DC                            $40,000                                 $8,000
spend in the top 50 U.S. metropolitan areas by
                                                                        Milwaukee, WI                             $40,000                                 $6,000
population.)
                                                                        Seattle, WA                               $39,203                                 $9,000
                                                                        Los Angeles, CA                           $35,000                                $10,000
                                                                        New York, NY                              $35,000                                 $9,000
                                                                        San Diego, CA                             $35,000                                $10,000
                                                                        Denver, CO                                $35,000                                 $5,000
1Top 50 U.S. metropolitan areas by population are defined per the       Providence, RI                            $35,000                                 $4,000
Cumulative Estimates of Resident Population Change in 2016 by the
U.S. Census Bureau.                                                     Philadelphia, PA                          $34,000                                 $8,000
*Median spend on kitchen remodels is from 2018 and 2019 Houzz &
Home Studies.
                                                                        Sacramento, CA                            $33,000                                $10,000
**Major kitchen remodel is one in which at least all the cabinets and   Portland, OR                              $32,900                                 $7,800
appliances are replaced. Minor kitchen remodels are all other
remodels.                                                               Louisville, KY                            $32,000                                 $5,000

                                                                        © Houzz Inc.                                                                                   7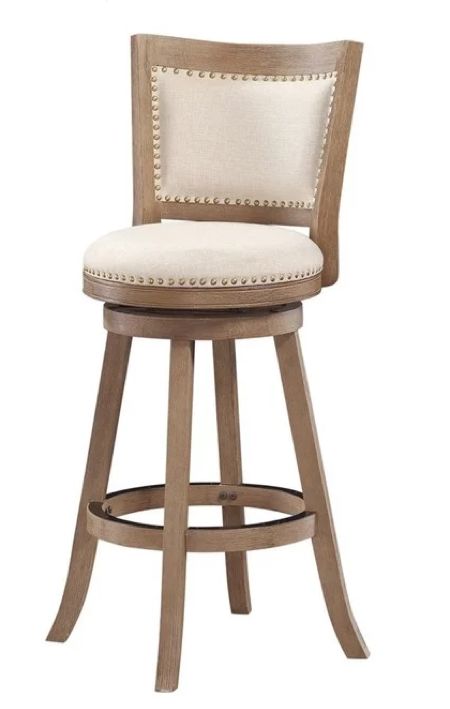
Yet, Our Remodels Are
Smaller in Scope
                                                                             Feature Upgrades During Kitchen Renovations*
A large majority of homeowners replace major
features in their kitchens during renovation, with
countertops and backsplashes the most popular                                                 Countertops      89%   #-   4pp
upgrades. That said, for the second year in a row,
homeowners are scaling back the breadth of                                                     Backsplash      84%   #-   3pp

upgrades. For example, upgrades to countertops and
                                                                                                     Sink(s)   83%   #-   2pp
sinks are not as widespread (89% and 83%,
respectively) compared with two years ago (94% and                              Faucets/plumbing fixtures      81%
90%). (See Appendix B for more information.)
                                                                                              Light fixtures   79%

                                                                                                   Flooring    67%

                                                                                            Appliances (all)   55%

                                                                                                 Wall finish   49%   #
                                                                                                                         - 3pp

                                                                                       Appliances (some)       31%

                                                                                                  Windows      28%   #-   4pp

                                                                                              Interior doors   20%
*Percentages reflect proportion of homeowners who have completed,
are currently working on or are planning a kitchen renovation during
2019-20.                                                                                     Exterior doors    19%   #
                                                                                                                         - 3pp

#Percentage point difference between 2020 and 2019 study findings;
shows only statistically significant differences at 90% confidence levels.                      Electronics    11%

                                                                             © Houzz Inc.                                        8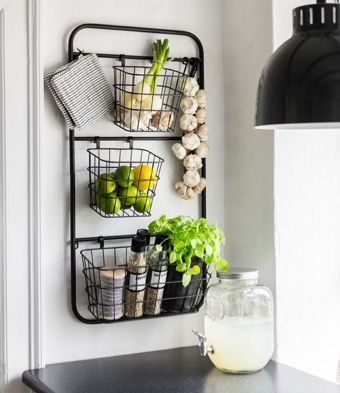
We’re More Likely to Go With
the Current Room Flow…
                                                                             Changes to How Kitchen Opens to Nearby Spaces*
Consistent with the overall reduced scope of kitchen
renovations, the popularity of open-concept upgrades
is not as widespread (46%) as it was last year (53%).
                                                                              More open to interiors   46%   #
                                                                                                                 - 7pp# - 7pp
That said, if a kitchen is made more open, it is
increasingly integrated with the nearby interiors
without any wall separation (64%) compared with two
years ago (58%). Additionally, one in five homeowners                        More open to outdoors     20%
continues to open the kitchen to outdoor spaces
(20%), with a double- or single-door setup most
popular.
                                                                             New Opening to Nearby Interiors**                                   New Opening to Outdoors***

                                                                             Completely open – no wall
                                                                             separation                                         64%   #
                                                                                                                                          +6pp   Via double doors or row of doors   56%
                                                                             Somewhat larger (via double or row of
*Percentages reflect proportion of homeowners who have completed,
are currently working on or are planning a kitchen renovation during         doors, or wide opening)                            21%              Via single door                    28%
2019-20.

**Percentages reflect proportion of homeowners who are making their
kitchen more open to nearby interior spaces as part of their completed,
                                                                             Via single door or narrow opening                  11%   # -5pp     Via pass-through window            12%
current or planned kitchen renovation during 2019-20.

***Percentages reflect proportion of homeowners who are making their
kitchen more open to outdoor spaces as part of their completed,
                                                                             Via pass-through window                            6%               Complete open-air setup            6%
current or planned kitchen renovation during 2019-20.

#Percentage point difference between 2020 and 2019 study findings;
shows only statistically significant differences at 90% confidence levels.   In other ways                                      9%               In other ways                      9%

                                                                             © Houzz Inc.                                                                                            9
…and More Likely to Keep
the Current Layout and Size
                                                                             Major Changes During Kitchen Renovations*
Major kitchen modifications, such as changes to
layout or room size, are still in high demand (46% and                               Upgraded systems         49%
35%, respectively), although not as widespread
compared with 2018 (50% and 42%, respectively).
                                                                                        Changed layout        46%   #-4pp

Partly because of the size increases, one in two
renovated kitchens is 200 square feet or larger (49%)
                                                                                            Modified walls    41%
and only a small share fall under 100 square feet (14%).

                                                                                       Modified ceilings      13%

                                                                                            Modified floors   5%

                                                                                Changed room location         5%

                                                                             Change in Size of Renovated Kitchen*                            Final Size of Renovated Kitchen*

                                                                                                                                  #+
                                                                                                                                       7pp
                                                                             About the same                                 65%              Less than 100 square feet          14%
                                                                                                                                  #-
                                                                                                                                   4pp
*Percentages reflect proportion of homeowners who have completed,
are currently working on or are planning a kitchen renovation during
                                                                             Somewhat larger (up to 50%)                    29%              100 to 199 square feet             37%
2019-20.
                                                                                                                                  #-
                                                                                                                                   3pp
                                                                                                                            6%                                                  49%
#Percentage point difference between 2020 and 2018 study findings;           Significantly larger (more than 50%)                            200 square feet or more
shows only statistically significant differences at 90% confidence levels.

                                                                             © Houzz Inc.                                                                                         10
We Still Seek Cabinet
Upgrades, Even If Minor
Cabinet Upgrades During Kitchen Renovations*
Nearly every homeowner performs some work on the 68%
kitchen cabinets during renovation (94%). While most
None, no cabinet upgrades
choose to replace all cabinets (68%), one in four opts
for partial cabinet upgrades (27%). Refinishing the Partial upgrades to cabinets
cabinets’ exterior is the most popular partial upgrade
(64%). Replacing some cabinets (25%) or adding some Complete cabinet replacement
cabinets (7%) are also options. Other variations
include replacing just the doors or refinishing the
interior. 27%
6%
Improvements Among Partial Cabinet Upgrades**
Refinishing the exterior 64%
Replacing some cabinets 25%
Replacing doors only 18%
*Percentages reflect proportion of homeowners who have completed,
are currently working on or are planning a kitchen renovation during
2019-20. Refinishing the interior 14%
**Percentages reflect proportion of homeowners who are partially
upgrading kitchen cabinets as part of their completed, current or
planned kitchen renovation during 2019-20. Adding some cabinets 7%
© Houzz Inc. 11We Pour Our Efforts
Into a New Island
Island Changes During Kitchen Renovations*
Nearly two-thirds of renovated kitchens feature an
island (61%). A third of homeowners add an island if
they didn’t already have one (33%), while others
upgrade an existing island (22%) or keep their island Add a new island 33% No change, no island 39%
as is (5%).
Upgrade an existing island 22% No change, keep island as is 5%
Changes to the kitchen floor plan don’t stop there.
Among the 46% of renovating homeowners changing
the layout of cabinets and appliances, an L-shaped New Layout Among 46% Upgrading Layout**
layout is No. 1 (40%), followed by a U-shaped layout
(30%). L-shaped 40%
U-shaped 30%
Galley 14%
Single wall 7%
*Percentages reflect proportion of homeowners who have completed,
are currently working on or are planning a kitchen renovation during G-shaped 7%
2019-20.
**Percentages reflect proportion of homeowners who are changing the
kitchen layout as part of their completed, current or planned kitchen
Other 12%
renovation during 2019-20.
© Houzz Inc. 12Service Providers
Remain in High Demand
Top Service Providers Hired During Kitchen Renovations*
The mild reduction in kitchen renovation scope 2018 2019 2020
appears to have no bearing on the hiring of service
providers, with hiring levels as high now (85%) as two
years ago (84%). Remodelers (general contractors and 52%
50% 51%
kitchen remodelers) continue to be the top category
of hired help (61% combined).
25%
22%
20%
14% 14% 13%
12% 12% 11% 11% 11% 10%
General contractor Kitchen designerInterior designer or decorator Architect Kitchen remodeler
Overall Pro Hiring* Hiring of Specialty Service Providers
(Without a Project Manager)**
2020 85% 2020 19%
*Percentages reflect proportion of homeowners who have completed,
are currently working on or are planning a kitchen renovation during
2019-20 (2020 study), 2018-19 (2019 study) and 2017-18 (2018 study). 2019 83% 2019 19%
**Specialty service providers include electricians, plumbers, tile
specialists, cabinetmakers and other trades. Project managers include
general contractors and remodelers. 2018 84% 2018 24%
© Houzz Inc. 13We Cook and Feel
Healthier in a New Kitchen
Top Activities in the Kitchen Following Renovation*
Nearly all homeowners cook in their kitchen post-
renovation (94%), and a third of homeowners report
they lead a healthier lifestyle after the project (33%). Cooking 94%
Over two-thirds of homeowners also eat or dine in Eating/dining 70%
their renovated kitchen (70%).
Baking 60%
Among those who added or upgraded their kitchen Entertaining 53%
island, 58% use it for dining. Other top activities
Socializing 44%
around the island include entertaining (49%) and
socializing (45%). Doing work 23%
Watching TV 13%
Reading 10%
Other 2%
Change in Lifestyle After Kitchen Renovation* Top Activities (Non-Cooking/Baking) Around
the Island After Kitchen Renovation**
More healthy 33% Eating/dining 58%
*Percentages reflect proportion of homeowners who have completed a
Equally healthy 66% Entertaining 49%
kitchen renovation during 2019.
**Percentages reflect proportion of homeowners who have a kitchen
island and who have completed a kitchen renovation during 2019.
Less healthy© Houzz Inc.
Look & Feel
© Houzz Inc. 15Farmhouse Style Retracts,
Modern Marches Forward
Style Change During Renovations*
Among the 85% of renovating homeowners who
change their kitchen style, transitional and
contemporary styles continue to lead in popularity.
Modern style is third (15%) after gaining market share
2018 88% 2019 82% 2020 85% #
relative to the last two years (11% in 2019 and 10% in
2018). Similar to style trends in master bathrooms,
Top Kitchen Styles Following Style Changes** 2018 2019 2020
farmhouse style appears to have lost steam (11%) after
increases in the previous two years (14% in 2019 and 21%
12% in 2018). (See Appendix C for more information on Transitional 21%
kitchen styles over time.) 26%
16%
Contemporary 15%
16%
15% #
Modern 11%
10%
*Percentages reflect proportion of homeowners who have completed, 11%
are currently working on or are planning a kitchen renovation during
2019-20 (2020 study), 2018-19 (2019 study) and 2017-18 (2018 study).
Traditional 12%
10%
**Percentages reflect proportion of homeowners who are changing the
kitchen style as part of a completed, current or planned kitchen
renovation in 2019-20, 2018-19 and 2017-18. 11% #
Farmhouse 14%
#Percentage point difference between 2020 and 2019 study findings;
shows only statistically significant differences at 90% confidence levels. 12%
© Houzz Inc. 16White Cabinets Hold Steady,
Islands Stand Out
Top Cabinetry Colors*
White cabinets continue to be popular in the kitchen 2018 2019 2020
(45%), while wood-tone cabinets collectively occupy
the No. 2 position (22%). Two in five homeowners who
are adding or upgrading their kitchen island choose a 45%
43% 43%
contrasting color for the island cabinets. Gray and
blue are the most popular colors for contrasting island
cabinetry (26% and 19%, respectively). (See Appendix
D for more information on kitchen colors over time.)
13% 15% #
11% 11% 10%
9% 8% #
7% 6% 6% 6%
4%
White Medium wood Gray Multicolored Light wood
Top Contrasting Cabinetry Colors Appearing in 39% of Upgraded Islands**
*Percentages reflect proportion of homeowners who have completed,
are currently working on or are planning a kitchen renovation during
2019-20 (2020 study), 2018-19 (2019 study) and 2017-18 (2018 study). Gray 26% Medium wood 11%
**Percentages reflect proportion of homeowners who are adding or
upgrading a kitchen island with storage and opting for cabinetry color
distinct from the main cabinetry color as part of a completed, current or Blue 19% Dark wood 7%
planned kitchen renovation in 2019-20, 2018-19 and 2017-18.
#Percentage point difference between 2020 and 2019 study findings;
shows only statistically significant differences at 90% confidence levels.
Black 11% White 7%
© Houzz Inc. 17Contrasting Color on Island
Countertops Is on Trend
Top Countertop Colors*
While the color of countertops has held steady, with 2018 2019 2020
white and multicolored surfaces topping the charts
(31% and 25%, respectively), more than one in four
added or upgraded islands features a contrasting 31% 31%
countertop color (29%). Wood-tone island countertops 27% 27% 26%
25%
are the most popular option (35%), whether in medium
(21%), light (9%) or dark (5%) wood. White trails at 23%,
followed by gray and multicolored.
16% 15%
(See appendix D for more information on kitchen
13%
colors over time.) 11% 10%
10%
5% 6% 5%
White Multicolored Gray Black Beige
Top Contrasting Countertop Colors Appearing in 29% of Upgraded Islands**
*Percentages reflect proportion of homeowners who have completed,
are currently working on or are planning a kitchen renovation during
2019-20 (2020 study), 2018-19 (2019 study) and 2017-18 (2018 study).
White 23% Multicolored 10%
**Percentages reflect proportion of homeowners who are updating or
adding a kitchen island and opting for countertop color distinct from
the main countertop color as part of their completed, current or
Medium wood 21% Light wood 9%
planned 2019-20 kitchen renovation.
Gray 10% Dark wood 5%
© Houzz Inc. 18Neutral Colors
Still Rule
Top Colors*
The colors of walls, backsplashes, flooring and
appliances in renovated kitchens have remained
relatively stable in the last few years. Renovated Walls Flooring
kitchens continue to feature neutral tones of gray, Gray 30% Wood** 52%
white and beige on wall surfaces. Wood tones
dominate in flooring, while stainless steel maintains its White 24% Gray 13%
grasp on appliances. That said, many of us are going
for alternative looks with blue walls (7%), beige Beige 20% Brown 10%
flooring (9%) and black appliances (9% in black
stainless or 6% in other black). (See appendix D for Blue 7% # +2pp
Beige 9%
more information on kitchen colors over time).
Green 5% Multicolored 7%
Appliances Backsplash
Standard
73% #+3pp White 35%
stainless
Black
9% Multicolored 20%
stainless
*Percentages reflect proportion of homeowners who have completed, White 7% Gray 15%
are currently working on or are planning a kitchen renovation during
2019-20.
Black 6% Beige 8% #-2pp
**Wood is a combination of wood-light, wood-medium and wood-dark.
#Percentage point difference between 2020 and 2019 study findings;
shows only statistically significant differences at 90% confidence levels. Gray 2% Blue 6%
© Houzz Inc. 19© Houzz Inc.
Products & Features
© Houzz Inc. 20Feature Wall from
Countertop to Ceiling
Top Materials in Upgraded Backsplashes*
In a surprising twist, homeowners who upgrade their
backsplash are embracing a feature wall, installing the
backsplash from countertop all the way to the ceiling Ceramic or porcelain tile 57%
(11%) or up to the upper cabinets or range hood (63%).
The rest opt for partial coverage (25%) between the
countertop and upper cabinets or range hood (21%) or Marble 10%
the ceiling (4%). Ceramic or porcelain tile continues to
dominate in kitchen backsplashes (57%), followed by
Granite 6%
marble (10%).
Quartz (engineered) 6% #- 2pp
Quartzite 3%
Coverage of Upgraded Backsplashes*
Up to the Cabinets or Range Hood Up to the Ceiling
Full coverage 63% Full coverage 11%
*Percentages reflect proportion of homeowners who are updating the
backsplash as part of their completed, current or planned 2019-20
kitchen renovation. Partial coverage 21% Partial coverage 4%
#Percentage point difference between 2020 and 2019 study findings;
shows only statistically significant differences at 90% confidence levels.
© Houzz Inc. 21Large Islands With Abundant
Storage Are Key
Storage Configurations in Upgraded Island*
Nearly all homeowners who add or upgrade an island
include at least some storage in it (98%), with cabinets
with doors (79%) or drawers (70%) most popular. Cabinets with doors 79%
Rectangular or square islands are most common
(84%), and one in three (32%) are quite large,
exceeding 7 feet in length. Drawers 70%
Open shelves 12%
Other 7%
No storage 2%
Average Length of Upgraded Island* Shapes of Upgraded Island*
Less than 6 feet 29% Rectangle or square 84%
*Percentages reflect proportion of homeowners who are adding or
upgrading a kitchen island as part of a completed, current or planned
2019-20 kitchen renovation.
6 to 7 feet 39% L-shape or U-shape 11%
More than 7 feet 32% Other 5%
© Houzz Inc. 22Shaker-Style
Cabinets Dominate
Primary Door Style of Upgraded Cabinets* Primary Make of Upgraded Cabinets*
Renovating homeowners continue to choose Shaker
door styles for their upgraded cabinetry (61%), with
flat-panel a distant second (21%). Interestingly, over Shaker 61% Custom 40%
one in ten added or upgraded islands features a
contrasting cabinetry door style (13%). Among the Flat-panel 21% Semicustom 36%
contrasting island upgrades, flat-panel (31%) or
Raised-panel 18% Stock 12%
louvered (27%) door styles are the most common,
while only 6% of upgrading homeowners opt for a Ready-to-
Glass-front 4% 11%
Shaker door style. Most cabinetry in the kitchen assemble
continues to be custom (40%) or semicustom (36%). Louvered 1% Other 2%
Open shelves only 1%
Other 3%
Top Contrasting Cabinetry Door Styles Appearing in 13% of Upgraded Islands**
*Percentages reflect the proportion of homeowners who are adding or
Flat-panel 31% Shaker 6%
replacing some or all of their cabinets as part of a completed, current
or planned 2019-20 kitchen renovation.
**Percentages reflect proportion of homeowners who are adding or
Louvered 27% Open shelves 2%
upgrading a kitchen island with storage and opting for cabinetry door
styles distinct from the main cabinetry door styles as part of their
completed, current or planned 2019-20 kitchen renovation. Glass-front 21% Other 13%
© Houzz Inc. 23Engineered Quartz Is the Darling,
Though Not Always in Islands
Top Materials in Upgraded Countertops*
After rapid gains in market share from 2016 to 2018 2018 2019 2020
(11% average annual growth rate), engineered quartz
continued its rise in 2020 but at a slower annual rate
of 5% (to 51% in 2020 versus 48% in 2019). The
51%
slowing growth is likely due to dramatic increases in 48%
43%
the price of engineered quartz imports from China.1
One in four island upgrades (26%) features a 34%
contrasting countertop material, with butcher block 30% 29%
(41%) preferred over engineered quartz (28%).
13% 12%
11%
8% 7% 7% 5% 5% 6%
Quartz (engineered) Granite Butcher block or wood slab Quartzite Laminate
Top Contrasting Countertop Materials Appearing in 26% of Upgraded Islands**
1 MarketWatch,“An Unexpected Victim of the Trade War: The Home
Improvement Industry,” October 16, 2019. (See video link.)
*Percentages reflect proportion of homeowners who are updating
Butcher block or wood slab 41% Marble 7%
countertops as part of their completed, current or planned kitchen
renovation during 2019-20 (2020 study), 2018-19 (2019 study) and 2017-
18 (2018 study). Quartz (engineered) 28% Quartzite 5%
**Percentages reflect proportion of homeowners who are adding or
upgrading a kitchen island and opting for a countertop material distinct
from the main countertop material as part of their completed, current or
planned 2019-20 kitchen renovation.
Granite 15% Solid surface 2%
© Houzz Inc. 24Microwaves and Dishwashers
Call Islands Home
Top Choices in Upgraded Appliances*
One in two renovating homeowners chooses to
replace all of the kitchen appliances (55%), and
Dishwasher(s) 75%
another third replace some (31%). The dishwasher,
refrigerator and microwave are the core replacements Refrigerator/freezer 74%
(75%, 74% and 72%, respectively). More than half Microwave 72%
(52%) of added or upgraded islands feature new Range 65%
appliances. Among these islands, nearly a third
Range hood 56%
include a microwave (32%) and dishwasher (31%), and
Garbage disposal 51%
many have garbage disposals (24%) and cooktops
(21%). Cooktop(s) 39%
Wall oven(s) 28%
Beverage refrigerator 15%
Wine refrigerator 12%
Washer/dryer 12%
Warming drawer 7%
Top New Appliances in 52% of Upgraded Islands**
*Percentages reflect proportion of homeowners who are updating
some or all of their appliances as part of their completed, current or
Microwave 32% Cooktop(s) 21%
planned 2019-20 kitchen renovation.
**Percentages reflect proportion of homeowners who are adding or
Dishwasher(s) 31% Beverage refrigerator 9%
upgrading a kitchen island and opting for new appliances in the island
as part of their completed, current or planned 2019-20 kitchen
renovation.
Garbage disposal 24% Range 8%
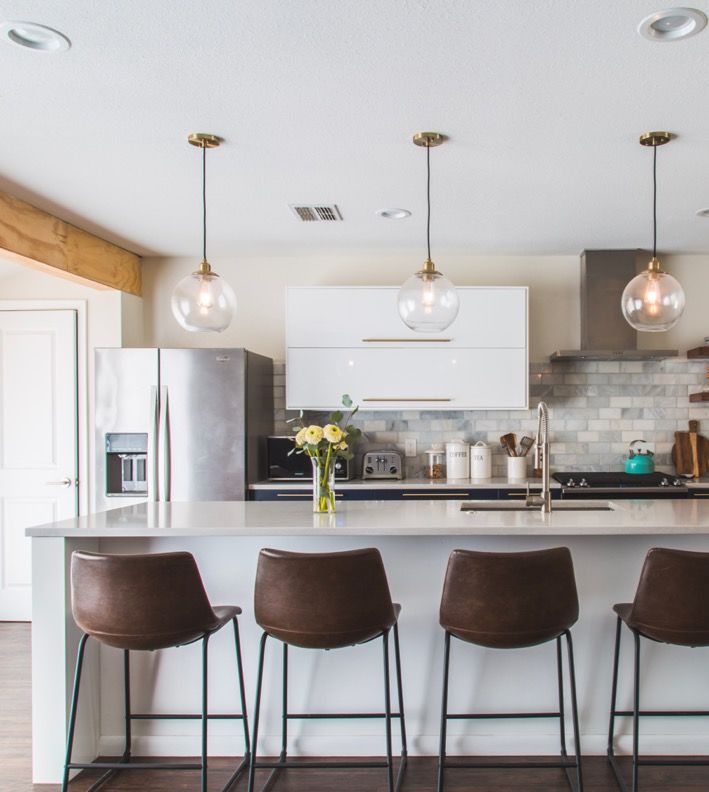
© Houzz Inc. 25Recessed Fixtures Reign;
Pendants Spotlight the Island
Top Choices in Upgraded Light Fixtures*
Among the 79% of renovating homeowners who 2019 2020
choose to upgrade light fixtures in the kitchen,
recessed lights continue to be the most popular 69%
Recessed lights
choice (69%). In contrast, the popularity of 67%
undercabinet lights, pendant lights and chandeliers
has declined relative to last year. Not surprisingly, # 65% #
Undercabinet lights
92% of homeowners who add or upgrade their 68%
kitchen island choose to install new light fixtures
above it. Pendant lights are the most common option # 56% #
Pendant lights
above the island (66%), with recessed ceiling fixtures 60%
a distant second (32%).
20%
Chandelier
23%
15%
In-cabinet lights
16%
Top Light Fixtures Appearing Above 92% of Upgraded Islands**
*Percentages reflect proportion of homeowners who are adding or
upgrading lighting as part of a completed, current or planned kitchen
renovation in 2019-20 (2020 study) and 2018-19 (2019 study).
**Percentages reflect proportion of homeowners who are adding or
Pendant lights 66% Chandelier 11%
upgrading a kitchen island and opting for light fixtures above it as part
of a completed, current or planned kitchen renovation in 2019-20.
#Percentage point difference between 2020 and 2019 study findings;
Recessed lights 32% Fixture with fan 3%
shows only statistically significant differences at 90% confidence levels.
.
© Houzz Inc. 26Vinyl Flooring Climbs
to the Top 3
Top Choices in Upgraded Flooring*
Natural hardwood has reversed a two-year decline in 2018 2019 2020
market share and returned to the No. 1 spot in flooring
materials (29%). This is likely explained by the rising 29% #
cost of wood-like materials such as engineered wood Stained or unstained hardwood 24%
and laminate, resulting from increased tariffs and 30%
other trade-related actions on imports from China.
Additionally, vinyl or resilient flooring continues to 23%
gain market share (14%), securing a spot among the Ceramic or porcelain tile 26%
three most popular flooring materials in the kitchen. 24%
14%
Vinyl/resilient 12%
10%
13% #
Engineered wood 17%
14%
9%
Laminate 11%
*Percentages reflect proportion of homeowners who are upgrading 10%
flooring as part of their completed, current or planned kitchen
renovation during 2019-20 (2020 study), 2018-17 (2019 study) and 2017-
18 (2018 study). 6%
#Percentage point difference between 2020 and 2019 study findings; Natural stone 8%
shows only statistically significant differences at 90% confidence levels.
7%
© Houzz Inc. 27Pantry and Storage
Solutions Abound
Pantry Upgrades During Kitchen Renovations*
Over half of renovating homeowners upgrade their
pantry, either via a pantry cabinet (45%) or walk-in
closet (7%). Consistent with last year’s findings, many
new cabinets are equipped with built-in specialty
Pantry cabinet 45% Walk-in pantry 7%
organizers or drawers. The most popular organizers
are for cookie sheets (50%), while the most common
specialty drawers are pullout waste or recycling Specialty Storage in Upgraded Cabinets**
drawers (63%).
By Organizer Type By Tray/Drawer Type
Cookie sheet/tray 50% Pullout waste or recycling 63%
Deep drawer 40% Revolving (lazy Susan) 40%
Spice 39% Pullout/swing-out 36%
Cutlery 36% Small-appliance 19%
Utensil 32% Pullout corner 19%
*Percentages reflect proportion of homeowners who have completed,
are currently working on or are planning a kitchen renovation during
2019-20. Pot and pan 31% Wine or bar 14%
**Percentages reflect proportion of homeowners who are adding or
replacing cabinets as part of their completed, current or planned
kitchen renovation during 2019-20. Dish 15% Pet feeding station 5%
© Houzz Inc. 28High-Tech Growth Slows
High-Tech Features in Upgraded Faucets* High-Tech Features in Upgraded Appliances**
Among those upgrading faucets and appliances, high-
tech features appear throughout; however, their
growth appears to have stalled. Half of upgraded
Overall 51% -7pp
# Overall 25% -5pp #
faucets are high-tech (51% versus 57% in 2019),
boasting water efficiency, no-fingerprint coatings or
touch-free activation. Similarly, a quarter of major Water efficiency 27% Wireless controls 14%
appliances have high-tech features (25% versus 30%
in 2019), with wireless controls leading the pack. No fingerprints 23% Color touch-screen display 12%
Charging stations and home assistants are just as
popular as last year. Touch-only/-free activation 19% Built-in apps (e.g., recipes) 5%
LED light display (temperature) 4% Built-in speakers 3% -3pp
#
LED light display (single color) 2% Smart meter connectedness 3%
Voice-activated controls 2%
*Percentages reflect proportion of homeowners who are adding or
upgrading faucets as part of their completed, current or planned 2019-
20 kitchen renovation.
**Percentages reflect proportion of homeowners who are updating
some or all of their appliances as part of their completed, current or
planned 2019-20 kitchen renovation.
Select Electronics Upgrades***
***Percentages reflect proportion of homeowners who are updating
electronics as part of their completed, current or planned 2019-20
kitchen renovation.
#Percentage point difference between 2020 and 2019 study findings;
shows only statistically significant differences at 90% confidence levels.
Docking/charging station 49% Home assistant 31%
© Houzz Inc. 29Kitchen
Bestsellers
The top five kitchen categories for the Houzz Shop in Kitchen Kitchen
Faucets Sinks
2019 are shown here, including a bestseller for each.
Bar
Range
Stools
Hoods
Pendant
Lights
Links to the product, clockwise from left: Stainless Steel VIGO Pull-Out Spray
Kitchen Faucet, Tosca Reversible Farmhouse Single Bowl Sink,/Cutting-
Board, 24" Melrose Counter Stool, Ariella Ovale Glass Pendant Lamp, St.
AKDY 30" Wall Mount Stainless Steel Button Panel Kitchen Range Hood
Cooking Fan
© Houzz Inc. 30© Houzz Inc.
Methodology
& Appendixes
© Houzz Inc. 31Methodology
Approach Sampling and Weighting
Houzz is an all-in-one resource for homeowners Data were gathered via a link in the Houzz newsletter
working on a home renovation or decorating project. sent out by email twice a week to registered Houzz
Our large and engaged user community is able to users. The link invited homeowners to share their
provide unprecedented insights on the latest market kitchen project details, and people who did not meet
trends based on users’ home improvement activity. We the qualification criteria above were then eliminated.
aggregate and share these insights with the community Respondents were notified that aggregate findings
to give people greater confidence in the choices they would be shared with the larger Houzz community to
make for their homes, and to give home professionals help others in completing their own kitchen
greater insights into their clients’ wants and needs. renovations. The final data were reweighted to ensure
With these goals in mind, Houzz conducted an online representativeness of the Houzz user populations,
quantitative survey of registered Houzz users using weights from the annual Houzz & Home Study.
regarding kitchen renovation projects, fielded between
June 19 and July 2, 2019. Completes and Qualifications
The 76-question survey gathered information from a
total of 2,598 users, who reported they were 18 or
older; homeowners; and had completed a kitchen
remodel or addition in the past 12 months, were
currently working on one or planned to start one in the
next three months.
© Houzz Inc. 32Appendix A
Top 50 Metropolitan Areas1 by Median Spend* on Major and Minor Kitchen Remodels**
Major Minor Major Minor
Metropolitan Area Metropolitan Area
Remodel** Remodel** Remodel** Remodel**
San Jose, CA $50,000 $12,250 Salt Lake City, UT $28,000 $5,000
San Francisco, CA $40,000 $13,000 Dallas, TX $27,000 $7,000
Boston, MA $40,000 $6,000 Hartford, CT $26,500 $9,000
Washington, DC $40,000 $8,000 Raleigh, NC $26,500 $5,000
Milwaukee, WI $40,000 $6,000 Riverside, CA $26,000 $6,000
Seattle, WA $39,203 $9,000 Columbus, OH $26,000 $5,000
Los Angeles, CA $35,000 $10,000 Miami, FL $25,000 $8,000
New York, NY $35,000 $9,000 Cleveland, OH $25,000 $7,000
San Diego, CA $35,000 $10,000 Virginia Beach, VA $25,000 $6,000
Denver, CO $35,000 $5,000 Detroit, MI $25,000 $6,000
Providence, RI $35,000 $4,000 Atlanta, GA $25,000 $6,000
Philadelphia, PA $34,000 $8,000 Phoenix, AZ $25,000 $6,000
Sacramento, CA $33,000 $10,000 Orlando, FL $25,000 $6,000
Portland, OR $32,900 $7,800 Indianapolis, IN $25,000 $7,000
Louisville, KY $32,000 $5,000 Nashville, TN $24,500 $7,650
Jacksonville, FL $30,000 $6,500 Charlotte, NC $24,000 $6,000
1Top 50 U.S. metropolitan areas by population are defined per the Baltimore, MD $30,000 $8,000 Richmond, VA $23,500 $7,700
Cumulative Estimates of Resident Population Change in 2016 by the
U.S. Census Bureau. Chicago, IL $30,000 $6,000 Kansas City, MO-KS $23,500 $6,300
Minneapolis - St. Paul, MN $30,000 $7,000 Austin, TX $22,500 $7,000
*Median spend on kitchen remodels is from 2018 and 2019 Houzz &
Home Studies. St. Louis, MO-IL $30,000 $5,000 New Orleans, LA $22,500 $5,000
Cincinnati, OH $30,000 $6,000 Tampa, FL $22,000 $7,250
**A major kitchen remodel is one in which at least all the cabinets and
appliances are replaced. Minor kitchen remodels are all other Houston, TX $30,000 $5,750 Las Vegas, NV $21,000 $8,000
remodels. Oklahoma City, OK $30,000 $5,500 Pittsburgh, PA $20,000 $6,000
***Median spend on kitchen remodels in U.S. metropolitan areas with Memphis, TN na*** $6,750 San Antonio, TX $20,000 $6,575
fewer than 30 responses is omitted from the table. Buffalo, NY $28,000 $4,750 Birmingham, AL na*** $6,000
© Houzz Inc. 33Appendix B
Feature Upgrades During Kitchen Renovations*
% change between
2018 2019 2020
2020 and 2018
Countertops 94% 93% 89% -5%
Backsplash 89% 87% 84% -5%
Sink(s) 90% 85% 83% -7%
Faucets/plumbing fixtures 87% 83% 81% -5%
Light fixtures 83% 80% 79% -4%
Flooring 74% 69% 67% -6%
Appliances (all) 60% 54% 55% -5%
Wall finish na 52% 49% na
Appliances (some) 31% 34% 31% 0%
Windows 37% 32% 28% -8%
Interior doors 22% 22% 20% -2%
Exterior doors 25% 22% 19% -6%
*Percentages reflect proportion of homeowners who have completed,
are currently working on or are planning a kitchen renovation during
2019-20 (2020 study), 2018-19 (2019 study) and 2017-18 (2018 study). Electronics 14% 11% 11% -3%
© Houzz Inc. 34Appendix C
Kitchen Styles After Style Upgrade*
2017 2018 2019 2020
Transitional 16% 26% 21% 21%
Contemporary 21% 16% 15% 16%
Modern 14% 10% 11% 15% #
Traditional 13% 10% 12% 11%
Farmhouse 11% 12% 14% 11% #
Craftsman 7% 4% 4% 4%
No particular style 1% 3% 2% 3%
Midcentury 2% 2% 3% 3%
Beach 3% 3% 4% 2%.#
Eclectic 4% 3% 3% 2%
*Percentages reflect proportion of homeowners who are changing the Rustic 2% 3% 3% 2%
kitchen style as part of a completed, current or planned kitchen
renovation in 2019-20 (2020 study), 2018-19 (2019 study) ,2017-18 (2018
study) and 2016-17 (2017 study). Scandinavian 1% 1% 1% 1%
#Percentage point difference between 2020 and 2019 study findings;
Other 6% 6% 6% 7%
shows only statistically significant differences at 90% confidence levels.
© Houzz Inc. 35Appendix D
Kitchen Colors After Kitchen Renovations*
Walls Cabinetry Countertops Backsplash Appliances Flooring
Gray 30% 10% 15% 15% 2% 13%
White 24% 45% 31% 35% 7% 3%
Beige 20% 4% 5% 0% 9%
8%-2pp#
Blue 7%+2pp# 3% 1% 6% 0% 1%
Green 5% 1% 1% 3% 0% 0%
Yellow 4% 0% 0% 1% 0% 0%
Multicolored 3% +1pp# 25% 20% 7%
7%+3pp# 1%-1pp#
Medium wood 0% 11%+4pp# 2% 0% 0% 29%
Light wood 0% 6% 1% 0% 0% 13%
Dark wood 0% 5% 1% 0% 0% 9%
Standard stainless 0% 0% 0% 1% 0%
73%+3pp#
*Percentages reflect proportion of homeowners who have completed,
are currently working on or are planning a kitchen renovation during
Black stainless 0% 0% 0% 0% 9% 0%
2019-20.
#Percentage point difference between 2020 and 2019 study findings; Other 6% 9% 17% 11% 8% 15%
shows only statistically significant differences at 90% confidence levels.
© Houzz Inc. 36You can also read