TORONTO'S FUTURE WEATHER & CLIMATE DRIVER STUDY: OUTCOMES REPORT
←
→
Page content transcription
If your browser does not render page correctly, please read the page content below
TORONTO'S
FUTURE
WEATHER &
CLIMATE
DRIVER
STUDY:

OUTCOMES
REPORT

Summary of the SENES
Consultants Ltd Study by
Toronto Environment Office   Less Snowfall Expected in 2040-2049 (in centimetres)
October 30, 2012             • 140 centimetres less in parts of Toronto
                             • 160 centimetres less on parts of the Oak Ridges Moraine

                                                                                         1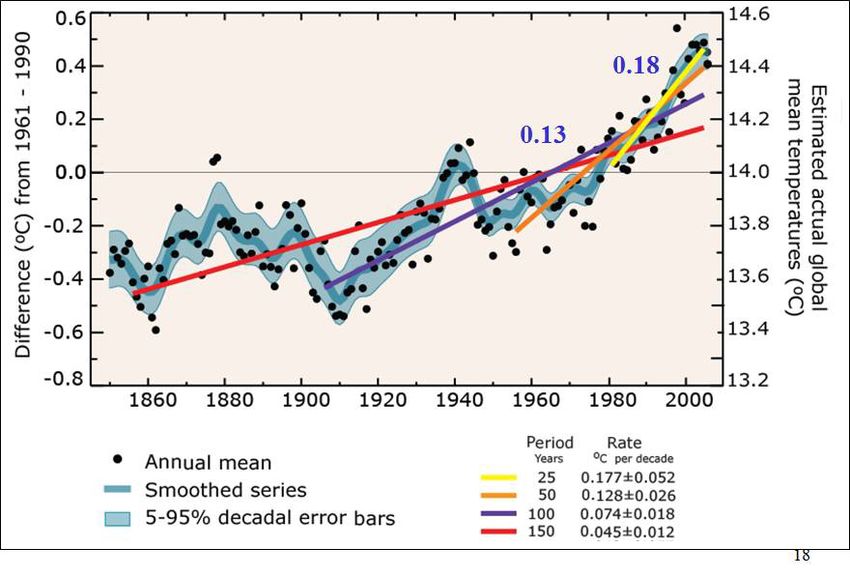
Why We Did What We Did                      INTRODUCTION
Clear Direction from City Council re:       In order to more effectively plan municipal infrastructure investment and provision of
policies and actions including              services, the City of Toronto needs to know what currently influences Toronto's
Climate Change Action Plan (2007)
                                            present weather and climate. The City needs to determine how these influences are
Ahead of the Storm (2008)                   likely to change, and how severe the consequences are likely to be in the future. In
                                            simple terms, the City of Toronto needs a better understanding of why Toronto gets
To Prepare the City for the Future          the weather and climate it gets now and what weather and climate it can expect to
                                            get in the future.
The City needed Toronto & GTA specific
Weather      &    Climate    Information
unavailable from Environment Canada.        For large cities with high density populations and concentrated critical infrastructure,
                                            climate and weather can have a significant impact on economic activity and municipal
                                            services. Existing global and regional climate models have not provided cities, such as
Toronto Environment Office uses             Toronto, with sufficiently tailored information to understand and address specific
an innovative approach to                   local future impacts.
modelling climate and weather.
                                            The Toronto's Future Weather & Climate Driver Study aims to help understand what
We combine modelling technologies           projections on future climate mean for the City of Toronto. By improving the level of
Global Climate Models (GCM)                 certainty about climate related weather changes, the City will be better guided in
Regional Climate Models (RCM)
Local Weather Models (WRF)
                                            making investment and budgetary decisions regarding infrastructure and service
                                            provision responsibilities.

                                            The study was undertaken by SENES Consultants, based in Richmond Hill. SENES
                                            works on projects around the globe and specializes in climate modelling. The Toronto
                                            Environment Office commissioned the study to support the City's climate change
                                            policies.
Advisors: Environment Canada, Ministry of
Environment, Toronto Region                 WHY DID THE CITY UNDERTAKE THE CLIMATE DRIVERS STUDY?
Conservation Authority

Consultants: SENES + Hadley UK              There are three reasons why the City cannot solely rely on the existing climate
                                            projections derived from Global and Regional Climate Models to fully understand
                                            current and future climate and weather patterns for Toronto:
                                                                                                                                  2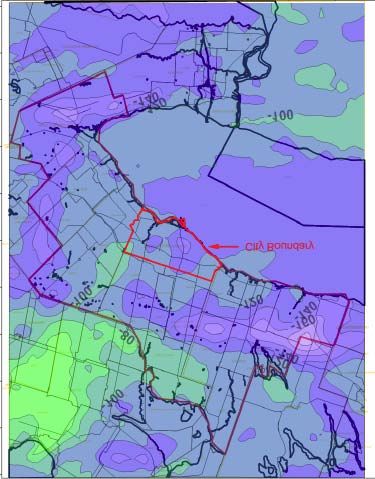
1) The Great Lakes – The Great Lakes have an important influence on Toronto's               New Approach
climate and weather. Without the Great Lakes, Toronto would have an extreme
continental climate instead of its more moderate continental climate. Global and            The approach was new and innovative when
                                                                                            this project was conceived.
regional climate models do not adequately represent the moderating effect of the
Great Lakes on the City's climate and weather. The implication is that the City cannot      The approach taken has been very successful
adequately predict future climate change impacts for Toronto from these models              (proved value of approach).
alone.
                                                                                            Approach subsequently adopted by the
                                                                                            National Center for Atmospheric Research, and
2) Lack of focus on urban climate and weather impacts – Large urban centres, such           by the Ministry of the Environment with the
as Toronto, comprise a small percentage of Canada's land mass. However, they are            University of Toronto.
home to a substantial percentage of Canada's economic activity and population (80%
of the Canadian population live in urban areas). Local impacts of future climate            To Answer New Questions
changes on city and urban populations are not sufficiently detailed in the global and
regional climate models to inform cost effective infrastructure planning and                Included Influence of the Great Lakes, Niagara
adaptation.                                                                                 Escarpment and the Oak Ridges Moraine.

                                                                                            Examined a 10 Year Period (not 30 Years)
3) The need for weather and climate 'extremes' rather than 'averages' – The
operation of critical infrastructure such as the electrical grid, water treatment plants,   Wanted data and information concerning the
sewers and culverts, public transport and roads are sensitive to particular                 future "extremes"-of-weather rather than the
temperature and weather thresholds. Beyond these thresholds infrastructure may              future "means"-of-climate.
have reduced capacity or may not function at all. While we cannot ignore gradual
climate change, variation in the patterns of extreme weather pose a particular              Recent Empirical Data
challenge to the operation of municipal and provincial infrastructure. The focus of
                                                                                            Globally, 2010 ranked as the warmest year on
global and regional climate models on climate averages are unlikely to provide cities,      record, as was 2005 and 1998 before it.
such as Toronto, with adequate insight into extreme weather projection changes              The 10 warmest years on record have all
necessary for prudent infrastructure management.                                            occurred since 1998.

                                                                                            Over the ten years from 2001 to 2010, global
Monitored weather events identified in Table 1 below (Environment Canada) show an
                                                                                            temperatures have averaged 0.46°C above the
increasing occurrence of record years between 2000 and 2009. This data suggests             1961-1990 average, and are the highest
that extreme weather events are changing more rapidly than predicted by the models          temperature increase ever recorded for a 10-
built around the standard 30-year climate averages.                                         year period since the beginning of
                                                                                            instrumental climate records.

                                                                                                                                        3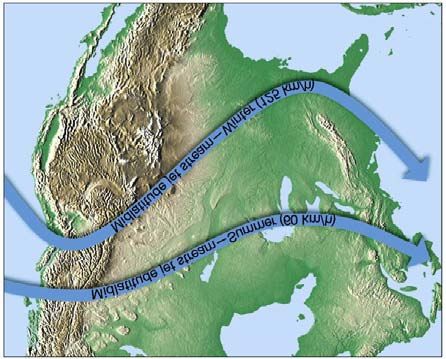
Table 1: Record Weather Events in Toronto by Year in the Period 2000-2009 Provide Rationale For Study

Year   Record Events
2000   Wettest summer in 53 years with 13% more precipitation than normal.
2001   Driest growing season in 34 years; first ever heat alert; 14 nights with temperatures above 20°C (normal is 5 nights).
2002   Driest August at Pearson Airport since 1937; warmest summer in 63 years; 5th coldest Spring.
2003   Rare mid-Spring ice storm – Pearson Airport used a month’s supply of glycol de-icer in 24-hours.
2004   Year without a summer; May rainfall in Hamilton set an all-time record; and another all-time record 409 mm rainfall
       was set at Trent University in July which was equivalent to 14 billion litres of water in 5 hours (a 200 year event).
2005   Warmest January 17 since 1840; January 22nd blizzard with whiteouts; warmest June ever; number of Toronto days
       greater than 30°C was 41 (normal is 14); August 19 storm washed out part of Finch Avenue.
2006   23 tornadoes across Ontario (14 normal); record year of major storms; record one-day power demand of 27,005 MW
       due to summer heat.
2007   Protracted January thaw; 2nd least snow cover ever in Toronto (half the normal amount); snowiest Valentine’s Day
       ever; chunks of ice fell from CN Tower; 2-3 times the normal number of hot days in the summer; record latest-in-
       season string of +30°C days around Thanksgiving.
2008   Toronto’s 3rd snowiest winter ever; record for highest summer rainfall.
2009   3rd rainiest February in 70 years; Hamilton had a 100-year storm; one of the wettest summers on record; tornados hit
       Vaughan-Woodbridge area in late August; an unusually mild and storm-free November in Toronto – Downtown had a
       record "no snow" for the first time ever – first snow-free November at Pearson Airport since 1937.
2012   Toronto's earliest ever official heat wave (June 19-21)

Also   Three 1 in 100 year storms in Toronto in less than 12 years: July 2000, August 2005, July 2012.

                                                                                                                                4
International Panel on Climate Change (IPCC)                                          Exponentially Increasing Rates of Temperature
Scenarios of Future Climate Driven by Population,                                     Change in the recent past and into the Future 2
Economics, and Technology Adoption1

                                                                                      Showing different rates (slopes) of change from the same
IPCC Emission Scenarios                                                               monitored temperature data set (1860-2010)
B1    Low Growth (Integrated World)
A1B   Moderate Growth (Balanced Energy Use)                                           This shows that the changes are occurring more rapidly now
A2    High Growth (Divided World)                                                     than before and that they should also be examined on smaller
                                                                                      and more recent time intervals in respect to City
The City's approach adopted Scenario A1B regarded as an upper-middle of               responsibilities.
the road scenario (i.e., not an extreme scenario) into the future. Also note
that A1B & A2 are essentially similar until 2060.
                                                                                      2
                                                                                        From Climate Change 2007: The Physical Science Basis. Contribution of Working
                                                                                      Group I to the Fourth Assessment Report of the IPCC [Solomon, S., D. Qin, M.
                                                                                      Manning, Z. Chen, M. Marquis, K.B. Averyt, M. Tignor and H.L. Miller (eds.)].
1
 From Pachauri, R.K. and Reisinger, A. (Eds.)"Climate Change 2007: Synthesis Report   Cambridge University Press, Cambridge, United Kingdom and New York, NY, US at
Contribution of Working Groups I, II and III to the Fourth Assessment Report of the   Technical            Summary              3.1             -            Accessed
Intergovernmental Panel on Climate Change, (2007) at p 46. Accessed at                athttp://www.ipcc.ch/publications_and_data/ar4/wg1/en/tssts-3-1-1.html
http://www.ipcc.ch/pdf/assessment-report/ar4/syr/ar4_syr.pdf

                                                                                                                                                                   5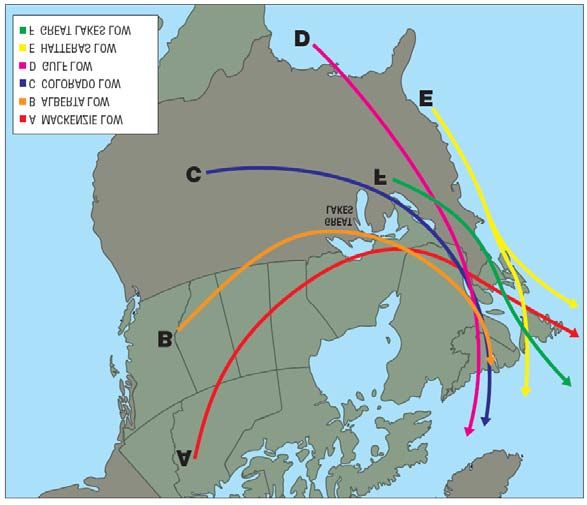
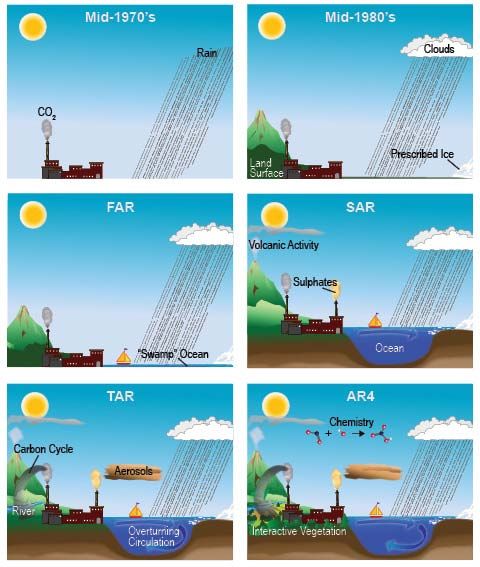
Global and Regional Climate Model Improvements                                          Model Improvements of Geographic Scale and Three
(from 1970 to 2010) in Physical and Chemical                                            Dimensional Computational Grid Resolution (1990-
Complexity3                                                                             2007) 4

More processes and better chemistry were included sequentially and                      Scale & Resolution of IPCC Assessment Reports (AR)
                                                                                               st                          nd
created increasing certainty in the results obtained.                                   FAR = 1 – 1990         SAR =      2 - 1996
                                                                                                  rd                       th
                                                                                        TAR = 3 - 2001           AR4 =    4 - 2007

3
  From Le Treut, H., R. Somerville, U. Cubasch, Y. Ding, C. Mauritzen, A. Mokssit, T.
                                                                                        4
Peterson and M. Prather, 2007: Historical Overview of Climate Change. In: Climate        From Climate Change 2007: The Physical Science Basis. Contribution of Working
Change 2007: The Physical Science Basis. Contribution of Working Group I to the         Group I to the Fourth Assessment Report of the IPCC [Solomon, S., D. Qin, M.
Fourth Assessment Report of the IPCC [Solomon, S., D. Qin, M. Manning, Z. Chen, M.      Manning, Z. Chen, M. Marquis, K.B. Averyt, M. Tignor and H.L. Miller (eds.)].
Marquis, K.B. Averyt, M. Tignor and H.L. Miller (eds.)]. Cambridge University Press,    Cambridge University Press, Cambridge, United Kingdom and New York, NY, US at
Cambridge, United Kingdom and New York, NY, USA. Chapter 1.2                            Chapter 1.5 Accessed at
                                                                                        http://www.ipcc.ch/publications_and_data/ar4/wg1/en/ch1s1-5.html
                                                                                                                                                                         6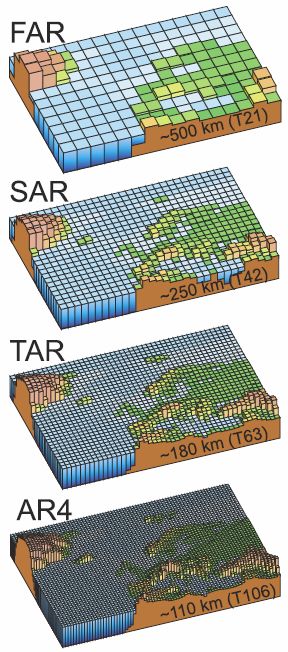
HOW DID WE APPROACH THIS STUDY?

Overcoming the limitations of global and regional climate models in understanding
localized climate and weather requires a unique approach. In consultation with
climatologists, meteorologists, hydrologists and climate adaptation specialists from
Environment Canada, the Ontario Ministry of the Environment and Toronto Region
Conservation Authority, SENES and the City of Toronto used existing Environment
Canada and United Kingdom Meteorological Office - Hadley Centre results from global
and regional climate models as input into a local-scale, weather forecasting research
model.
                                                                                        An example of a single grid cell within a
                                                                                        Global Climate Model of 300 km x 300 km
To appreciate the distinctiveness of the Toronto Climate Drivers Study approach it is   resolution.
necessary to understand the basics of global and regional climate models:

Global Climate Model (GCMs) - The standard approach to climate modeling has been
to use global climate models linked to data of climate averages for 30 year time
periods. These models operate at a course spatial resolution: a 300 km2 grid scale.
While remaining relevant to understanding climate impacts on national scale, this
modelling makes no differentiation in projected future climate averages for Toronto,
London, North Bay, or Muskoka due to its coarse grid scale, nor does it distinguish
between lakes versus lands, or high-lands versus low-lands, or urban versus rural
lands – all areas and conditions within a grid cell are described by their mean
condition.
                                                                                        An example of a single grid cell within a
Regional Climate Model – Allows refinement of global model results by introducing       Regional Climate Model of 40 km x 40 km
Regional Climate Models (RCMs) of medium resolution (typically in the range of 40 -     resolution.
100 km2 or larger). While providing greater geographic differentiation than global
models, they still do not adequately represent features such as the Great Lakes which   These two maps show the equivalent area of
are critical to explaining Toronto's weather and climate.                               one grid cell in which all weather data is
                                                                                        considered uniform. The maps do not
                                                                                        necessarily represent actual modelling grid
                                                                                        cells

                                                                                                                                 7
Weather Research Forecasting (WRF) Model - Developed jointly by the US National
                                          Centre of Atmospheric Research, the US National Oceanic and the Atmospheric
                                          Agency this model allows the output of spatially variable mean and extreme weather
                                          predictions that account for the influence of local geography and topography.

                                          The Toronto's Future Weather & Climate Drivers Study uses a sequential combination
                                          of these models. Results from global and regional models were fed into the Weather
                                          Research Forecasting (WRF) model of much finer spatial resolution to provide
                                          detailed estimates of Toronto's future local weather between 2040 and 2050 – a time
                                          horizon relevant to a large range of infrastructure replacement activities that City
                                          staff can reasonably envisage.
An example of grid cells in a Weather
Research Forecast (WRF) model of 1 km x   The result is a climate-weather model capable of operating at a very fine resolution (1
1 km resolution used in evaluation of     km2). This allows different climate and weather projections to be established for even
Toronto's future climate and weather.     small areas within Toronto (e.g. equivalent in area to small individual postal code
                                          areas or smaller areas within Scarborough, North York or Downtown) rather than only
                                          large regional areas such as southern Ontario or even larger provinces and nations.

                                          Having climate and weather projections physically down-scaled to this level is critical
                                          to addressing infrastructure impacts caused by extreme weather events similar to
                                          those that caused the Finch Avenue culvert collapse and road wash out of August 19
                                          2005.

                                          The results of the City's climate-weather model were compared against output from
                                          more traditional global and regional model combinations to verify performance. The
                                          City's results for were judged to be very good and within the range of theoretically
                                          expected results and in keeping with global and regional model output.

                                                                                                                               8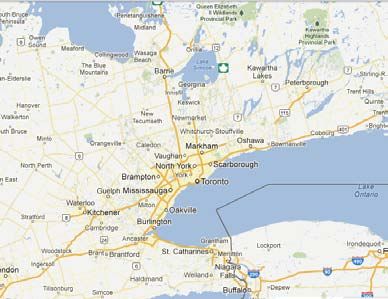
WHAT ARE "CLIMATE DRIVERS"?                                                                Common Winter Low Depressions -
                                                                                           Sources and Storm Tracks
The SENES Study references "Climate Drivers" in its title (Toronto's Future Weather &
Climate Driver Study) to reflect the significance of large scale meteorological features
and processes that determine or "drive" Toronto's day-to-day weather such as the
location of the Jet Stream and movement of major air masses. Climate models such
as global and regional climate models can predict potential climatic changes into the
future. These potential changes need to make sense and be consistent with our
understanding the laws of physics and known behaviours of weather systems.

Models that run equations and provide climate data output need to make sense in
light of our understanding of physical meteorological processes that we know operate
in the atmosphere now. For example:

   • Does the average position of the polar front jet stream move northward in             Source: Klok et al., 2002
     keeping with the predicted average temperature changes?
   • Are predictions of more intensive but fewer summer storms logically                   Summer and Winter Jet Streams
     consistent with increased occurrence of updrafts of warm air?
   • Does the influence of Lake Ontario and other Great Lakes continue to modify
     summer temperatures?
   • Is a reduction in winter snowfall accompanied by a corresponding increase in
     winter rainfall?

Identifying the climate drivers that control Toronto's present weather is a major part
of the study and an important way to corroborate the overall integrity of model data
and computer program assumption.

                                                                                           Source: University of Maryland, Department of
                                                                                           Atmospheric and Oceanic Science (2003)

                                                                                                                                           9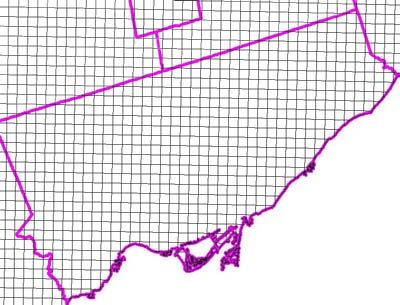
Confidence in Results using Mean                                                                SUPPORT FOR TORONTO'S APPROACH
Temperature as an example
                                                                                                Toronto's approach of adding output from climate models into a weather model in
Compared with Monitored Means (2000-09)                                                         order to obtain more locally relevant future weather predictions was cutting edge and
1) Toronto’s Climate-Weather Model v.1=
    o
8.70 C
                                                                                                innovative when conceived. It has been subsequently adopted by the National Center
2) Environment Canada’s Canadian Regional                                                       for Atmospheric Research (NCAR) for the whole of the USA as well as by the Ontario
                            o
Climate Model v.4.2.3 = 6.69 C                                                                  Ministry of the Environment in partnership with the University of Toronto.
                                     o
3) Monitored Data from Pearson = 8.73 C
                                                                                                THE RESULTS FOR TORONTO
Compared with Other Models (2040-49) GTA
                                o
Our forecast change of 4.4 C compares
favourably with Low Resolution Models                                                           The study predicts that climate change will continue to create different weather
                         o        o
showing changes from -2.7 C to 6.3 C                                                            patterns across Toronto in the future. Some changes can be regarded as being
                                                                                                positive - longer growing season, generally more pleasant weather and fewer City
                                                                                                resources required for winter snow clearance. However, other changes can be
Snowfall and Rainfall                                                                           regarded as being negative. Though a similar number of storms per year are
                         •        Less Snow & More Rain -- in Winter                            projected a fewer number of "heavy" storms (>25mm/day) are expected. However, a
                         •        More Rain in July (80%) & August                              small number of those "heavy" storms" will produce "very intense" storms and
                                  (50%)
                                                                                                produce much greater amounts of rainfall in short periods than previously seen with
                                                                                                clear impacts on city infrastructure (culverts and drainage management) and an
                                    Pearson Airport: Change 2000-2009 to 2040-2049
                        80                                                                      increased potential for flooding.
                        60

                                                                                                The changes (comparing 2000-2009 monitored data with modelled results for 2040-
 Difference in Amount

                        40
                                                                                     Rainfall
                                                                                     (mm)
                                                                                                2049) are predicted to be as follows:
                        20
                                                                                     Snowfall
                                                                                     (cm)
                                                                                                Precipitation - Snow and Rain
                         0

                        -20
                                                                                                   • Less snow and more rain in the winter
                        -40
                              Jan Feb Mar Apr May Jun Jul Aug Sep Oct Nov Dec                      • 26 fewer snow days per year, 9 less in December
                                                 Month
                                                                                                   • Slightly more precipitation (snow plus rainfall) overall
                                                                                                   • Marked rainfall increases in July (80%) and August (50%)
                                                                                                   • Extreme rainstorm events, fewer in number but more extreme

                                                                                                                                                                                  10
Temperature 4.4oC Average Annual Temperatures
• Average annual temperatures increase by 4.4oC Increase in Toronto
• The projected average winter temperature increase by 5.7oC.
• The projected average summer temperature increase by 3.8oC.
• The extreme daily minimum temperature rises by 13oC (i.e., becomes less
cold).
Wind
• Unchanged average wind speeds
• Reduced maximum wind speeds
• No changes in wind direction
Comfort Measures
• Reduced occurrences of Wind Chill
• Virtual disappearance of Wind Chill events with temperatures below -20°C;
• Humidex events greater than 20°C increase more than 60%
• The maximum Humidex increases from 48°C to 57°C
• The extreme daily maximum
temperature "becomes
Temperature Degree Days warmer" by 7.6oC (i.e.,
• Values below 18°C can be used to estimate the heating requirements of becomes warmer).
buildings. The occurrence of such degree days are expected to reduce by
almost a third - 31%
• Values above 24°C can be used to estimate the cooling requirements of
buildings. The occurrence of such degree days are expected to increase by
more than five times - 560% (i.e., from 32 degree-days to 180 degree days per
year)
11Extreme DAILY Rainfall CHANGES IN "EXTREMES"
• Fewer Precipitation Storms >25 mm
in Winter
Most global climate models assess changes in the averages that typify a climate. The
• Same Number of Storms in Summer
• BUT the Summer Storms will be Toronto Future Weather & Climate Drivers Study assessed these climate averages but
Much More Intense also extended the study to assess potential changes in the "extremes" of weather
(maximums and minimums). This included examining the changing likelihood, severity
Pearson Airport: Extreme DAILY Rainfall and durations of "extremes" such as heat waves and intense rainstorms.
180
160
140 Table 2 summarizes the changes expected to occur between the period 2000-2009
120
and the period 2040-2049. Key projections include:
Amount in mm
100 2000-2009
80 2040-2049
60
40
• Though the number of storms that occur in winter decrease, the number of
20 storms that occur in summer remains the same – but the maximum amount of
0
Jan Feb Mar Apr May Jun Jul Aug Sep Oct Nov Dec rainfall expected in any single day and in any single hour more than doubles.
Month
• The number of days when the humidex exceeds 40oC is expected to increase
fourfold.
• The number of degree days >24oC (a degree-day 5 occurs when the
temperature is higher than 24oC for 24 hours) - which is typically used as the
measure of air conditioning being required - increases six-fold.
• The number of "heat waves" (i.e., events with more than 3 consecutive days of
temperatures greater than 32OC) is expected to increase from an average of
0.57 occurrences per year, as in the period 1971-2000, to 5 occurrences per
year in the period 2040-2050.
5
For an explanation of what is meant by "degree days" please see:
http://www.oahpp.ca/resources/documents/Accumulated%20Degree%20Days.pdf
12Table 2: Projected Future Weather Changes Compared to Recent Weather
Annual Weather Annual Weather
Weather Type Parameter Units 2000-2009 2040-2049
Extreme Maximum Amount in One Day mm 66 166
Precipitation Number of Days with More Than 25mm days 19 9
Mean Annual Daily Maximum mm 48 86
100 year Return Period Maximum Daily mm 81 204
10 year Return Period Maximum Daily mm 62 135
10 year Return Period Maximum Hourly mm 20 39
Extreme Rainfall Maximum Amount in One Day mm 66 166
Number of Days with More Than 25mm days 16 9
Extreme Snowfall Maximum Amount in One Day cm 24 18
Number of Days with More Than 25cm days 16 3
o
Extreme Heat Maximum Daily Temperature C 33 44
Number of Days with Temperature > 30 oC days 20 66
Number of heat waves" (>3 consecutive days > 32OC* events 0.57** 2.53
o
Extreme Cold Minimum Daily Temperature C - 17 -11
Number of Days with Temperature < -10 oC days 25 0
Number of Days with Temperature < -0 oC days 128 70
o
Wind Chill Extreme Daily Wind Chill C eq. -24 -17
Number of Days with Temperatures > 20 oC days 12 0
Degree Days Number of Degree Days > 24 oC (A/C required) degree-days 31 180
Number of Degree Days > 0 oC degree-days 3452 4587
Number of Degree Days < 0 oC (Heat required) degree-days 440 66
Extreme Wind Maximum Hourly Wind Speed km/hr 92 48
Maximum Wind Gust Speed km/hr 130 75
Number of Days with Winds > 52 km/hr days 1 0
o
Humidex Maximum Humidex C eq. 48 57
Number of Days with Humidex > 40 oC days 9 39
Storms Average Number of Storms per Year 30 23
Average Number of Summer Storms per Year 16 17
Average Number of Winter Storms per Year 14 6
* Note: This data is not included in SENES Report Volume I. It is included in subsequent data extraction and analysis by SENES for the City.
**Derived from Meteorological Services Canada data recorded at Toronto Pearson International Airport.
13Modelling Future Extreme Storms is THE BENEFITS OF THE FUTURE WEATHER PREDICTIONS
Much Harder…. but ….
The study provides projections that can inform present and future infrastructure and
service decisions (e.g., water pipe sizing, heat resistance of road surface materials)
and policy development planning (e.g., heat wave responses, pest infestations).
By improving the level of certainty regarding the magnitude and frequency of
expected climate change, and particularly extreme weather events, the City is better
guided in making decisions regarding capital works investments and adjustments to
operational procedures. This may reduce the risk of unsustainable investment and
loss associated with infrastructure construction, maintenance and operations that do
not take into account extreme weather events and climate change projections.
THE CERTAINTY OF THE FUTURE WEATHER PREDICTIONS
The study predicts potential future outcomes based on the data and the modelling
capabilities of the recent past. The weather of the future will continue to change
rapidly and at an accelerating rate into the future. With the passing of years the
Storm of August 19th, 2005 certainty surrounding the outcomes in the study will need to be reassessed and the
study will need to be re-examined. The City can address this by maintaining a
a) Highest Rainfall is shown over Finch Avenue
watching brief of:
b) Captured by Modelling, but NOT by
Standard Environment Canada Monitoring at 1. The changing state of climate change science and predictions; and
Pearson International Airport (the best 2. The ongoing changes in weather extremes and means for Toronto; and
weather monitoring station for Toronto)
3. The significance, value and needs of timely adaptation and financing its costs.
because the centre of the storm was distant
from the airport monitoring station.
c) Monitoring stations can only identify what
happens at a particular station. Modelling can
identify what happens between stations. This
example typifies the benefits of not relying
purely on monitored data.
14SUMMARY AND CONCLUSIONS Future Warmer Temperatures
• Average annual temperatures increase by
o
Using a weather-climate model approach, this study projects the future weather 4.4 C
• Projected average winter temperature
changes that Toronto may expect in 2040-2049. The model combined an ensemble of o
increases by 5.7 C.
large-scale global and medium-scale regional climate model data as inputs to a local • Projected average summer temperature
scale Weather Research Forecast (WRF) model to predict successive hourly weather o
increases by 3.8 C.
conditions into the future, in and around Toronto.
• The extreme daily minimum temperature
o
The study is unique as it goes beyond the standard modelling means of rainfall and - “becomes less cold" by 13 C.
• The extreme daily maximum temperature
temperature and assesses extremes of temperature and precipitation. On average in - "becomes warmer" by 7.6 C
o
2040-2049, warmer annual average temperatures of 4.4oC are expected. For seasonal
averages winter temperatures are projected to increase by 5.7oC and summer Future Extreme Heat
temperatures by 3.8oC. Extreme daily maximum temperatures are projected to
increase by 7.6oC, but extreme daily minimum temperatures are projected to also rise • Mean Maximum Daily Temperature
by 13oC (i.e., becomes less cold). Less snow and more rain in the winters (26 fewer between (2000-2009) and (2040-49)
changes from . . . 33°C to 44°C
snow days per year) and fewer rainstorm events per year are anticipated. However,
the model predicts more extreme rainstorms and marked rainfall increases in July Maximum daily air temperature is recorded at
(80%+) and in August (50%+). a weather station by selecting the highest 1-
hourly air temperature within each 24-hour
Considering these results as part of City Council's decision making processes may aid period. (Averaged here over 10 years).
the City and the community better prepare and adapt to future climate change.
• Number of days per year with
temperatures greater than 30°C
between (2000-2009) and (2040-49)
changes from . . . 20 days to 66 days
Future Rain, Storms and Snowfall
Less snow, more rain in winter.
Fewer snow days per year
Fewer rainstorms per year
But more extreme rainstorms
More rainfall in July (80%+) and August (50%+)
15You can also read