Australia's changing climate - Climate Change in Australia

Page created by Regina Hamilton
 
CONTINUE READING
Australia's changing climate - Climate Change in Australia
Australia’s
changing climate
Australia's changing climate - Climate Change in Australia
Our climate is
changing and this
will affect most
of us in some
way during our
lifetimes.
Changes that are currently occurring include
rising temperatures, changing rainfall patterns,
sea level rise and ocean acidification.

Further climate change is expected due to
increases in greenhouse gas emissions.

Climate research is essential in our efforts to
quantify future risks and opportunities, slow the
continuing emissions and adapt to the impacts
associated with a warmer world.

Changes to the climate will have substantial
impacts on water resources, coasts, infrastructure,
health, agriculture, fisheries and biodiversity.

Effective emissions reduction efforts and climate
change adaptation together will bring important
benefits: social, environmental and economic risks
will be lower; new opportunities can be exploited;
and fresh thinking about climate resilience will
stimulate innovation.
Australia's changing climate - Climate Change in Australia
Global climate change
OBSERVED CLIMATE CHANGE
We have a good understanding of the climate system                                                                • Changes in greenhouse gas and aerosol concentrations have
and what drives change. Climate variability and change                                                              been caused by human activities.
are influenced by natural factors such as the El Niño
                                                                                                                  • It is extremely likely that human influence has been the
Southern Oscillation, volcanic eruptions and solar output,
                                                                                                                    dominant cause of the observed global warming since the
as well as human factors that have increased atmospheric
                                                                                                                    mid-20th century.
concentrations of greenhouse gases and aerosols and
changed the land-surface. Key points from the latest global                                                       • Human influence has also been detected in warming of the
assessment1 of observed and future climate change include:                                                          atmosphere and the ocean, in changes in the global water
                                                                                                                    cycle, in reductions in snow and ice, in global mean sea level
• Warming of the climate system is unequivocal, and since the                                                       rise, and in changes in some climate extremes.
                          1950s, many of the observed changes are unprecedented
                          over decades to millennia.
• The atmosphere and ocean have warmed, the amounts of
                                                                                                                  PROJECTED CLIMATE CHANGE
                          snow and ice have diminished, sea level has risen and the
                                                                                                                  • Continued net emissions of greenhouse gases will cause
                          concentrations of greenhouse gases have increased.                                        further warming and changes in all components of the
• The surface global warming was 0.85 °C in the period                                                              climate system. For the period 2081–2100, relative to
                          1880–2012 (Figures 1 and 2), and 2015 was the warmest in                                  1986–2005, expected changes include:
                          the instrumental record.                                                                  – Global warming of 0.3 °C –1.7 °C under a low emissions
• During 1901–2010, global average sea level rose by 190 mm.                                                          scenario2 through to 2.6 °C –4.8 °C under a high emissions
                          Since the early 1970s, glacier mass loss and ocean thermal                                  scenario 3.
                          expansion from warming together explain about 75% of the                                  – Sea level rise of 0.26 to 0.55 m under a low emissions
                          observed sea level rise.                                                                    scenario through to 0.45 to 0.82 m under a high emissions
• It is very likely that the number of cold days and nights has                                                       scenario.
                          decreased and the number of warm days and nights has                                      – More and longer heat waves.
                          increased on the global scale.
                                                                                                                    – More intense and more frequent extreme rainfall over
• It is likely that the frequency of heat waves has increased in                                                      most of the mid-latitude land masses and over wet
                          large parts of Europe, Asia and Australia.                                                  tropical regions.
• There are likely more land regions where the number of
                          heavy precipitation events has increased than where it
                          has decreased.

                                             1
    Mean annual temperature anomaly (°C)

                                           0.8
                                           0.6
                                           0.4
                                           0.2
                                             0
                                           -0.2
                                           -0.4
                                                                                                                         –0.6
                                                                                                                                –0.4
                                                                                                                                       –0.2
                                                                                                                                              0

                                                                                                                                                        0.4

                                                                                                                                                                    0.8
                                                                                                                                                  0.2

                                                                                                                                                              0.6

                                                                                                                                                                          1.0
                                                                                                                                                                                1.25
                                                                                                                                                                                       1.5
                                                                                                                                                                                             1.75
                                                                                                                                                                                                    2.5

                                           -0.6
                                           -0.8
                                              1850   1870    1890    1910   1930    1950    1970   1990    2010       FIGURE 2 Change in mean annual surface temperature between
                                                                                                                      1901 and 2012, showing warming over almost all regions. Trends
                                           FIGURE 1 Global mean surface air temperature 1850 to 2015 (bars),          significant at the 10% level are shown by plus symbol, areas
                                           shown as the anomaly relative to the 1961-1990 average, with an            with insufficient data are white (source: IPCC 2013) 4 .
                                           11-year running average (black line) showing variability about an
                                           upward overall trend (source: UK HadCRUT4)4 .

1
            The Intergovernmental Panel on Climate Change (IPCC), Working Group 1 Fifth Assessment Report, 2013
2
               RCP2.6 – see page 3
3
              RCP8.5 – see page 3
4
            Figure 1 and 2 use the UK Hadley Centre and Climate Research Unit Temperature series version 4
            (UK HadCRUT4) dataset, plus symbols in Figure 2 show where changes are statistically significant

                                                                                                                                                                                                          | 1
Australia's changing climate - Climate Change in Australia
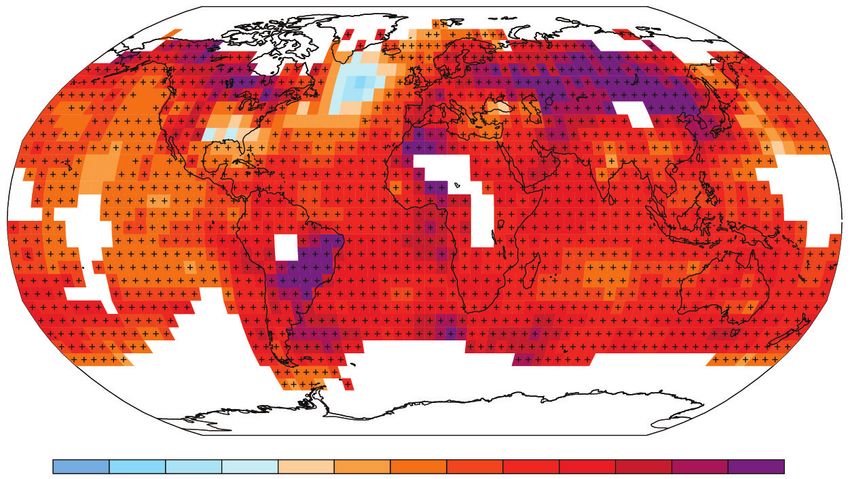
Climate variability and change in Australia
   over the past 100 years 5
   TEMPERATURE                                                                             temperatures and about 5 to 1 for               • Annual-average rainfall in many
                                                                                           night-time minimum temperatures.                  regions of southern and eastern
   • Australian average surface air                                                                                                          Australia has decreased since the
                                   temperature has increased by around                • Many heat extremes have been shown
                                                                                                                                             1950s, particularly in southwest
                                   1 °C since 1910 (Figure 3), with warming                to be much more likely due to human
                                                                                                                                             Western Australia (Figure 5).
                                   over most areas since 1950 (Figure 4).                  influence, including numerous heat
                                                                                           records set from 2013 onwards.                  • Annual-average rainfall increased in
   • In recent decades, months warmer than                                                                                                   much of northern Australia since the
                                   average have occurred more often than              RAINFALL                                               1950s (Figure 5).
                                   months colder than average.
                                                                                      • Atmospheric circulation has changed,               • Decreases in heavy rainfall have
   • Heat waves have increased in duration,                                                partly due to human influence: in some            tended to occur in southern and
                                   frequency, and intensity in many regions.               seasons the edge of the tropical zone             eastern Australia, while increases have
   • Since 2001, the number of extreme                                                     and the weather band in southern                  occurred in northern Australia.
                                   heat records in Australia has                           Australia known as the ‘storm track’
                                                                                           have both moved south. In other words,          • Heavy daily rainfall has accounted
                                   outnumbered extreme cool records                                                                          for an increased proportion of total
                                   by about 3 to 1 for daytime maximum                     the tropics are expanding.
                                                                                                                                             annual rainfall over an increasing
                                                                                                                                             fraction of the Australian continent
                                        1.5                                                                                                  since the 1970s.

                                                                                                                                           SNOW
Mean annual temperature anomaly (°C)

                                          1
                                                                                                                                           • Average snow depths have decreased
                                                                                                                                             at a number of Australian sites since
                                       0.5
                                                                                                                                             the 1950s.

                                         0                                                                                                 FIRE WEATHER
                                                                                                                                           • Extreme fire weather days have
                                       -0.5
                                                                                                                                             increased at 24 out of 38 Australian
                                                                                                                                             sites in 1973–2010.
                                         -1
                                                                                                                                           SEA LEVEL
                                       -1.5
                                          1910   1920   1930   1940   1950   1960   1970    1980   1990    2000   2010
                                                                                                                                           • From 1966 to 2009, Australian average
                                                                                                                                             sea level rose at a rate of about
    FIGURE 3 Australian mean annual surface air temperature anomalies (bars), shown as the                                                   1.4 mm/year.
    anomaly relative to the 1961-1990 average, with an 11-year running average (black line)
    showing variability but an upward overall trend (source: Bureau of Meteorology).

                                                                                               °C/decade
                                                                                                      0.60                                                                            50.0
                                                                                                      0.40                                                                            40.0
                                                                                                      0.30                                                                            30.0
                                                                                                      0.20                                                                            20.0
                                                                                                      0.15                                                                            15.0
                                                                                                      0.10                                                                            10.0
                                                                                                      0.05                                                                            5.0
                                                                                                      0.00                                                                            0.0
                                                                                                      -0.05                                                                           -5.0
                                                                                                      -0.10                                                                           -10.0
                                                                                                      -0.15                                                                           -15.0
                                                                                                      -0.20                                                                           -20.0
                                                                                                      -0.30                                                                           -30.0
                                                                                                      -0.40                                                                           -40.0
                                                                                                      -0.60                                                                           -50.0

    FIGURE 4 Trend in annual mean temperature (°C/decade) from                                                    FIGURE 5 Trend in annual-average rainfall (mm/decade)from 1950–2015,
    1950–2015, showing warming over most of the continent                                                         showing an increase in rainfall in much of the north and a decrease in
    (source: Bureau of Meteorology) 6.                                                                            many southern areas (source: Bureau of Meteorology, see website for
                                                                                                                  other time periods).
    5
                         For more information, see www.bom.gov.au, www.climatechangeinaustralia.gov.au
                         and State of the Climate (2016)
    6
                         Both Figure 3 and 4 use the Australian Climate Observations Reference Network
                         – Surface Air Temperature (ACORN-SAT) dataset, see www.bom.gov.au

    2 | AUSTR ALIA’S CHANGING CLIMATE
Australia's changing climate - Climate Change in Australia
Australian climate projections for
  the 21st century
  ABOUT CLIMATE                                                       The climate we experience for a given                  3. Climate response – the range of
                                                                      future period depends on three main                    possible changes in the climate system for
  PROJECTIONS                                                         factors:                                               each RCP given our current understanding
  Projections use the latest climate                                                                                         of how processes and feedbacks react
                                                                      1. Natural climate variability – this is
  science to provide detailed pictures                                                                                       to emissions. Scientists use computer
                                                                      always present year-to-year (e.g. the
  of plausible future climates. They are                                                                                     models of the climate system to simulate
                                                                      El Niño Southern Oscillation) and
  not predictions, but they illustrate                                                                                       the climate response to different RCPs.
                                                                      decade-to-decade, and this will
  the effect of different scenarios of                                                                                       These global climate models are based
                                                                      continue as the underlying climate
  human activity, including demographic                                                                                      on the laws of physics and are verified
                                                                      changes (see box below).
  change, economic development and                                                                                           against historical climate records.
  technological advances. They assist us in                           2. Greenhouse gas and aerosol emissions                Simulations from 40 different models give
  understanding the likely impact of future                           – explored using Representative                        a range of possible climate responses.
  socio-economic pathways on the climate                              Concentration Pathways (RCPs). The RCP
  system. The main place to find extensive                            number refers to the amount of extra                   Australian climate change projections
  information on Australian climate                                   radiative impact on the climate system                 account for these three factors,
  projections is the website:                                         by the end of the century. All the RCPs                presenting a range of results for a
  www.climatechangeinaustralia.gov.au                                 are quite similar up to 2030, but grow                 given climate variable, region, year and
                                                                      increasingly different after that (Figure 6):          scenario from different global climate
                                                                                                                             models and additional dynamical and
                                                                      • RCP8.5 (high) – little global action to              statistical downscaling. Results in Figures
                                                                        reduce greenhouse gas emissions                      7–10 and Table 1 show the range of
                                                                      • RCP4.5 (medium) – strong global                      possible change from different models
                                                                        action to reduce emissions towards                   and the effect of different emissions
                                                                        end of century                                       scenarios (which becomes marked by
                                                                                                                             2090). Figure 7 shows the projected
                            1000             RCP2.6                                    • RCP2.6 (low) –                      changes in average temperature in
                                             RCP4.5                                    ambitious global action               Australia relative to past temperatures.
                            900
                                                                                       to reduce emissions                   It also indicates United Nations
CO2 concentrations (ppm)

                                             RCP8.5
                            800                                                                                              Framework Convention on Climate
                                             Observed                                                                        Change (UNFCCC) Paris Agreement
                            700
                                                                                                                             targets (2 °C and 1.5 °C global warming
                            600                                                                                              since the pre-industrial era). Note these
                                                                                                                             targets have been converted to the
                            500                                                        FIGURE 6 Carbon dioxide               relevant thresholds for Australia (2.4 °C
                                                                                       concentrations from global
                                                                                       observations and for three            and 1.8 °C) and warming to the baseline
                            400                                                        RCPs in the 21st century,             period has been subtracted, giving the
                                                                                       showing an increase                   values of 2.05 °C and 1.45 °C.
                            300                                                        proportional to human
                               1950           2000           2050            2100      emissions7.

                           CLIMATE VARIABILITY AND CHANGE
                           Warming of the climate system over          However, the climate has always varied                are combined with natural variability,
                           the past century is a well-established      from year to year and from decade to                  there are periods of rapid change and
                           fact, and the long-term trend in surface    decade, and always will. This is due to               periods of little change. For example,
                           temperature is clear for the globe          drivers of natural variability such as                the global warming trend in Figure 1
                           (Figure 1) and for Australia (Figure 3).    the El Niño Southern Oscillation,                     shows periods of rapid warming from
                           A good indicator of heat in the climate     volcanic eruptions, and variations on                 1910–1940 and 1970–2015, separated by a
                           system is the temperature of the oceans:    the sun’s output. In addition to natural              period of little change. Trends calculated
                           since 1971, 90% of the extra energy         variability, increases in greenhouse                  over short periods, such as 10–20 years,
                           accumulated in the climate system           gases and aerosols due to human                       are very sensitive to the choice of start
                           has gone into the oceans, and the           activities contribute to global warming               and end years.
                           temperature of the upper 700 m              and other climatic trends. Since trends
                           of the ocean has risen.

  7
         Adapted from Van Vuuren D, et al. 2011. The representative concentration pathways: an overview. Climatic Change, 109, 5–31

                                                                                                                                                                      | 3
Australia's changing climate - Climate Change in Australia
CONFIDENCE IN THE                                    of evidence. Ratings range from very                      that accounts for uncertainty and risk.
                                                     high to low, depending on the amount                      Projections with high or very high
PROJECTIONS                                          of evidence and the level of agreement                    confidence can be used to develop
Confidence in the direction and range                between the different lines of evidence.                  management decisions, whereas
of projected change is key information                                                                         projections with low to medium
when viewing and using climate                       The confidence ratings are important                      confidence require a more cautious
projections. Confidence ratings have                 considerations when using the                             approach, with more emphasis on
been derived for different climate                   projections for adaptation and                            flexible management, monitoring and
variables, regions, emissions scenarios              mitigation activities. These activities                   general building of climate resilience to
and time periods, based on five lines                must use a decision-making framework                      an uncertain future.

                               CLIMATE
                             MODEL RESULTS                                               High agreement         High agreement            High agreement
                                                                                         Limited evidence       Medium evidence           Robust evidence

                                                                                                                                                            CONFIDENCE SCALE
                 MODEL                            PROCESS
               EVALUATION                      UNDERSTANDING
                                                                                        Medium agreement       Medium agreement Medium agreement
                                                                                        Limited evidence       Medium evidence           Robust evidence
                                                         OBSERVED
   DOWNSCALING
                                                          TRENDS
                                                                           AGREEMENT

                                                                                         Low agreement          Low agreement             Low agreement
                                                                                         Limited evidence       Medium evidence           Robust evidence
                        CONFIDENCE ASSESSMENT
                                                                                         EVIDENCE (type, amount, quality, consistency)

Lines of evidence used to assess confidence.                                           Table used to assign confidence ratings.

4 | AUSTR ALIA’S CHANGING CLIMATE
Australia's changing climate - Climate Change in Australia
Australian climate projections at a glance

                                                        TEMPERATURE                                      DROUGHT                                           FIRE WEATHER                                 OCEANS
                                                        • Australia’s average temperature                • The time in drought will increase               •   Southern and eastern Australia are       • Sea levels will continue to rise
                                                          will increase, with more hot                       over southern Australia, with                     projected to experience harsher            throughout the 21st century and
                                                          extremes and fewer cold                            a greater frequency of severe                     fire weather (high confidence).            beyond (very high confidence).
                                                          extremes (very high confidence).                   droughts (high confidence).
                                                                                                                                                                                                        • Oceans around Australia will
                                                                                                                                                                                                          warm and become more acidic
                                                                                                                                                                                                          (very high confidence).

                                                                                                                                                                                                        • There is medium confidence that
                                                                                                                                                           SNOW                                           long-term viability of corals will
                                                        RAINFALL                                         EVAPORATION AND                                                                                  be impacted and that there will
                                                                                                         SOIL MOISTURE
                                                                                                                                                           •   There will be a decrease in                be harm to marine ecosystems.
                                                        • In southern Australia, winter and                                                                    snowfall, an increase in the
                                                          spring rainfall is projected to                •   A projected increase in                           melting of snow that does fall
                                                          decrease over the whole century                    evaporation rates will contribute                 and thus reduced snow cover
                                                          (high confidence), although                        to a reduction in soil moisture                   (high confidence).
                                                          increases are projected for                        in southern Australia (high
                                                          Tasmania in winter (medium                         confidence).
                                                          confidence).

                                                        • In northern Australia, substantial
                                                          changes to wet-season and
                                                          annual rainfall is possible over                                                                 EXTREME EVENTS
                                                          the century, but there is low                                                                    • Extreme rainfall events that
                                                          confidence in the direction of                 HUMIDITY                                              lead to flooding are likely to
                                                          future rainfall change.
                                                                                                         • There is high confidence that                       become more intense (high
                                                                                                             inland humidity will decrease                     confidence).
                                                        • Southwest Western Australia                        in winter and spring as well as
                                                          has already seen reductions in
                                                                                                             annually, and there is medium
                                                                                                                                                           • The number of tropical cyclones
                                                          rainfall due to human influence,                                                                     is projected to decrease but
                                                          and further drying in winter                       confidence in declining relative                  with a greater proportion
                                                          is a particularly confident                        humidity in summer and autumn.                    of intense cyclones (medium
                                                          projection.                                                                                          confidence). Higher sea levels           Projections of change are for all
                                                                                                                                                               and rainfall intensity will affect       scenarios, with greater change
                                                                                                                                                               their impact.                            under higher scenarios.

                                                         6
                                                                   Model range                          Model range
                                                                   Climate model median                 Climate model median
                                                         5                                                                                                                      2050s: the 2013
                                                                   Observed Australian                  Australia’s climate model
Australia’s temperature anomalies from 1950–2005 (˚C)

                                                                   temperature data                     (example series)                                                        record is a cool year
                                                                                                                                                                                under medium or
                                                         4                                                                                                                      high emissions

                                                         3
                                                                                                                                                                                                                           RCP8.5

                                                                                                                                  2013 was 23 °C,
                                                                                                                                  Australia’s
                                                                 Target from Paris agreement 2 °C global warming                  warmest year
                                                         2                                                                        on record
                                                                 Aspirational target from Paris agreement 1.5°C global warming
                                                                                                                                                                                                                                RCP4.5

                                                          1        1938 was 22 °C
                                                                                                                                                                                                                                         RCP2.6

                                                         0

                                                         −1

                                                                                                         Observed data, plus climate model             Projected
                                                        −2                                               simulations of the historical period

                                                                  1920               1940              1960                1980            2000                 2020            2040             2060           2080                        2100
                                                                                                                                                    Year

                                                                                                                   FIGURE 7 Australian mean annual surface warming in the past and for future emissions pathways. Series
                                                                                                                   are relative to the 1950–2005 average: brown is observations 8 , shading is the range of 20-year averages
                                                                                                                   from up to 40 climate models, thick lines are the median of the models, purple is a simulation from
                                                                                                                   Australia’s community climate model (ACCESS) showing what a future time series may look like for high
                                                                                                                   emissions including year-to-year variability. Global warming targets from the Paris Agreement are shown
     8                                                                                                             relative to pre-industrial temperature and converted to a relevant temperature band for Australia.
                         Bureau of Meteorology ACORN-SAT

                                                                                                                                                                                                                                                  | 5
Australia's changing climate - Climate Change in Australia
Some of the largest projected climate                                                    Frost risk days                                                35 °C days
change impacts will be felt through                                                                                        Current
                                                                                                                           2030
changes to extreme weather. For                                                  Perth                                     2090 RCP 4.5
example, an increase in extremely                                                                                          2090 RCP8.5
hot days (Figure 8) will lead to greater
energy demand for air conditioning,
                                                Canberra
more black-outs, more heat-related
deaths, increased fire risk and transport
disruption. Fewer extremely cold                                                         0         20       40      60        80      100               0           20        40          60         80
nights will lead to reduced energy                                                                         Days per year                                                 Days per year
demand for heating, less cold-stress,
less frost-damage to crops, less snow                 FIGURE 8 Projected changes in the annual-average number of frost risk days (nights
and reduced yield for stone fruit and                 below 2 °C) and days over 35 °C for Perth and Canberra stations relative to the 1981–2010
apples.                                               period for 2030 (where emissions scenarios are similar), and for 2090 for medium and
                                                      high emissions. The graph shows a reduction in cold extremes and an increase in hot
                                                      extremes with time, proportional to the emissions scenario.
Annual total rainfall varies substantially
from year to year. Rainfall is projected
to increase in some areas and seasons,                                                       Historical                                   Projected                         Simulations
and decrease in others, and in some                                               60         10−90% of years                              10−90% of years                     RCP8.5           60
                                                                                             10−90% of 20 year trend                      10−90% of 20 year trend             RCP4.5
areas substantial change is possible
                                             Rainfall change in % of 1950–2005

                                                                                             Median                                       Median                              NatVar
but the direction of change is unclear.                                           40         AWAP                                         example Model                                        40
Projected changes are generally larger
for the higher emissions scenarios.                                                                                                                                                            20
                                                                                  20
Southern Australian rainfall is
projected to decrease, mainly in the
cooler months, but with some regional                                              0                                                                                                           0
exceptions. Substantial increase
or decrease is possible in northern                                              –20                                                                                                           −20
Australia, but more research is needed
to understand which is more likely.                                              –40                                                                                                           −40

                                                                                       1900 1920 1940 1960 1980 2000 2020 2040 2060 2080 2100                              Future Pathways

                                                      FIGURE 9 Southern Australian rainfall variability and change relative to the 1950–2005
                                                      average. Observations9 (brown) show the substantial variability experienced. The range
                                                      between 40 climate model results (coloured bands) shows large variability but with a
                                                      projected decrease simulated by most models. The dark line gives the central estimate
                                                      of models. Lighter shading indicates year-to-year variability. An example of Australia’s
                                                      climate model (ACCESS-1.0) shows what an actual time series may look like, with year-
                                                      to-year variability. Bars to the right show the range at 2090 relative to 1986-2005 for
                                                      natural variability only, medium emissions and high emissions.

                                                                                             Historical                                   Projected                         Simulations
                                                                                  60         10−90% of years                              10−90% of years                     RCP8.5           60
                                                                                             10−90% of 20 year trend                      10−90% of 20 year trend             RCP4.5
                                             Rainfall change in % of 1950–2005

                                                                                             Median                                       Median                              NatVar
                                                                                  40         AWAP                                         example Model                                        40

                                                                                  20                                                                                                           20

                                                                                   0                                                                                                           0

                                                                                 –20                                                                                                           −20

                                                                                 –40                                                                                                           −40

                                                                                       1900 1920 1940 1960 1980 2000 2020 2040 2060 2080 2100                              Future Pathways

                                                      FIGURE 10 Northern Australian rainfall variability and change, showing ongoing large
                                                      variability and an uncertain projection – substantial increase or decrease is possible.
                                                      Details as for Figure 9.

                                                9
                                                             Australian Water Availability Project (AWAP) data, see www.bom.gov.au

6 | AUSTR ALIA’S CHANGING CLIMATE
Australia's changing climate - Climate Change in Australia
TABLE 1 Projected climate changes by 2090, relative to 1995, averaged                                      Regions
over the four regions shown in the map: Northern, Southern, Eastern                                Eastern Australia
and Rangelands for RCP8.5 (purple), RCP2.6 (Yellow), or where RCP2.6
                                                                                              Northern Australia
results are not available, RCP4.5 (blue). Results are the range of change
from the available climate models (the 10–90% range, so excluding                                   Rangelands
the 10% outliers), emphasising the range of possibilities rather than a                       Southern Australia
single ‘best estimate’.
See www.climatechangeinaustralia.gov.au for more information

                                                      SOUTHERN                       EASTERN                            NORTHERN              RANGELANDS
     Annual temperature                                2.7 to 4.2 °C                  2.8 to 5 °C                        2.7 to 4.9 °C           2.9 to 5.3 °C
                                                       0.5 to 1.4 °C                 0.6 to 1.6 °C                       0.5 to 1.6 °C           0.6 to 1.8 °C
     Sea level rise                                     Geelong                       Newcastle                             Darwin              Port Hedland
                                                     0.38 to 0.82 cm               0.46 to 0.88 cm                      0.41 to 0.85 cm        0.40 to 0.84 cm
                                                     0.22 to 0.53 cm               0.22 to 0.54 cm                      0.22 to 0.55 cm        0.22 to 0.55 cm
     Annual rainfall                                    -26 to 4 %                    -25 to 12 %                         -26 to 23 %            -32 to 18 %
                                                        -15 to 3 %                     -19 to 6 %                          -12 to 3 %             -21 to 3 %
     Summer rainfall                                    -13 to 16 %                   -16 to 28 %                         -24 to 18 %            -22 to 25 %
                                                        -22 to 6 %                    -20 to 13 %                          -16 to 4 %             -22 to 8 %
     Autumn rainfall                                   -25 to +13 %                   -33 to 26 %                         -30 to 26 %            -42 to 32 %
                                                        -17 to 11 %                   -25 to 15 %                          -18 to 11 %           -26 to 18 %
     Winter rainfall                                    -32 to -2 %                   -40 to 7 %                          -48 to 46 %            -50 to 18 %
                                                         -9 to 4 %                    -24 to 9 %                          -32 to 13 %            -31 to 12 %
     Spring rainfall                                    -44 to -3 %                    -41 to 8 %                         -44 to 43 %            -50 to 23 %
                                                        -23 to +4 %                   -26 to 11 %                         -32 to 13 %            -32 to 15 %
     Evapotranspiration                                  8 to 17 %                     9 to 18 %                           8 to 17 %              6 to 16 %
                                                         2 to 5 %                      3 to 7 %                            2 to 6 %               0 to 4 %
     Extreme rainfall (20-year average                   5 to 30 %                    13 to 45 %                           3 to 65 %              8 to 42 %
     recurrence interval)                                1 to 19 %                    0 to 28 %                            0 to 31 %              4 to 20 %
     Fire weather – days over McArthur                 Baseline: 2.8                 Baseline: 1.2                     Changes less clear     Changes less clear
     forest fire danger index 50                           5.3                           3.2
                                                           3.8                           1.9

         RCP8.5           RCP2.6         RCP4.5

        USING CLIMATE PROJECTIONS
        Climate projections can be used at the               It is important to seek guidance from                       The National Climate Resilience and
        global, national or local scale to address           experts to find information that is fit                     Adaptation Strategy11 provides a
        a range of questions about climate risks             for purpose.                                                number of examples in which climate
        and opportunities. Different levels of                                                                           projections have been used to assess
        detail are useful for different activities           There are several steps and numerous                        impacts and guide decision-making.
        and stakeholders:                                    inputs when assessing climate risks
                                                             and opportunities. Information is
        • Simple qualitative statements are                  needed about current climate and
           sufficient for raising awareness.                 projected climate change, but also
        • Quantified ranges of change in                     climate exposure (what is at risk) and
           specific climate variables can be                 the adaptive capacity (what can be done
           used in impact assessments.                       to reduce risk). Various risk assessment
                                                             frameworks10 are available. The aim
        • Interactive web-based tools allow                  is to develop robust “adaptation
           people to explore information in
                                                             pathways”, where different actions
           different ways.
                                                             are implemented depending on when
        • Tailored climate products and services             critical thresholds are crossed.
           may be needed for specific decisions.

10
      http://www.climatechangeinaustralia.gov.au/en/climate-campus/modelling-and-projections/using-projections/impact-assessment/
11
     https://www.environment.gov.au/climate-change/adaptation/strategy

                                                                                                                                                                   | 7
Australia's changing climate - Climate Change in Australia
Climate impacts in Australia
Extreme weather and climate events                                more than 2000 homes, burnt about                         in climate, sea level, atmospheric carbon
significantly affect the vulnerability of                         430,000 hectares, and cost about                          dioxide and ocean acidity are projected
our economy, society and environment.                             $4.4 billion12 .                                          to have substantial negative impacts on
Some changes to extreme events have                                                                                         water resources, coasts, infrastructure,
already been observed in Australia –
                                                               • The floods in eastern Queensland in                        health, agriculture and biodiversity 16.
                                                                  early 2011 cost more than $5 billion in
notably an increase in fire weather,
                                                                  lost revenue, and the loss of 33 lives12 .                Some communities and sectors in some
record-breaking temperatures and
heatwaves. Understanding the causes of                         • Heatwaves in 2013 (Australia’s hottest                     locations have the potential to benefit from
individual extreme events is difficult, and                       year), 2014 and 2015 had substantial                      projected changes in climate and increasing
is a field of active research.12                                  impacts on infrastructure, health,                        atmospheric carbon dioxide, for example:
                                                                  electricity supply, transport and
• High sea surface temperatures have                              agriculture 12 .                                          • Reduced winter mortality for people,
     repeatedly bleached coral reefs in                                                                                        crops and livestock.
     north-eastern Australia since the late                    • From November 2015 to January 2016,
                                                                  South Australia’s Pinery bushfires                        • Reduced energy demand for winter
     1970s and more recently in Western                                                                                        heating in southern parts of Australia.
     Australia. The 2016 bleaching event                          (26 November), the Sydney tornado
     was the most severe on record and                            (17 December), the Great Ocean Road                       • Increased forest growth in cooler
     affected most of the reef 13.                                bushfires in Victoria (26 December) and                      regions, except where soil nutrients or
                                                                  the bushfires in Western Australia’s                         rainfall are limiting.
• Widespread drought in southeast                                 south west (8 January) cost $515 million
     Australia (1997–2009) resulted in                            in insured losses15 .                                     • Increased spring pasture growth in
     substantial economic losses14 .                                                                                           cooler regions.
                                                               • The June 2016 storm that lashed
• The southeast Australian heatwave                                                                                         Ongoing research into how the climate
                                                                  Queensland, NSW, Victoria and
     in late January 2009 resulted in 374                                                                                   is changing at a regional level is critical
                                                                  Tasmania caused significant flooding
     more deaths in Victoria than would be                                                                                  to identify both the challenges and
                                                                  and coastal damage, with insurance
     expected normally 12 .                                                                                                 opportunities associated with climate
                                                                  losses of $235 million 15 .
                                                                                                                            change, and to inform management and
• The Victorian bushfires in early                             The frequency and/or intensity of such                       policy decisions.
     February 2009 killed 173 people and                       events is projected to increase in many
     more than 1 million animals, destroyed                    locations. Without adaptation, changes

Managing climate change through
adaptation and mitigation
Adaptation and mitigation are                                  MITIGATION                                                   processes, greater use of sustainable
complementary strategies for reducing                                                                                       transport and enhanced carbon uptake
and managing the risks of climate                              Substantial emissions reductions over                        in the landscape.
change. Mitigation seeks to reduce                             the next few decades can reduce
net emissions to limit the extent of                           climate risks in the 21st century and
                                                               beyond, increase prospects for effective
                                                                                                                            ADAPTATION
climate change, while adaptation
helps individuals, communities,                                adaptation, reduce the costs and                             Adaptation can involve gradual
organisations and natural systems deal                         challenges of mitigation in the longer                       transformation with many small steps
with those consequences of climate                             term, and contribute to climate-resilient                    over time, or major transformation with
change that emissions reduction                                pathways for sustainable development.                        rapid change. There are engineering and
cannot help us avoid.                                                                                                       built-environment solutions, institutional
                                                               Mitigation actions include enhancing                         solutions, technological solutions and
                                                               energy efficiency, greater use of                            ecosystem-based solutions.
                                                               renewable energy, improved industrial

12
     ACCSP brochure on Weather extremes and climate change: http://www.cawcr.gov.au/projects/climatechange/resources.shtml
13
     Great Barrier Reef Marine Park Authority: http://www.gbrmpa.gov.au/media-room/coral-bleaching
14
     van Dijk AIJ, et al., 2013. The Millennium Drought in in southeast Australia (2001–2009): Natural and human causes and implications for water resources,
     ecosystems, economy, and society. Water Resources Research, 49, p 1040-1057
15
     Insurance council of Australia. 2016 media releases. www.insurancecouncil.com.au/media-centre
16
     Reisinger, A. et al., 2014. Australasia. In: Climate Change 2014: Impacts, Adaptation, and Vulnerability. Part B: Regional Aspects. Contribution of Working Group II
     to the Fifth Assessment Report of the Intergovernmental Panel on Climate Change. Barros, V.R., et al. (eds.)]. Cambridge University Press, Cambridge, United
     Kingdom and New York, NY, USA, pp. 1371-1438.

8 | AUSTR ALIA’S CHANGING CLIMATE
TOOLS                                                     emissions, vulnerability to climate                Australia needs a strong foundation
                                                          change impacts and tolerance for risk.             in policies, laws, institutions and
Decision-support tools are useful                         Some actions, such as energy-efficient             investments in research and technology to
for assisting decision and policy                         building design, water conservation and            further reduce greenhouse gas emissions
makers to assess the climate                              urban greening, have mitigation and                and build the resilience of communities,
risks in their region or sector,                          adaptation benefits.                               the economy and the environment.
and to inform the development
of climate ready plans and
adaptation strategies. For
example:
• The National Climate Change
     Adaptation Research Facility
     is working closely with
                                                      Adaptation
     governments, businesses, and
     communities around Australia
                                                      solutions
     to develop CoastAdapt17,
     an online tool to help local
     governments and other
     relevant organisations
     understand and manage the
     risks associated with sea level
     rise, storm surges and other
     coastal hazards.
• CSIRO’s AdaptNRM18 tool
     provides support for natural
     resource managers to develop
     climate-ready plans.
• The AdaptWater19 tool quantifies
     the risk associated with climate
     change and extreme weather
     events to water utility assets.
     The tool performs cost-
     benefit analyses on proposed
     adaptation options to inform
     planning and investment
     decisions.
The National Climate Resilience
and Adaptation Strategy20 sets
out how Australia is managing
the risks of a variable and
changing climate. It identifies
a set of principles to guide
effective adaptation practice and
resilience-building, and outlines
a vision for a climate-resilient
future.
As the strategy highlights, the
best mix of climate change
adaptation, resilience-building
and emissions reduction
policies varies from country to
country depending on emissions
intensity, the cost of reducing

17
     https://www.nccarf.edu.au/content/coastal-tool-overview
18
     http://adaptnrm.csiro.au/
19
     https://www.nccarf.edu.au/localgov/case-study/adaptwater%E2%84%A2-online-climate-change-analysis-tool
20
     https://www.environment.gov.au/climate-change/adaptation/strategy

                                                                                                                                                   | 9
For further information:
CSIRO Enquiries        Bureau of Meteorology
1300 363 400           climate.helpdesk@bom.gov.au
+61 3 9545 2176
enquiries@csiro.au
www.csiro.au/enquiries

© 2016 CSIRO, Bureau of Meteorology. To the extent      No reliance or actions must therefore be made
permitted by law, all rights are reserved and no part   on that information without seeking prior expert
of this publication covered by copyright may be         professional, scientific and technical advice. To the
reproduced or copied in any form or by any means        extent permitted by law, CSIRO and the Bureau of
except with the written permission of CSIRO and the     Meteorology (including each of its employees and
Bureau of Meteorology.                                  consultants) excludes all liability to any person for
                                                        any consequences, including but not limited to all
CSIRO and the Bureau of Meteorology advise that the
                                                        losses, damages, costs, expenses and any other
information contained in this publication comprises
                                                        compensation, arising directly or indirectly
general statements based on scientific research. The
                                                        from using this publication (in part or in whole) and
reader is advised and needs to be aware that such
                                                        any information or material contained in it.
information may be incomplete or unable to be used in
any specific situation.
You can also read