December 2020 Quarterly Update - AFR
←
→
Page content transcription
If your browser does not render page correctly, please read the page content below
P: +61 8 6465 5500
                                                                                              EveInvestments
                                                                                           W: www.eveinvestments.com.au

28 January 2021

                            December 2020 Quarterly Update
                                         RECORD SALES IN USA, AUSTRALIA

    •   Record quarter of sales in the USA, driven by growth in Amazon online sales
    •   Group unaudited revenues of $1.9 million for the quarter
    •   Cash balance at $5 million at the end of the quarter
    •   Meluka Australia products accepted into Whole Foods Market in USA
    •   Strong customer demand for Meluka Australia’s raw honey in China during the recent China
        Singles’ Day event
    •   Tea tree honey and tea tree oil products launched in December ahead of Chinese New Year
        celebrations
    •   Launch of Meluka Australia on Amazon Canada with positive early sales of organic raw honey
        recorded
    •   Japan, UK and Germany marketplaces to launch on Amazon in early 2021

EVE Investments (ASX:EVE, EVE or the Company), an ASX-listed health, nutrition and wellness company,
has today released its Appendix 4C Report for the three-month period to 31 December 2020 and is pleased
to provide a review of operational progress during the quarter.

The December quarter saw a further strong period in group 1 company revenues of $1.9 million, a decrease
of 9.5% QOQ, a very pleasing result given that there were no orders from China during the quarter. The US
and Australian sales revenues were new quarterly records and reflected growing product acceptance
(branded and bulk) in these regions. There was no revenue recorded for China due to previously ordered
stock arriving during the quarter in preparation for Chinese New Year celebrations. Commencement of sales
in Canada also provided an additional revenue stream with encouraging initial sales results.

The Company aims to continue to deliver successive quarters of growth as it expands its sales presence in
key regions and adds new territories, notwithstanding challenges posed by COVID-19 and global economic
conditions.

1
 Group revenue includes the revenue from all 100% owned subsidiaries as well as associates Naturally Australian Products (49%
owned by EVE) and Omni Innovation (38% owned by EVE), the figures for associates are not consolidated into the Appendix 4C.

                                                           Page 1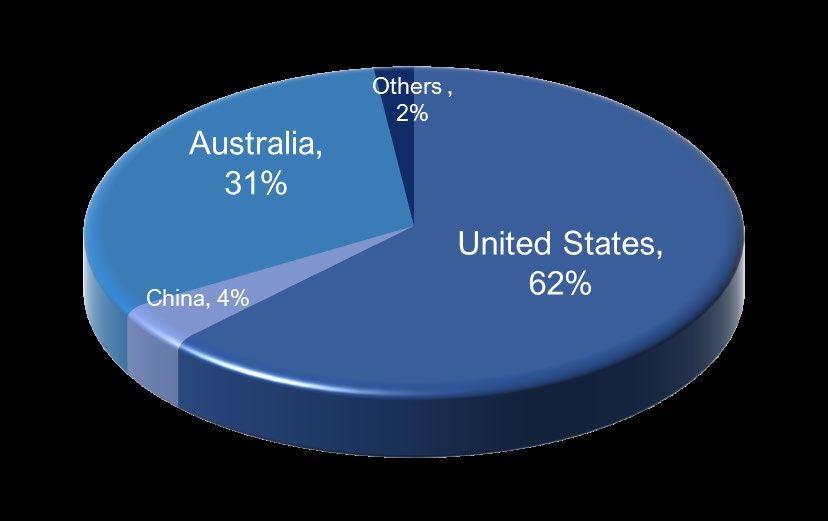
The following is a summary of the breakup of sales by category, region and sales channel for the quarter
and YTD.

            Figure 1: Breakdown of sales across EVE companies by product type in December quarter (left) and YTD (right)

Sales of bulk oils continued to provide a more significant portion of sales. This quarter saw a greater
percentage of sales attributable to bulk oils due to the continued tea tree harvest in Australia and increased
demand in the US for oil products distributed by Naturally Australian Products (NAP). Meluka Australia’s
products represented a lower proportion of sales this quarter due to the no orders being received from
China and high levels of bulk oil sales. Contract manufacturing revenue is derived from manufacturing
product for third parties and continued to perform well.

               Figure 2: Breakdown of sales across EVE companies by region in December quarter (left) and YTD (right)

US sales continued to represent the largest percentage of sales, while the growing Australian sales numbers
remained relatively constant as a proportion of total sales. No China sales were recorded for the quarter, as
mentioned previously, due to previous orders being received later than expected. Sales to China and other
new markets Canada, Japan, UK etc, will comprise an increasing percentage throughout 2021 and
subsequent years.

            Figure 3: Breakdown of sales across EVE companies by sales channel in December quarter (left) and YTD (right)

                                                              Page 2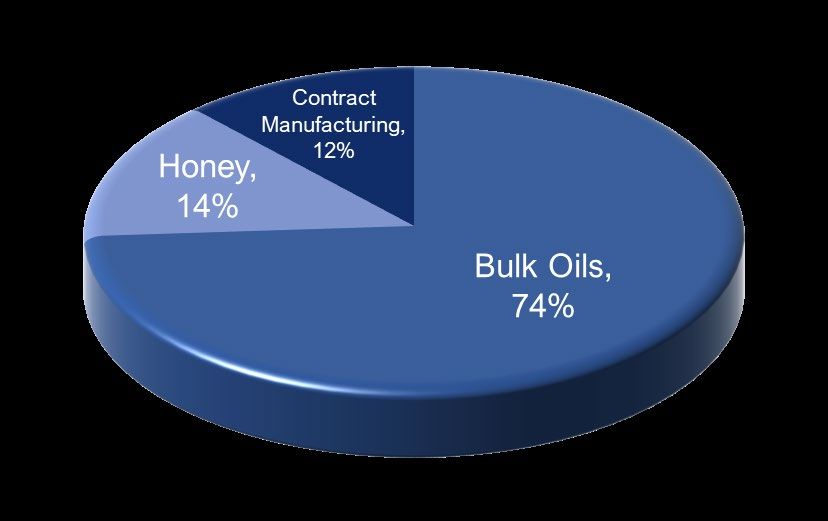
Wholesale sales continued to be the mainstay of revenue generation during the quarter. Direct to consumer
sales are expected to increase over the coming quarters through continued US and Canada growth and sales
into our distribution channels.

Meluka Australia Sales & Distribution
Another record quarter in the USA
The December quarter in the US was the most successful quarter in terms of sales for Meluka Australia.
December represented the sixth month of continuous sales growth on Amazon US with Meluka Australia’s
raw native honey consistently ranked inside Amazon’s top 20 honey products with over 1200 reviews for a
rating of 4.5 stars by amazon consumers. It is the success on this platform that drew the attention of Whole
Foods Market, Inc. for consideration into its store network.

Meluka Australia products accepted into Whole Foods Market in Northern California
Whole Foods Market, Inc. (“Whole Foods”) is a large American supermarket chain with a focus on organic
products and has over 500 stores across the United States of America. Whole Foods is a wholly owned
subsidiary of Amazon.com, Inc.

Meluka Australia, has been advised that its Organic Raw Native Honey and its Organic Raw Native Honey
infused with Tea Tree (TTF24 strength), two of Meluka Australia’s leading products have been accepted into
the Whole Foods product catalogue. The success on the US Amazon platform drew the attention of Whole
Foods for consideration in its store network. United Natural Foods (“UNFI”), one of the largest and best-
known food distributors in the United States will distribute the product to Whole Foods on behalf of Meluka
Australia.

Post quarter end, the Company was advised that the products will initially be ranged in the Northern
California market across approximately 40 Whole Foods stores. The Northern California market has a
population of approximately 15 million people and includes the cities of San Francisco, San Jose (Silicon
Valley) and Oakland.

Meluka Australia has started the required processes to have its products included in Whole Foods store’s
planograms. A first product order for the stores in the Northern California market is expected in the coming
months, with product expected to be in stores by April 2021.

The order volumes are to be confirmed on an ongoing order basis, which is typical in the industry and the
financial benefit cannot be determined in advance of received orders as volumes will be confirmed on an
order-by-order basis.

Alignment with Company’s strategy
The Company’s continued success on Amazon US for Meluka Australia branded products has provided the
Company with a broad platform for market penetration into the US organics and wholefoods sectors, a key
pillar in EVE’s product development and international expansion initiatives.

The path from selling online on Amazon and leveraging that performance into traditional distribution
channels is a key part of the Company’s strategy.

                                                   Page 3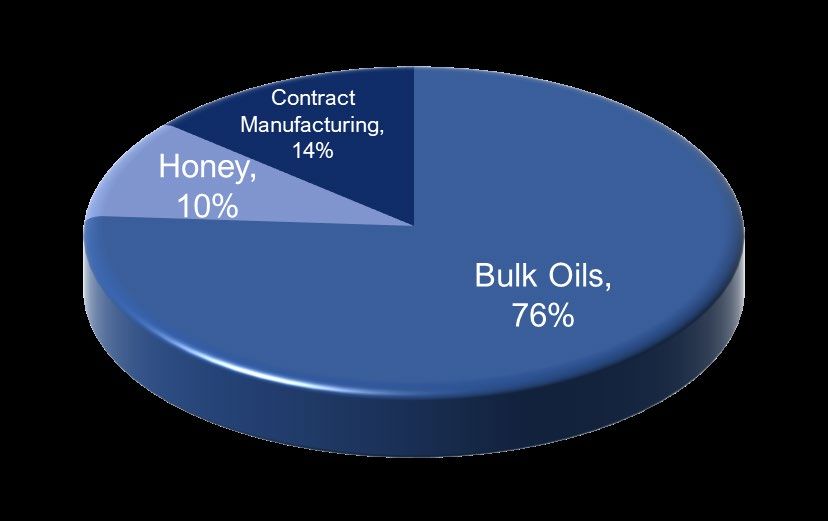
Amazon.com is one of the world’s largest online retailers and Meluka Australia’s sales performance and
reviews/rankings in the Amazon marketplace works to rapidly prove the validity of the Company’s products.
Then by establishing credibility and a sales record on one of the biggest global online platforms, the
opportunities to secure in store brick and mortar distribution are greater.
Canada starts strongly
Extending its presence in the North America region, Meluka Australia launched its honey range on Amazon
in Canada in late October. The Company has been buoyed by the initial interest it has received with sales on
Amazon Canada starting positively. The substantial number of positive reviews and high ranking of Meluka
Australia’s products in the US provide strong product validation when entering new regions such as Canada.
This leverage provides a much quicker pathway to showing sales in all regions where Meluka Australia
chooses to use Amazon.
Initial sales and reviews have exceeded expectations with month-on-month sales growth during the quarter
and January 2021 continuing this trend. Meluka Australia will continue to push its honey products on
Amazon Canada and introduce new products where possible in line with its US strategy.
Australia continues to grow
Australian online sales grew once again to be the most successful quarter for Meluka Australia to date. The
appointment of a new social media consultant and a new social media content manager in September 2020
has significantly improved engagement and following across all Meluka Australia’s social channels. The
listing on Amazon in Australia has also contributed to increasing sales. The Native Raw Honey product is
consistently ranked number 1 honey on Amazon Australia and in the top 3 within the grocery category.
China customer demand exceeding expectations
EVE’s China distribution strategy continued to perform well with shipments of Meluka Australia’s raw honey
product being pre-sold into the Yandi Biotech (Yandi) distribution network of wholesalers across Mainland
China. These wholesalers provide an excellent platform for EVE due to their extensive membership network.
Following commercial dialogue with Yandi, EVE is pleased to disclose that Yandi’s wholesalers completely
sold-out of their Meluka Australia honey stock during the China Singles’ Day event on November 11, the
largest retail and online shopping day in the world. Yandi were also pleased to report the raw honey product
was very well received by end consumers, confirming the approval of Meluka Australia’s premium branded
products among its core customer demographic in Mainland China.
China product shipments arrive in December 2020
Yandi confirmed that the recent shipments of raw honey, tea tree honey and tea tree oil have arrived in
China and cleared customs in early December. These shipments provide adequate inventory for the launch
of the tea tree oil and tea tree honey into Yandi’s market and ensure adequate inventory for the Chinese
New Year celebration in early February.
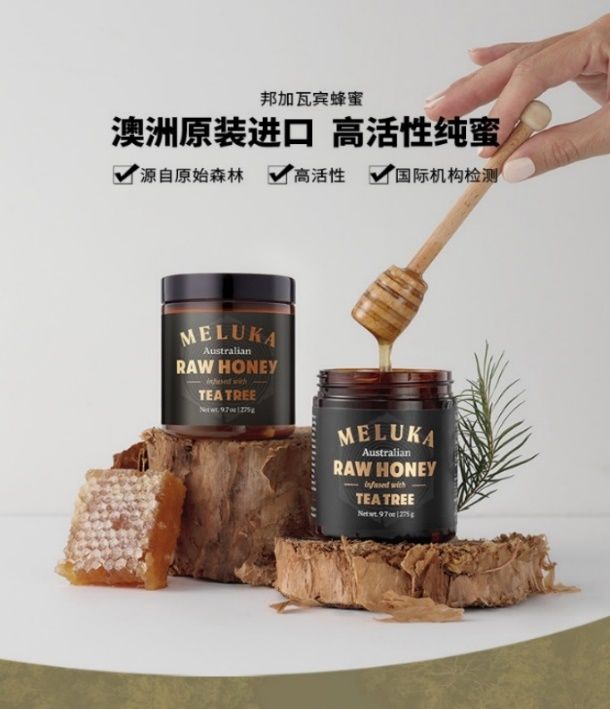
Yandi product launch of Meluka Australia’s Tea Tree Honey and Tea Tree Oil
The launch of Meluka Australia’s Tea Tree Honey and Tea Tree Oil was held on 19-20 December, alongside
promotion of the previously launched Raw Honey product. Its sales strategy for these products will involve
both promotional roadshows and the use of influencers across the Yandi distribution network to maximise
outreach. Despite COVID-19 induced restrictions on numbers that could attend the event, the products were
well received.
Page 4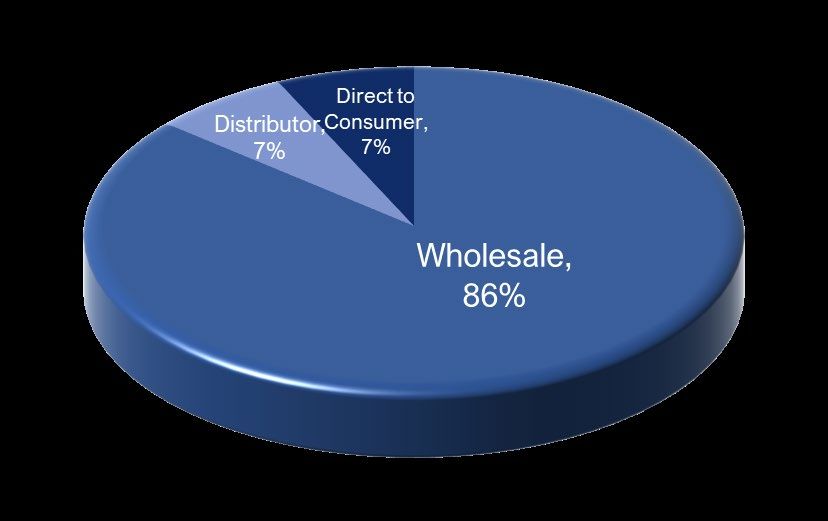
Figure 4: Promotional material for Yandi’s Meluka Australia tea tree honey and tea tree oil launch

Company expansion into European markets
EVE has appointed a specialist European based Amazon consulting company to manage Meluka Australia’s
advertising, listing optimisation and customer communication for the whole of Europe. The decision follows
an extensive consultation process as EVE seeks to increase brand awareness and drive aggressive sales
growth in new target markets. The initial focus will be Amazon UK and Germany as sites for listing
optimisation and advertising initiatives before broadening to other European markets. Meluka Australia is
currently preparing product shipments to Europe in preparation for the Amazon launches in 2021.

Meluka Australia Marketing Update
Consumer Brand Marketing Communications
The market was highly competitive in the last quarter of 2020 with annual sales events such as Black Friday,
Christmas and Boxing Day sales driving strong consumer interest to Meluka Australia’s sales channels.
Meluka Australia’s Christmas campaign was focused on linking brand equity to a desirable gifting solution
that appealed to our consumers. Five new gift pack SKUs were launched in this limited-edition range that
were packaged as all-ready gifts. The ad campaign was well-received by both new and existing consumers,
with a healthy growth of new users to the brand and a strong return rate of previous consumers compared
to the prior quarter.

Meluka Australia’s key brand priority is to accelerate new user acquisition whilst building on user loyalty. In
December, Meluka Australia started receiving brand and product recommendations from influencers in the
health & wellness space in Australia. These powerful brand testimonials have been used as brand content
for us to drive awareness among potential new customers.

The brand’s social media brand presence grew significantly with the improved social content and style,
driving high engagement rates. The ongoing focus is to create meaningful relevant content that will engage
the target audience and reinforce the unique health and wellness brand proposition of Meluka Australia.
Meluka Australia has grown to over 6,000 followers on both Facebook & Instagram platforms in just over a
year.

The design and content of direct CRM communications through emails have also been reviewed to improve
the shopping experience and entice recipients to act.

                                                              Page 5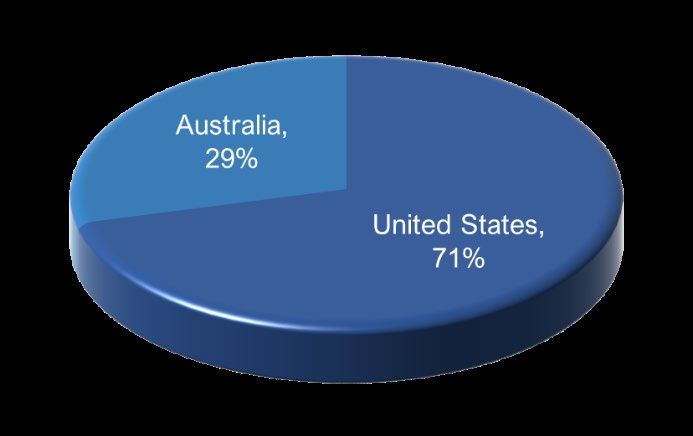
Jenbrook
Harvesting of tea tree oil from Jenbrook’s Robyndale farm plantation was completed in late October. Total
yield from this year’s harvest returned a positive result, having exceeded last year’s yield by 13%. Jenbrook
will now progress with wildcrafted harvesting that is set to commence in the old growth forest on its Jendale
property. This will provide an important source of continued tea tree oil supply during the next six months.

In addition, Jenbrook has secured a lease of a further 2,000 acres of land immediately adjoining its southern
boundary. This land is extensively covered with old growth forest which will be utilised for honey and
wildcrafted tea tree oil production.

Expanding the production of wildcrafted oil, as well as sales of third-party essential oils such as lemon myrtle
and eucalyptus, will allow the Jenbrook business to continue servicing its expanding customer base year-
round.

Naturally Australian Products Inc (49% EVE)
Naturally Australian Products (NAP), a US distribution business recorded revenue of $1.2 million in the
quarter, a small increase over the prior quarter in what is traditionally a quieter period for the business. NAP
has continued its strong performance, attributable to the growing demand for essential oils and extract
products in the US. NAP has developed strong relationships with several large skincare businesses and has
become a trusted supplier of high-quality bulk essential oils. These oils are sourced globally, with Australia
being a significant supply source, predominantly for tea tree, eucalyptus and lemon myrtle oils.

NAP is owned 49% by EVE, accordingly it is accounted for as an investment in an associate, meaning its
revenue is not consolidated into the Appendix 4C.

Omni Innovation
Omni Innovation (“Omni”) entered into a binding Term Sheet agreement with Myopharm Limited
(“Myopharm”), an unlisted Australian biotechnology company that has intellectual property assets for the
novel development of improving muscle growth and human therapeutic purposes. (See ASX Announcement
on 14 January 2021)

Myopharm will be granted a 15-year licence for the manufacture, marketing and distribution of Omni’s
foundation product, the clinically proven pre‐meal glycaemic control product for Type 2 diabetes and Pre‐
Type 2 diabetes, throughout Australia, mainland China and the UK/Europe.

Myopharm will position the product to be sold through a prescription channel in Australia and Europe, an
approach not explored by previous licence holders in those markets. The product is expected to be launched
through Myopharm in Australia in 2021 with the other territories to follow. Myopharm intends to complete
an IPO during 2021 on the ASX.

This agreement includes a mixture of upfront and deferred licencing fees as well as an on-going royalty on
product sales. Initial upfront consideration of $70,000 has already been received as well as $265,000 in
equity. Further cash payments of the initial licence fees of $565,000 are due in various instalments up to
31 January 2024. Additionally, on-going royalties equal to 5% of wholesale sales are payable up until 31
December 2027 and thereafter at a rate of 3%.

Omni is free to pursue licencing arrangements in other territories including the USA and India, both
territories with large populations of those living with diabetes and pre-diabetes as well as being markets
that Omni has patented its pre-meal drink technology.

                                                     Page 6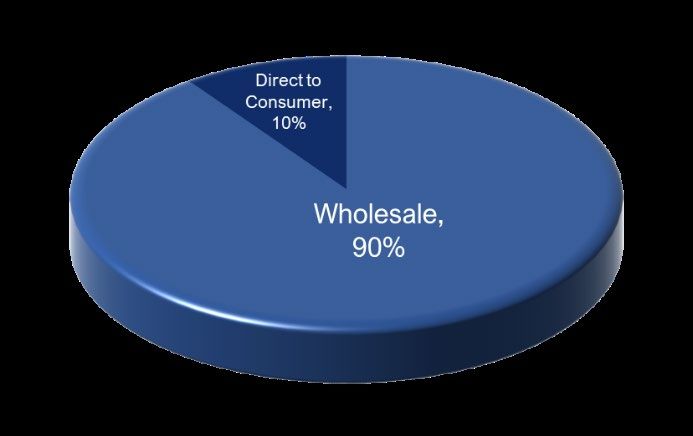
Corporate & Financial Update
Key statistics
   • Total unaudited group revenue for the quarter was $1.9 million
   • Cash at bank of $5 million
   • Inventory increased to $1 million
   • Receivables of $0.4 million
   • Creditors payable of $0.4 million
   • $1 million in debt facilities with $0.5 million drawn
   • Options converted during the quarter raised $76,000 before costs

The Company held its 2020 Annual General Meeting, all resolutions were passed by shareholders.

In accordance with Section 6 of the Appendix 4C, during the quarter the Company has paid $89,000 in
director fees and $47,000 for a fully provisioned office and administration staff.

Outlook
The Company has again produced a strong quarter with revenues only slightly lower (9.5%) than the previous
quarter due to no Chinese orders being placed in the quarter. This result reflected the substantial growth in
the US and Australian markets in both our branded and bulk products. During the quarter, growth is
expected to continue in the US and Canadian markets and further orders are expected from China. Also
expected is the first revenues from Japan as sales are expected to commence in early February.

Further planned growth initiatives over the next two quarters include the following;

   •   Commencement of sales to Whole Foods Market in the US
   •   Launch of products on Amazon Japan, UK and Germany
   •   Further orders from China
   •   Achieve increased sales volumes across the entire range
   •   Marketing programs to be expanded to build brand and product awareness
   •   Commencement of new product development in preparation of product launches
   •   Continued sales of bulk essential oils products from both on-farm and third-party suppliers
   •   Research and development program to include further advancement of tea tree extract and hydrosol
       products

Commenting on the update, Managing Director Bill Fry said:
“The December quarter was very pleasing with strong revenues achieved through good sales growth in the
US and Australia. Our Meluka Australia branded honey products continue to perform well with our Organic
Native Raw Honey now consistently ranked in the top twenty honey products selling on US Amazon. The
addition of several new regions in the next two quarters and the commencement of sales through Whole
Foods Market in the US will provide exciting avenues for continued sales growth.

The EVE team look forward to expanding operations in current markets and establishing in new regions in
the forthcoming quarters.”

Authorised for release by Bill Fry, Managing Director.

                                                   Page 7
For more information, please contact:

Company enquiries                                               Media enquiries
Bill Fry                                                        Melissa Hamilton
Managing Director                                               Media and Capital Partners
Eve Investments Ltd                                             P: +61 417 750 274
+61 8 6465 5500                                                 melissa.hamilton@mcpartners.com.au
billf@eveinvestments.com.au

About EVE Investments
EVE Investments (ASX: EVE) is a leading, vertically integrated producer of branded nutrition, health and wellness products. The
Company has global reach and application to fast-growing markets across Australia and New Zealand, Asia Pacific and North
America. Our mission is to help provide access to the world’s best natural organic products that have demonstrated medicinal
benefits and can help enrich the lives of everyday people.

For further information, please visit www.eveinvestments.com.au and follow us on Twitter @EVEInvestments

1
 Group revenue includes the revenue from all 100% owned subsidiaries as well as associates Naturally Australian Products
(49% owned by EVE) and Omni Innovation (38% owned by EVE), the figures for associates are not consolidated into the
following Appendix 4C.

                                                             Page 8
Appendix 4C

                                  Quarterly cash flow report for entities subject to Listing Rule 4.7B

For the purposes of the consolidated statement of cash flows, only cashflows from EVE, Jenbrook Pty Ltd and Meluka Health are included.
Cashflows from associates Naturally Australian Products and Omni Innovation are not included in the below figures.

          Name of entity

          EVE Investments Limited

          ABN                                                            Quarter ended (“current quarter”)

          89 106 523 611                                                                 31 December 2020

          Consolidated statement of cash flows                              Current quarter              Year to date (6
                                                                                $A’000                      months)
                                                                                                            $A’000
          1.      Cash flows from operating activities
          1.1     Receipts from customers                                                  1,034                        2,203
          1.2     Payments for
                  (a)    research and development                                             (4)                          (28)
                  (b) product manufacturing and operating costs                             (539)                       (988)
                  (c)    advertising and marketing                                          (365)                       (608)
                  (d) leased assets                                                          (26)                          (41)
                  (e)    staff costs                                                        (471)                       (926)
                  (f)    administration and corporate costs                                 (111)                       (373)
          1.3     Dividends received (see note 3)                                                -                            -
          1.4     Interest received                                                             8                           13
          1.5     Interest and other costs of finance paid                                    (4)                           (9)
          1.6     Income taxes paid                                                              -                            -
          1.7     Government grants and tax incentives                                         32                           92
          1.8     Other (provide details if material)                                            -                            -
          1.9     Net cash from / (used in) operating activities                            (445)                       (664)

          2.       Cash flows from investing activities
          2.1      Payments to or for acquire:
                   (a)    entities                                                               -                            -
                   (b) businesses                                                                -                            -
                   (c)    property, plant and equipment                                      (26)                       (136)
                   (d) investments                                                               -                            -
                   (e)    intellectual property                                                  -                            -
                   (f)    other non-current assets                                               -                            -

                                                                Page 9
Consolidated statement of cash flows Current quarter Year to date (6
$A’000 months)
$A’000
2.2 Proceeds from disposal of:
(a) entities - -
(b) businesses - -
(c) property, plant and equipment - -
(d) investments - -
(e) intellectual property - -
(f) other non-current assets - -
2.3 Cash flows from loans to other entities - -
2.4 Dividends received (see note 3) - -
2.5 Other (provide details if material) - -
2.6 Net cash from / (used in) investing activities (26) (136)
3. Cash flows from financing activities
3.1 Proceeds from issues of equity securities
(excluding convertible debt securities) - -
3.2 Proceeds from issue of convertible debt - -
securities
3.3 Proceeds from exercise of options 76 657
3.4 Transaction costs related to issues of equity (2) (18)
securities or convertible debt securities
3.5 Proceeds from borrowings - -
3.6 Repayment of borrowings - -
3.7 Transaction costs related to loans and - -
borrowings
3.8 Dividends paid - -
3.9 Other (provide details if material) - -
3.10 Net cash from / (used in) financing activities 74 639
4. Net increase / (decrease) in cash and cash
equivalents for the period
4.1 Cash and cash equivalents at beginning of
period 5,375 5,138
4.2 Net cash from / (used in) operating activities (445) (664)
(item 1.9 above)
4.3 Net cash from / (used in) investing activities (26) (136)
(item 2.6 above)
4.4 Net cash from / (used in) financing activities 74 639
(item 3.10 above)
4.5 Effect of movement in exchange rates on cash - -
held
4.6 Cash and cash equivalents at end of period 4,978 4,978
Page 105. Reconciliation of cash and cash equivalents Current quarter Previous quarter
at the end of the quarter (as shown in the consolidated $A’000 $A’000
statement of cash flows) to the related items in the
accounts
5.1 Bank balances 1,678 1,775
5.2 Call deposits 3,300 3,600
5.3 Bank overdrafts - -
5.4 Other (provide details) - -
5.5 Cash and cash equivalents at end of quarter 4,978 5,375
(should equal item 4.6 above)
6. Payments to related parties of the entity and their associates Current quarter
$A'000
6.1 Aggregate amount of payments to related parties and their associates 136
included in item 1
6.2 Aggregate amount of payments to related parties and their associates
included in item 2
Note: if any amounts are shown in items 6.1 or 6.2, your quarterly activity report must include a description of, and an explanation for,
such payments.
7. Financing facilities Total facility amount Amount drawn at
Note: the term “facility’ includes all forms of financing at quarter end quarter end
arrangements available to the entity.
$A’000 $A’000
Add notes as necessary for an understanding of the sources
of finance available to the entity.
7.1 Loan facilities 998 523
7.2 Credit standby arrangements
7.3 Other (please specify)
7.4 Total financing facilities
7.5 Unused financing facilities available at quarter end 475
7.6 Include in the box below a description of each facility above, including the lender, interest rate,
maturity date and whether it is secured or unsecured. If any additional financing facilities have been
entered into or are proposed to be entered into after quarter end, include a note providing details
of those facilities as well.
Business Loan (maturity of 25/03/2034) and Revolving Agri Line Facility (on-going) provided by ANZ
to Jenbrook Pty Ltd. Interest rate is 2% less than the Business Mortgage Index Rate (variable).
Security provided over the Robyndale farm.
On acquisition of Meluka Health, an existing shareholder loan of $100,613 became a facility of the
group. This loan is unsecured with nil interest and is due on 25/02/2022.
Page 118. Estimated cash available for future operating activities $A’000
8.1 Net cash from / (used in) operating activities (item 1.9) (445)
8.2 Cash and cash equivalents at quarter end (item 4.6) 4,978
8.3 Unused finance facilities available at quarter end (item 7.5) 475
8.4 Total available funding (item 8.2 + item 8.3) 5,423
8.5 Estimated quarters of funding available (item 8.4 divided by item 8.1) 12
Note: if the entity has reported positive net operating cash flows in item 1.9, answer item 8.5 as “N/A”. Otherwise, a figure for
the estimated quarters of funding available must be included in item 8.5.
8.6 If item 8.5 is less than 2 quarters, please provide answers to the following questions:
8.6.1 Does the entity expect that it will continue to have the current level of net operating cash
flows for the time being and, if not, why not?
Answer:
8.6.2 Has the entity taken any steps, or does it propose to take any steps, to raise further cash to
fund its operations and, if so, what are those steps and how likely does it believe that they
will be successful?
Answer:
8.6.3 Does the entity expect to be able to continue its operations and to meet its business
objectives and, if so, on what basis?
Answer:
Note: where item 8.5 is less than 2 quarters, all of questions 8.6.1, 8.6.2 and 8.6.3 above must be answered.
Compliance statement
1 This statement has been prepared in accordance with accounting standards and policies which comply with Listing
Rule 19.11A.
2 This statement gives a true and fair view of the matters disclosed.
Date: 28 January 2021
Authorised by: Bill Fry, Managing Director
(Name of body or officer authorising release – see note 4)
Notes
1. This quarterly cash flow report and the accompanying activity report provide a basis for informing the market about the entity’s activities for the past
quarter, how they have been financed and the effect this has had on its cash position. An entity that wishes to disclose additional information over and
above the minimum required under the Listing Rules is encouraged to do so.
2. If this quarterly cash flow report has been prepared in accordance with Australian Accounting Standards, the definitions in, and provisions of, AASB
107: Statement of Cash Flows apply to this report. If this quarterly cash flow report has been prepared in accordance with other accounting standards
agreed by ASX pursuant to Listing Rule 19.11A, the corresponding equivalent standard applies to this report.
3. Dividends received may be classified either as cash flows from operating activities or cash flows from investing activities, depending on the accounting
policy of the entity.
4. If this report has been authorised for release to the market by your board of directors, you can insert here: “By the board”. If it has been authorised for
release to the market by a committee of your board of directors, you can insert here: “By the [name of board committee – eg Audit and Risk
Committee]”. If it has been authorised for release to the market by a disclosure committee, you can insert here: “By the Disclosure Committee”.
5. If this report has been authorised for release to the market by your board of directors and you wish to hold yourself out as complying with
recommendation 4.2 of the ASX Corporate Governance Council’s Corporate Governance Principles and Recommendations, the board should have
received a declaration from its CEO and CFO that, in their opinion, the financial records of the entity have been properly maintained, that this report
complies with the appropriate accounting standards and gives a true and fair view of the cash flows of the entity, and that their opinion has been
formed on the basis of a sound system of risk management and internal control which is operating effectively.
Page 12You can also read