Sapporo Group Business Results Presentation for the Nine Months Ended September 30, 2018 - November 2, 2018

Page created by Amanda Morrison
 
CONTINUE READING
Sapporo Group Business Results Presentation for the Nine Months Ended September 30, 2018 - November 2, 2018
Sapporo Group Business Results Presentation
for the Nine Months Ended September 30, 2018

                                                            November 2, 2018
                               URL http://www.sapporoholdings.jp/english

                                      Copyright, 2018 SAPPORO HOLDINGS LTD. All rights reserved.   1/41
Sapporo Group Business Results Presentation for the Nine Months Ended September 30, 2018 - November 2, 2018
Performance improved in each business despite impact of unseasonal
                 weather and natural disasters
       
                   Japanese Alcoholic Beverages                                           International                                                Food & Soft Drinks
                                                                                                                                   40
  60
 8.0                                                    5.3            20
                                                                       2.0                                                         4.0
                                       4.2 4.1                                                           0.6 0.6                                                                   2.6
 6.0
  40
                                                                        0                                                                                                    1.6
 4.0                                                                    0                                                          20                                                           1.1
                                                                                                                                   2.0
  20
 2.0                                                                 ▲ 20
                                                                      ‐2.0
   0                                                                                                                                0
  0
                                                                                                                                    0
                                                                     ▲ 40
▲ 20
‐2.0                                                                  ‐4.0                                             ‐3.8
‐4.0
▲ 40                                                                 ▲ 60                                                        ▲ 20
                                                                      ‐6.0                                                        ‐2.0     Jan‐Mar            Apr‐Jun            Jul‐Sep          Oct‐Dec
         1‐3⽉            4‐6⽉            7‐9⽉           10‐12⽉               Jan‐Mar
                                                                              1‐3⽉          Apr‐Jun
                                                                                            4‐6⽉           Jul‐Sep
                                                                                                            7‐9⽉       Oct‐Dec
                                                                                                                       10‐12⽉              1‐3⽉              4‐6⽉               7‐9⽉             10‐12⽉
       Jan‐Mar          Apr‐Jun        Jul‐Sep         Oct‐Dec
               2017
               2017年    国内酒類
                    Japanese                国内酒類
                                     2018 Japanese
                                     2018年         Alcoholic                           2017
                                                                                       2017年    国際
                                                                                                       2018
                                                                                                       2018年   国際                               2017年 ⾷品・飲料
                                                                                                                                                2017                       2018 ⾷品・飲料
                                                                                                                                                                           2018年
               Alcoholic Beverages   Beverages                                         International   International                            Food & Soft Drinks         Food & Soft Drinks

 ★ Key point for the Jul-Sep quarter                                 ★ Key point for the Jul-Sep quarter                         ★Key point for the Jul-Sep quarter
   Despite strong impact of disasters, profit came to                   Vietnam turned profitable and contributed to              Profit rose by overcoming the confusion in the
   levels similar to the previous year                                  profit exceeding the previous year’s level                distribution network
                                                                     
                                       A YoY profit increase of approx. ¥4.5 billion is            
 A YoY profit increase of approx. ¥0.4 billion is                    necessary in the Oct-Dec quarter.                           A YoY profit increase of approx. ¥1.3 billion is
 necessary in the Oct-Dec quarter. We will work on                   In 4Q 2017, profit declined by ¥2.7 billion due to          necessary in the Oct-Dec quarter.
 Black Label beer, which has remained strong                         impairment loss related to Vietnam and saw loss             We aim to attain our targets by carrying out active
 compared with overall demand, and 99.99 (RTD),                      exceeding ¥1.0 billion in the second half due to            sales promotion activities in 4Q, the peak period for
 which has been selling well.                                        worsened performance at SSC. We aim to attain our           soup and other such products.
                                                                     targets with the improvement from the integration of
                                                                     SSC and CPF and no more impact from the                             Copyright, 2018 SAPPORO HOLDINGS LTD. All rights reserved.   2/41
                                                                     impairment in Vietnam.
Sapporo Group Business Results Presentation for the Nine Months Ended September 30, 2018 - November 2, 2018
Restaurants                                              Real Estate                                                        Corporate, Other

  2.0
  20                                                    404.0
                                                                                              3.3
                                                                                                    3.6                       0
                                                                                                                                  0
                                                                                                                 2.8
                                  0.5 0.3
   00                                                   202.0                                                              ▲ 20
                                                                                                                             ‐2.0                                              ‐1.4
                                                                                                                                                                                              ‐1.6
                                                                                                                                                                        ‐1.5
                                              ‐0.6
▲‐2.0
  20                                                     0 0                                                               ▲ 40
                                                                                                                             ‐4.0
        Jan‐Mar
           1‐3⽉     Apr‐Jun
                     4‐6⽉         Jul‐Sep
                                    7‐9⽉      Oct‐Dec
                                               10‐12⽉             1‐3⽉
                                                                Jan‐Mar        4‐6⽉
                                                                              Apr‐Jun           7‐9⽉
                                                                                              Jul‐Sep             10‐12⽉
                                                                                                                Oct‐Dec               Jan‐Mar
                                                                                                                                         1‐3⽉           Apr‐Jun
                                                                                                                                                          4‐6⽉            Jul‐Sep
                                                                                                                                                                             7‐9⽉          Oct‐Dec
                                                                                                                                                                                             10‐12⽉

                  2017
                  2017年  外⾷
                  Restaurants   2018年 外⾷
                                2018
                                Restaurants
                                                                          2017年
                                                                          2017   不動産
                                                                               Real Estate   2018年 不動産
                                                                                             2018 Real Estate                             2017年  全社+その他
                                                                                                                                          2017 Corporate + other        2018年
                                                                                                                                                                        2018   全社+その他
                                                                                                                                                                             Corporate + other

  ★ Key point for the Jul-Sep quarter                   ★ Key point for the Jul-Sep quarter
                                                                                                                           ★ Key point for the Jul-Sep quarter
    Existing restaurants struggled, while revenues        Profitability continued to improve, resulting in
                                                                                                                             Reduced corporate costs
    also fell due to disasters                            strong performance

  A YoY profit increase of approx. 0.8 billion yen is
                                                        While disaster-damage-related repairs are required,                We are working on reduction of corporate costs
  necessary in the Oct-Dec quarter.
                                                        we expect to solidly attain our upward-revised                     and expect to attain the level of our revised
  In the 4Q 2017, the business posted -¥0.6 billion
                                                        targets.                                                           targets.
  resulting from impairment of some restaurants, etc.
  While a tough business environment including high
  ingredient and personnel expenses is expected to
  continue, we have been improving menu control
  and operations. We aim to attain our targets by
  leveraging new well-performing restaurants and
                                                                                                                                                                                         (billions of yen)
  refurbished restaurants.
                                                                                                                                       Copyright, 2018 SAPPORO HOLDINGS LTD. All rights reserved.   3/41
Sapporo Group Business Results Presentation for the Nine Months Ended September 30, 2018 - November 2, 2018
2018
                           Third-Quarter 2018 Highlight
                                                                                                                                     3Q
              While both sales and profits fell due to the poor performance in the first
              half, operating profit for the Jul-Sep period increased about ¥1.3 billion.
                                YoY                                                                                                              (billions of yen)
                              change
                                                                                          Profit attributable to
    Revenue                                  Operating Profit
                                                                                 YoY
                                                                                          owners of parent
                                                                               change
          2017 3Q(IFRS)                          2017 3Q(IFRS)                                2017 3Q(IFRS)

          2018 3Q(IFRS)                          2018 3Q(IFRS)                                2018 3Q(IFRS)                                            YoY
                                                                                                                                                     change

*See p.6, 7 for details                     *See p.8, 9 for details

                                            Operating profit declined ¥2.9 billion due
                                             to struggles with new genre Japanese
                                             alcoholic beverages and stagnation in the
                                             high price range market
  The Japanese alcoholic beverages and
   food and soft drinks businesses saw      Unsettled weather and natural disasters        Declined ¥1.1 billion due to the decline
   large declines in sales, resulting in     including heavy rain in Western Japan           in operating profit
   revenue decline of ¥9.7 billion           and an earthquake in Hokkaido put
                                             downward pressure on earnings due to
                                             lost sales opportunities, increased
                                             logistics expenses, a decline in
                                             restaurant customers, and the need to
                                             repair some facilities
                                                                                                   Copyright, 2018 SAPPORO HOLDINGS LTD. All rights reserved.   4/41
Sapporo Group Business Results Presentation for the Nine Months Ended September 30, 2018 - November 2, 2018
2018
                                       Third-Quarter 2018 Highlights
                                                                                                                                                                    3Q
                                                                                                                                                                                (billions of yen)

       Balance of net debt                                       Equity                                                Cash basis investment

            2017 3Q(IFRS)                                             2017 3Q(IFRS)

                                                                                                                                2018 plan
            2018 3Q(IFRS)                                             2018 3Q(IFRS)

       D/E ratio               times                           *See p.16, 17 for details
                                                               of BS                                                  *See p.15 for details

    Transformation of the Group
                                                                                             Group Topics
    management platform
                                                                                             Selected for the FTSE4Good Index Series and FTSE Blossom
                                                                                              Japan Index
 First in the world! Sapporo measures the color of beer foam                                Prior start of joint collection of beer pallets in 6 prefectures in
     〜”The foam of fresh beer is whiter and more beautiful”〜
     〜”Crystal malt enhances the color of foam”〜                                              Tohoku
                                                                                                 〜Four beer manufacturers to reduce annual CO2 emissions by about 735t
    Won Gold at the first “gan-ally-bu” Awards                                                  (about 56% compared with previous level)
       〜Strengthening the company with dialogue and systems that allow cancer
       patients to work more comfortably〜                                                      The 10th Yebisu Beer Festival
                                                                                                〜Donated amount equivalent to beer sales to disaster-stricken areas
                                                                                                 Total donation until the end of last year reached about 120 million yen
                                                                *See p.18, 19 for details
                                                                                                                                  Copyright, 2018 SAPPORO HOLDINGS LTD. All rights reserved.   5/41
Sapporo Group Business Results Presentation for the Nine Months Ended September 30, 2018 - November 2, 2018
2018
                                                      Revenue by Segment
                                                                                                                                                                                             3Q
                                                                                                                                                                                              (billions of yen)
                                                                                                  Change                              (IFRS)                                       (③-②)
                                                                                                             (②-①)                                                     (③-②)
   Consolidated
   revenue                                      400.8                                                     (10.1)                                                                                -2.5%
        Japanese Alcoholic
        Beverages*                                201.4                                                      (13.8)                                                                                -4.2%
                                                                                                (Rebate subtracted from revenue -13.9)

        International
        Business*                                    49.3                                                            8.5                                                                             2.1%
                                                                                                (Change in price to include liquor tax +8.5)

        Food and Soft Drinks                      101.5                                                          (4.3)                                                                             -3.1%
                                                                                                (Rebate subtracted from revenue -3.7)

        Restaurants                                  22.1                                                        (0.3)                                                                             -4.0%
                                                                                                (Rebate subtracted from revenue -0.3)

        Real Estate                                  18.0                                                        (0.2)                                                                               3.0%

        Other                                           8.5                                                          0.0                                                                             2.8%
*From 2018, the export business of Sapporo International Inc. was transferred to Sapporo Breweries Ltd.
 The figures for 2017 have been retroactively adjusted to reflect this.
                                                                                                                                                                                 Factors are explained
                                                                                                                                                                                   in the next slide
                                                                                                                                                           Copyright, 2018 SAPPORO HOLDINGS LTD. All rights reserved.   6/41
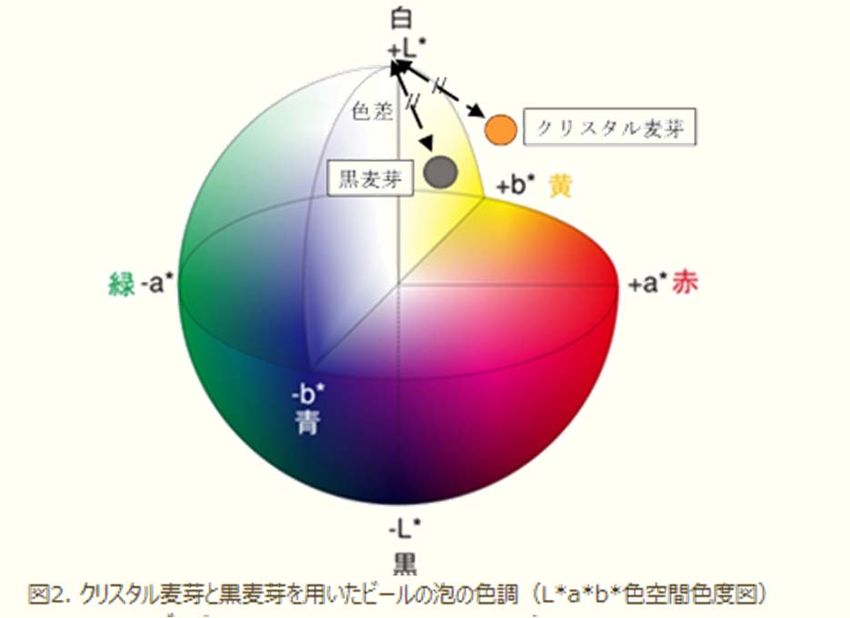
Sapporo Group Business Results Presentation for the Nine Months Ended September 30, 2018 - November 2, 2018
2018
        Main Factors Contributing to Changes in Revenue
                                                                                                                                                                               3Q
       : The main factors are revenue declines in the high price range                                                                                                                            = Increase

       beer and new genre categories                                                                                                                                                             = Decrease

(billions of yen)         Japanese Alcoholic                                                                              Food & Soft                                    Real
                              Beverages                                     International                                                           Restaurants
                                                                                                                            Drinks                                      Estate

2017
 3Q

                               Diversified product         Sleeman, etc. +0.6
                               offerings &                                                                     Sales decline in canned coffee in
                                                           Anchor +2.1
                               nonalcoholic beer +2.8                                                          1H and net decline in sales due to
                               Exports +0.7
                                                           (see p.14)
                                                                                                               business transfer of NH Beans (Dec
                               Rebate subtraction -0.3,
                               etc.                                                                            2017) (see p.14)

                                                                                                                                                                                                           2018
                                                                                                                                                                                                            3Q

          *From 2018, the export business of Sapporo International Inc. was transferred to Sapporo Breweries Ltd.                            Copyright, 2018 SAPPORO HOLDINGS LTD. All rights reserved.   7/41
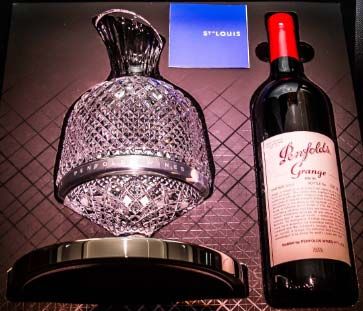
Sapporo Group Business Results Presentation for the Nine Months Ended September 30, 2018 - November 2, 2018
2018
                                            Operating Profit by Segment
                                                                                                                                                                                          3Q
                                                 ① 2017 3Q                      ② 2017 3Q                 Change 
                                                                                                                        (②-①)                           (IFRS)                          (③-②)
Consolidated operating
profit                                                    10.7                                                              (1.0)
                                                                                                          (Retirement benefit expenses -1.0, etc.)

        Japanese Alcoholic
        Beverages*                                            6.2                                                              (1.5)
                                                                                                           (Depreciation and amortization -0.9,
                                                                                                           retirement benefit expenses -0.5, etc.)

        International*                                    (0.1)                                                                      1.2
                                                                                                           (Non-amortization of goodwill +1.2, etc.)

        Food and Soft Drinks                              (0.2)                                                                      1.6
                                                                                                           (Non-amortization of goodwill +1.6, etc.)

        Restaurants                                           0.3                                                              (0.1)
                                                                                                           (Depreciation and amortization -0.1)

        Real Estate                                           8.8                                                              (1.4)
                                                                                                           (Real-estate tax-0.5, depreciation and
                                                                                                           amortization -0.3, etc.)

        Other                                             (0.1)                                                                (0.1)
                                                                                                           (Reclassification -0.1)

        Corporate                                         (4.1)                                                                (0.7)
                                                                                                           (Retirement benefit expenses -0.5,
                                                                                                           reclassification -0.2)
*From 2018, the export business of Sapporo International Inc. was transferred to Sapporo Breweries Ltd.
 The figures for 2017 have been retroactively adjusted to reflect this.
                                                                                                                                                                                           Factors are explained
                                                                                                                                                                                                 in the next slide
                                                                                                                                                          Copyright, 2018   SAPPORO HOLDINGS LTD. All rights reserved. 8/41
Sapporo Group Business Results Presentation for the Nine Months Ended September 30, 2018 - November 2, 2018
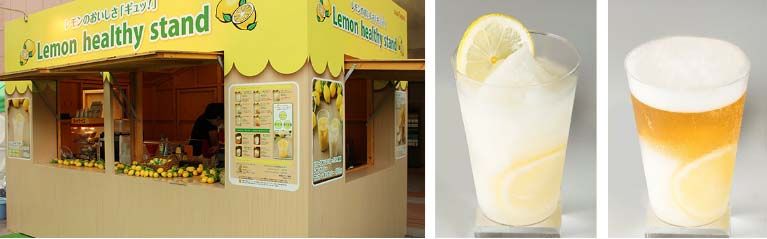
Main Factors Contributing to Changes in Operating Profit
                                                                                                                                                                                          2018
                                                                                                                                                                                           3Q
           : Significant profit increase in Vietnam, Real Estate continues to be strong
                                                                                                                                                                                                            = Increase
           While RTD led Japanese Alcoholic Beverages, profit declined due to lower sales of beer and
                                                                                                                                                                                                           = Decrease
           beer-type beverages
                                                Japanese                                                                       Food & Soft                                           Real
                                           Alcoholic Beverages                                       International               Drinks                 Restaurants                 Estate
(billions of yen)

  2017
   3Q

                                                                                                                           Valuation difference
                                                 Product mix +0.8                        North American alcoholic          resulting from renewal of
                                                 Non-alcohol beer, RTD+1.6               beverages -0.8                    production facility in      Review of business
                                                 Manufacturing costs, etc.               North American soft               Malaysia +0.7               portfolio +0.1
                                                  -1.0                                   drinks -0.5                                                   Impact of                                                    2018
                                                                                                                       Sales volume -0.8               disasters, etc.                                               3Q
                                                                                                   Incl. Anchor -0.5   Manufacturing cost              -0.1
                                                                                                                       +0.3

*Reclassification under IFRS: Other non-operating revenues and expenses as well las extraordinary income and loss
                                                                                                                                                       Copyright, 2018 SAPPORO HOLDINGS LTD. All rights reserved.   9/41
Sapporo Group Business Results Presentation for the Nine Months Ended September 30, 2018 - November 2, 2018
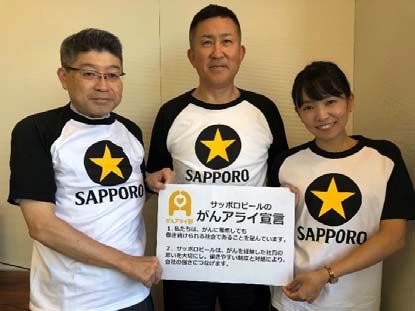
Japanese Alcoholic         Revenue
                                                     YoY
                                                                                         IFRS
                                                                                       Operating                       YoY
                                                                                                                                                                                        2018
                                                    Change
        Beverages                                                                       profit                        Change

                                                                                                         *YoY change is on an IFRS basis
                                                                                                                                                                                         3Q
                                                                                                                            
Positive                                                                                                115                                                                                       *Cumulative

            Black Label brand cans were up % year on year                                              110
             exceeding total demand growth rate for beer and                                            105
             growing steadily                                                                           100

                                                                                                         95
            RTD was up        % year on year                                                            90
                                                                                                              Jul.   Aug.   Sep.   Oct.   Nov.    Dec.    Jan. Feb. Mar. Apr. May Jun. Jul. Aug. Sep.

             led by 99.99 (four nine)                                                                                                                     2018 2018 2018 2018 2018 2018 2018 2018 2018

                                                                                                                            Total demand for beer                                        Black Label
                                         *Black Label is based on sales volume and RTD on sales value

                                                                                                                                *Cumulative
                                                                                                        110

                                                                                                        100
            Sales volume of new genre products was down                                         %
             year on year                                                                                90

                                                                                                         80

                                                                                                         70
            Demand for high price range beer market continues to 60
             stagnate                                                                                         Jul    Aug     Sep    Oct     Nov     Dec      Jan
                                                                                                                                                            2018
                                                                                                                                                                    Feb
                                                                                                                                                                   2018
                                                                                                                                                                          Mar
                                                                                                                                                                          2018
                                                                                                                                                                                  Apr
                                                                                                                                                                                 2018
                                                                                                                                                                                        May
                                                                                                                                                                                        2018
                                                                                                                                                                                                Jun
                                                                                                                                                                                               2018
                                                                                                                                                                                                       Jul
                                                                                                                                                                                                      2018
                                                                                                                                                                                                             Aug
                                                                                                                                                                                                             2018
                                                                                                                                                                                                                     Sep
                                                                                                                                                                                                                    2018

Negative                                                                                                              Total demand for new genre                                               Mugi to Hop
                                                                                                                               Copyright, 2018 SAPPORO HOLDINGS LTD. All rights reserved.                           10/41
IFRS                                                          2018
           International          Revenue
                                               YoY
                                              change
                                                                  Operating              YoY
                                                                                        change
                                                                   profit
                                                                              *YoY change is on an IFRS basis
                                                                                                                                   3Q
                                                                                       
Positive     Sales at Sleeman continued to increase                      500                                             (unit: 10,000 cases, large bottle count)

                                                                          400

                                                                          300
             Sapporo brand expanded overseas
                                                                                                                               467
              Double digit growth in Canada                               200                                      394 417 462
                                                                                                           337 365
                                                                                                 282
                                                                          100      184 201
             Vietnam earnings improved ¥         billion, with               0
              2018 3Q also profitable                                              2010 2011 2012 2013 2014 2015 2016 2017 2018
                                                                                                          SAPPORO Brand
                                                                                      
              drinks to start showing in the fourth quarter                   75
                                                                              70

             Anchor is carrying out the groundwork for next year             65

              onwards, but is facing difficulties in the immediate            60

              future due to stagnant market                                   55

              Steps to be taken to ensure brand strengthening by              50
                                                                                        1Q                  2Q                 3Q                  4Q
              focusing on San Francisco
                                                                                                       2016        2017        2018
Negative                                                                                                   (US$ millions)
             Logistics cost increased in the USA                                            Copyright, 2018 SAPPORO HOLDINGS LTD. All rights reserved.   11/41
IFRS                                                                  2018
      Food & Soft Drinks         Revenue
                                               YoY
                                              change
                                                            Operating                   YoY
                                                                                       change
                                                              profit
                                                                             *YoY change is on an IFRS basis
                                                                                                                                     3Q
            Sales volume of lemon-based products were                   
Positive                                                                                                                              *Cumulative
             up    % year on year                                   120

            Soy and chilled products, which we are currently       115
              cultivating, were up   % year on year
                                                                    110
              Installation of manufacturing facility for soy
              yoghurt proceeding toward start of operations in      105
              March next year
                                                                    100

            Maintained high share in Singapore with domestic           95
             sales also staying strong                                   2017 1Q    2017 2Q      2017 3Q      2017 4Q     2018 1Q     2018 2Q       2018 3Q

                                                                    105
            Decline in coffee drinks bottomed out but sales        100
                                                                                                                                      *Cumulative

             volume fell about 20% year on year                         95
             → Shored up sales by launching Hokuo Black                 90
               Coffee, etc.                                             85
                                                                        80
                                                                        75
            Fall in sales due to Middle Eastern commodity tax          70
             → Promoting product development to suit the local          65
Negative       taste                                                    60
                                                                         2017 1Q    2017 2Q      2017 3Q      2017 4Q     2018 1Q      2018 2Q      2018 3Q
                                                                                              Copyright, 2018 SAPPORO HOLDINGS LTD. All rights reserved.      12/41
Revenue      YoY                                                Revenue                       YoY

     Restaurants      IFRS
                                change
                                                        Real Estate                  IFRS
                                                                                                                 change

                    Operating    YoY                                               Operating                      YoY
                      profit    change                                               profit                      change

Positive                                          Positive
            Strong performance by                            All mainstay properties maintained
             Yebisu Bar format                                 stable occupancy rates
                                                              Carried out strategic reallocation of
            Transferred Japanese restaurants,                 properties in accordance with
             etc. in Singapore to local company                Medium-Term Management Plan
             →Focus on beerhall format                         Promoted Ebisu urban development
                                                               *Transferred 2 properties for ¥7.25 billion in Shinjuku, etc.
                                                               Acquired 3 rental properties in Shibuya ward for ¥6.4 billion

            Comparable-store sales were down                 No significant factors
               % year on year

Negative                                          Negative
                                                                            Copyright, 2018 SAPPORO HOLDINGS LTD. All rights reserved.   13/41
2018
         Special Factors in the Business Results
                                                                                                                                3Q
 Impact of exchange rates on operating profit is negligible
          
                                                                                                  Impact on
           Business segment                              Details
                                                                                                   revenue

                                 ANCHOR BREWING COMPANY, LLC                                         Approx.
             International       Consolidation began in October 2017                          +¥2.1 billion
             Food & Soft         NH Beans *Former Nihon Beans                                        Approx.
               Drinks            Transfer of business in December 2017                        -¥1.9 billion

                       2017 3Q           2018 3Q
                                                                                                    Impact on
            US$              ¥111.89        ¥109.61                                                  revenue
                                                                         Japanese Alcoholic
                                                                                                           -
            EUR            ¥124.58          ¥130.87                          Beverages
                                                                                                      Approx.
           CAN$              ¥85.66           ¥85.11                        International
                                                                                                -¥0.8 billion
            SG$              ¥80.53           ¥81.78                     Food & Soft Drinks               -
                                                                                                                                     -: negligible impact

                                                                                              Copyright, 2018 SAPPORO HOLDINGS LTD. All rights reserved.   14/41
2018
                                                       Financial Status
                                                                                                                                                                   3Q
      Cash basis investment totaled ¥24.0 billion                                                            ①
                                                                                                                 consolidated total of approx. ¥                            billion
                               <Changes in cash basis investment>                                                (tangibles, intangibles)
45
                                                                                                              
                                                                      Cash flow from investment               - “Alcoholic Beverages,” “Food,” “Soft Drinks” –related:
40                                                                            activities:                                                                 about ¥11.0 billion
                                                                                                                  Mini brewery-related works, filter introduction related work, etc.:
35                                                                                                                                                                about ¥4.2 billion
                                                                                        billion                   Capital investment in Sleeman, etc.: about ¥1.2 billion
                                                                                                                  Soy milk-related work: about ¥2.3 billion, etc.
30                                                             11.8     planned in four years                 - SGM Group infrastructure streamlining, etc.: about ¥1.8 billion
                                                                         (¥35.8 billion planned                   *SGM: Sapporo Group Management Ltd.
                                                                          in 2018 full-year)                  ② consolidated total of
25
                                                                                                                 approx. ¥             billion
20                     40.2
                                                   36.5
                                                                                                              ③ consolidated total of approx. ¥
15       29.5                        31.0
                                                                                                               billion *Except lease fees for restaurant furniture
                                                               24.0                                           ④ approx. ¥                            billion in
10
                                                                                                               consolidated total
                                                                                                                 (Long-term prepaid expenses, investment securities, etc.)
 5
                                                                                                              ①+②+③+④ 
 0                                                                                                            (Cash basis; including current capital expenditure, lease fees)
          2014          2015          2016          2017       2018      2019         2020
       (full‐year)   (full‐year)   (full‐year)   (full‐year)   (3Q)                                            approx. ¥                 billion

                                                                                          (billions of yen)                      Copyright, 2018 SAPPORO HOLDINGS LTD. All rights reserved.   15/41
2018
                              Changes in Balance Sheets
                                                                                                                 3Q
   : Total assets declined ¥19.9 billion compared with the end of
   the previous year
                                           Total assets
                                                               Total assets
Cash and cash equivalents                                                                              (billions of yen)

                                              12.5               10.8
Trade receivables
    →Seasonal factors, etc.
                                              98.3               80.8                                 Current assets

Inventories
                                              37.9               39.9
                                              16.0               14.7

Other current assets                         164.7              165.8

Fixed assets
                                                                                                   Non-current assets

                                             219.7              218.1
Investment property

Goodwill                                      24.9               24.9
                                              90.7               89.8
Other non-current assets
                                         End of 2017 (IFRS)   2018 3Q (IFRS)
                                                                               Copyright, 2018 SAPPORO HOLDINGS LTD. All rights reserved.   16/41
2018
                                Changes in Balance Sheets
                                                                                                                             3Q
:Total liabilities down by ¥15.1 billion, total equity down by
 ¥4.8 billion compared with the end of the previous year
Trade payables                             Total liabilities and
                                                  equity           Total liabilities and
                                                                          equity                                   (billions of yen)

Short-term financial liabilities
                                                 36.5                    36.3
Other current liabilities
                                                 80.7                    75.4                                     Current liabilities

   →Decline in liquor tax payable and
   income tax payable                           111.6                    98.8
Long-term financial liabilities
   →Bond issuance

Net defined benefit liability
                                                153.2                   157.0                                  Non-current liabilities

                                                 6.3                      7.7
Other non-current liabilities                   100.7                    98.8
                                                                                                                          Equity
Total equity attributable to
                                                172.1                   167.9
owners of parent
→3Q profit, payment of dividends
Non-controlling interests                          3.7                    3.0
                                           End of 2017 (IFRS)       2018 3Q (IFRS)

                                                                                           Copyright, 2018 SAPPORO HOLDINGS LTD. All rights reserved.   17/41
2018
     Transformation of the Group management platform
                                                                                                                                                                                                             3Q
  R&D                                                               First in the world! Sapporo measures the color of beer foam
                                                                - ”The foam of fresh beer is whiter and more beautiful,” “crystal malt enhances the color of foam” -

Sapporo Breweries Ltd. developed a method to measure the color of beer foam for the first time in the world and discovered that
the foam is whiter in fresh beer and also that the color of the foam changes depending on the malt used for brewing the beer.
We will be using this technology now for quality management required to realize whiter and more beautiful foam as well as to
develop new products that are particular about the color of the foam.   http://www.sapporobeer.jp/news_release/0000022014/index.html

                                                                                                                                                             White
                         Whiteness of foam (color difference)

                                                                   Storage temperature
                                                                                                                                                       Color
                                                                                                                                                    difference               Crystal malt

                                                                                                                                                      Black malt             Yellow

                                                                                                                              Green                                                         Red

                                                                                                                                                   Blue

                                                                Immediately      One month   Two months     Three months
               *Whiteness of foam:                              after shipping
               Lower the value whiter                                                 Duration of storage
               the foam
                                                                                                                                                             Black

              Fig 1. Change in whiteness of foam when amber colored beer is stored                                         Fig 2. Color of beer foam using crystal malt and black malt (L*a*b* color space chromaticity diagram)

                                                                                                                                                                           Copyright, 2018 SAPPORO HOLDINGS LTD. All rights reserved.   18/41
2018
         Transformation of the Group management platform
                                                                                                                                                       3Q
Personnel, human
    resources
                                        Won Gold Medal at the 1st gan-ally-bu AWARDs 2018
                           -Strengthening the company with dialogue and systems that allow cancer patients to work more comfortably-

  Sapporo Breweries Ltd. won a gold medal at the 1st gan-ally-bu Award, sponsored by “gan-ally-bu,” a private project tackling
  issues relating to cancer and employment. We would like to build this initiative into one of the Group’s strengths, offering a work
  environment that is more comfortable for people with cancer and engaging in dialogue to honor the wishes of employees with
  cancer who hope for a society where those suffering from cancer can continue working.
                                                                                          http://www.sapporobeer.jp/news_release/0000022032/index.html

                                         ・ Has a system in place for employees suffering from cancer and their superiors to obtain information necessary to balance
                                         both work and treatment by providing the “Manual to Support Treatment and Work”.

                                         ・ Has a system in place for an employee to continue working while undergoing treatment by enabling flexible working
                                         through the introduction of a hourly paid holiday system, a super flextime system, and telecommuting.

                                         ・ The company partially subsidizes lifestyle diseases-related health examinations (examinations cover areas included in
                                         medical examinations conducted by health insurance societies, etc. as well as cancer examinations) and has a system that
                                         allows employees to undergo examinations during working hours.

                                         ・ Has appointed industrial physicians and public health nurses to offices around the nation, and has a system where
                                         employees can have health consultations easily.

                                         ・ Has a system where employees can consult an in-house advisor regarding their careers, as well as their own health and
                                         family matters.
                                                                                                                     Copyright, 2018 SAPPORO HOLDINGS LTD. All rights reserved.   19/41
Appendix

           Copyright, 2018 SAPPORO HOLDINGS LTD. All rights reserved.   20/41
Major sales & sales volume

Appendix                            -

                                        Copyright, 2018 SAPPORO HOLDINGS LTD. All rights reserved.   21/41
【Beer】(sales volume)                                <Y-o-y change in sales volume of
                                                                          %
                                                                                 3 core brands>
                     Jan-Sep down     % y-o-y (total demand down 6%)115

                      Black Label Brand total down       % y-o-y          105

                        (Sales of the canned version:up   %   y-o-y)       95

                      Yebisu Brand total down       % y-o-y               85

                                                                           75
                     【Happoshu and new genre】
                                            (sales volume)                       Jan   Feb    Mar       Apr      May       Jun      Jul      Aug       Sep
  Appendix            Jan- Sep down      %
                                                                                        Total beer demand                Sapporo total
Japanese Alcoholic                                                                      Black label                      Yebisu
                       (total demand unchanged)
    Beverages
                      Mugi to Hop Brand total down            % y-o-y     %
                                                                           110
                      Goku Zero Brand total down             % y-o-y
                                                                           100

                                                                            90
                     【Wine, Spirits and other】(net sales)
                                                                            80
                      Wine: down      % y-o-y
                                                                            70

                      RTD : up      % y-o-y                                60
                                                                                 Jan   Feb    Mar       Apr     May       Jun      Jul      Aug        Sep
                      Spirits:up      % y-o-y                                         Total new genre demand                      Mugi to Hop

                      Japanese liquor: down       % y-o-y
                                                                                          Copyright, 2018 SAPPORO HOLDINGS LTD. All rights reserved.   22/41
(10,000 cases)
                                       <3 core brand Jan- Sep Sales volume change>

                       1,400

                       1,200                                                                              <Beer lineup (Jan – Sep breakdown>

                       1,000                                                                                       14%
  Appendix
Japanese Alcoholic       800
    Beverages
                         600
                                                                                                                                                            58%
                                                                                                          28%
                         400

                         200
                                                                                                                  Black label          Yebisu        Other

                           0
                                      2012    2013       2014      2015        2016     2017       2018
                               Black label brand total    Yebisu brand total    Mugi to Hop brand total

                                                                                                           Copyright, 2018 SAPPORO HOLDINGS LTD. All rights reserved.   23/41
<Jan- Sep Net Sales>                                                           (billions of yen)
                     Billions of yen                                                                               10
                                                      ※incl. liquor tax
                     200
                     180                                                                                                         5.3 5.1 5.4 5.4 5.2
                                                                                                                    5    4.5 4.9
                     160
                     140         56.0       54.8       60.0          52.5         48.8      44.3        37.8             3.3 3.4 3.9 3.7 3.5 3.5 3.3
                     120                                                                                            0
                     100                                                                                                2012 2013 2014 2015 2016 2017 2018
                      80                                                                                                      Japanese wine            Imported wine
                                                                                                                   8
                      60        110.7       112.8     112.0         111.7        117.8      121.0       116.6
                      40                                                                                           6
                      20                                                                                           4
                                                                                                                                        4.9 5.5 6.1
                       0                                                                                           2    3.4 4.2 4.2 4.2
  Appendix                        2012      2013       2014          2015         2016      2017        2018       0
Japanese Alcoholic                                  Beer      Happoshu, New genre                                       2012 2013 2014 2015 2016 2017 2018

    Beverages                          <Jan- Sep sales breakdown by category>                                      15
                                                                                                                                             Spirits

                                                           *before subsidiary companies sales, elimination of
                                                           inter- company transactions and rebate deduction        10
                                                       7%                                                           5
                                                                                                                        7.8 9.3 10.4 10.3
                                                                                                                                          11.3 11.8 11.1
                                            6%                                                                      0
                                                                                         Beer
                                       7%                                                                               2012 2013 2014 2015 2016 2017 2018
                                                                                         Happoshu& New‐genre                            Japanese liquor
                                                                                                                   10
                                                                                         Wine& Spirit
                                                                                         Japanese Liquor            5
                                                                                                                                                                       8.0
                                   20%                                                   RTD& Non‐alcoholic beer         2.5 2.1 3.3 3.3 3.8 5.3
                                                                                                                    0
                                                                            60%                                         2012 2013 2014 2015 2016 2017 2018
                                                                                                                                            RTD
                                              *All Figures are before rebate deduction
                                                                                                                        Copyright, 2018 SAPPORO HOLDINGS LTD. All rights reserved.   24/41
<Jul- Sep Major new products>                   *incl. improved products (※I)

                                      Sapporo LAGER BEER                          Hokkaido draft beer                           Kuradashi draft beer
                     Kohaku YEBISU                         Black label<Black>                           Baisen draft beer

  Appendix
Japanese Alcoholic
    Beverages

                                              Mugi to Hop                                Furano no kaori
                                            Tohoku no kaori
                       Innovative Brewer                            Mugi to Hop
                                                                                                                  (Special edition) Mugi to Hop
                         Gourmet beer                              Kaoru Furano

                         (Special edition) Halloween design products                          (Special edition) Sapporo Draft beer Black label

                                                                                                                Copyright, 2018 SAPPORO HOLDINGS LTD. All rights reserved.   25/41
<Jul- Sep Major new products>                   *incl. improved products (※I)

                                               Left:Citron Sour(※I)                                                   Otoko Ume sour (Plum RTD)
               Sapporo Chuhi 99.99             Right:Napoin Sour                      Otoko Ume sour (Plum RTD)
                                                                                                                      Halloween special design
                (Four nine RTD)                                                       Left: Otoko Ume sour(※I)
                                                                                      Midle: Super Otoko Ume sour(※I)
                                                                                      Right:Dry Otoko Ume sour

Appendix

                                       Momomomo Nectar Sour
                                     (Golden and White peach RTD)
                       Rirakusu                                       Umekaku
           (Sappari grape fruit vinegar RTD)                Soda shitate no Ume cocktails
                                                                   (Shine Muscat)             Salt and Litchi Sour

                                                                                                                                               White Plum liquor

                                                                                                                    Umekaku
                               Ai no Skal Sour                                                                  kajitsushitate no
                               Left:Blue Soda Sour             Left:Limoncello lemon sour                     Umeshu cocktail Yuzu
                               Right:Red Apple Sour            Right: Apancello orange sour                 Copyright, 2018 SAPPORO HOLDINGS LTD. All rights reserved.   26/41
<Jul- Sep Major new products>                  *incl. improved products (※I)

Appendix      Bio Mania<organic>                                                                 Japanese wine
              Left: Chile Cabernet Sauvignon                                                                                    La cuvee MYTHIQUE
              Right: Chile Chardonnay          Grande Polaire- Azuminoikeda (Japanese wine)                                      Halloween design

                                                        Dewarʼs White label
                                                              200ml
                                                                                                                             Penfolds g3
                   Penfolds Grange                                               Yellow tail Bubbles

                                                                                                Copyright, 2018 SAPPORO HOLDINGS LTD. All rights reserved.   27/41
At Japan Wine Competition 2018,
           Grande Polaire Yamanashi Koshu Barrel Fermentation 2017
                   won first-ever three consecutive years of
                      Gold and top honor in its category
                              At the Japan Wine Competition 2018 held in July in Yamanashi
                              Prefecture, Grande Polaire Yamanashi Koshu Barrel Fermentation
                              2017 won the Gold and top honor in its category.
                              In the Koshu division, one of the wine varieties representing Japan,
                              the wine had received the Gold and top honor for two consecutive
                              years and made it three years in a row with this year’s win, the first-
                              ever wine to do so. Sapporo products also won four Silvers and
Appendix                      nine Bronzes.

                              Grande Polaire Yamanashi Koshu Barrel Fermentation 2017 uses
                              only grapes grown in Katsunuma-cho, Koshu-shi, and is brewed by
                              selecting fully ripe Koshu grapes with superior sugar content and
                              taste. It is light yellow in color with a slight greenish tint and is a dry
                              wine with sound acidity and a fruit-derived sweet aftertaste that
                              harmoniously blends a flowery aroma that reminds of citrus and the
                              gentle fragrance of the cask in which it was fermented.

                              The Sapporo Group will further upgrade its flagship brand Grande
                              Polaire to a higher level and continue to work on wine production
                              that will succeed not only in Japan but also the rest of the world.

                              http://www.sapporobeer.jp/news_release/0000021984/index.html

                                                                     Copyright, 2018 SAPPORO HOLDINGS LTD. All rights reserved.   28/41
【U.S. soft drinks business】
                【Overseas brand】
                (Products of Sleeman and Anchor)                         Jan- Sep down                         %     y-o-y
                                                                              *sales revenue after elimination
                 Jan-Sep up       %   y-o-y *sales volume                    of inter- company transactions

                                                                   <U.S. soft drinks business Net Sales in Local Currency
                【Sapporo brand】                                                         (Jan-Sep)>
                                                                             (※)SSC and CPF integrated in Apr 2018
                 Jan- Sep up       %   y-o-y *sales volume
                                                                        25
                                                                                   19.2                   19.2                   18.6
                                                                        20
                                                                                                                                (※)
                【Vietnam】                                               15
Appendix                                                                10
International    Jan- Sep down          %   y-o-y *sales volume
                       <Y-o-y change in domestic sales volume            5
                                    in Vietnam
                140%                                                     0
                                                                                   2016                  2017                    2018
                120%
                100%                                                                 Silver Springs Citrus (US$ millions)
                                                                                     Country Pure Foods (US$ millions)
                 80%
                 60%
                 40%
                 20%
                 0%

                                                                                      Copyright, 2018 SAPPORO HOLDINGS LTD. All rights reserved.   29/41
<SLEEMAN:Net Sales in Local Currency (Jan-Sep)                                           Sapporo brand sales volume
                       *before elimination of inter- company transactions                                 breakdown by geographic area
                450
                                                             J GAAP                    IFRS                                                            9%
                400                                   (Excluded liquor tax)    (Included liquor tax)
                                                                                                                   7%
                350
                                                                                                                                        34%
                300
                250                                                                                      26%
                                                                                                                   3.37                              4.67
                200                                                            375 390                           million cases                     million cases
                150                                                                                                                67%
                                          246 248 261 265                                                                                                                    57%
                100       183 198 205 235
                      165                                                                              2013 3Q
                 50                                                                                                                 2018 3Q
                  0
                      2008 2009 2010 2011 2012 2013 2014 2015 2016 2017 2018                               North America:Canada, U.S.
                                                                                                           Asia:Vietnam, Singapore, South Korea, etc.
                                      SLEEMAN(Can$ millions)                                               Oceania, etc.:Australia, Europe, etc.
Appendix                                                                                                         <Trend of overseas sales volume of
                <Sapporo U.S.A.:Net Sales in Local Currency (Jan- Sep)
International          *before elimination of inter- company transactions                                        Sapporo brand products (Jan- Sep)>

                 50                                                   J GAAP        IFRS
                                                                                                        1,200                                                 (10,000 cases)

                 45                                                                                     1,000
                 40
                 35                                                                                      800
                 30                                                                                      600
                 25                                                                                                                  957 963 965 1,039
                 20                         41   43      43      44     45       47        47            400     833 892 912 946 938
                      36         37   39
                 15         33                                                                                                              462 467
                                                                                                         200                337 365 394 417
                 10                                                                                             184 201 282
                  5                                                                                        0
                  0                                                                                             2010 2011 2012 2013 2014 2015 2016 2017 2018
                      2008 2009 2010 2011 2012 2013 2014 2015 2016 2017 2018                                      Sapporo brand        SLEEMAN            Oversea brand
                                                                                                                                                            (SLEEMAN+ANCHOR)
                                        USA(US$ millions)
                                                                                                                                                                            30/41
                                                                                                                        Copyright, 2018 SAPPORO HOLDINGS LTD. All rights reserved.
【Lemon-based drinks】                                   【Lemon-based food products】
                                                                                Jan- Sep up         % y-o-y *sales volume
                      Jan-Sep up        % y-o-y *sales volume
                                                                            

                     【Unsweetened tea drinks】                               【Soups】

                      Jan- Sep up       % y-o-y *sales volume               Jan- Sep down                  % y-o-y *sales volume
                                                                            

                     【Coffee drinks】                                        【Soy milk, chilled products】
                      Jan- Sep down            % y-o-y *sales volume           Jan –Sep up           % y-o-y *sales volume
                     
  Appendix                 <Japanese soft drinks                                          <Japanese soft drinks
                     POKKA SAPPORO Food & Beverage                                      Sales composition by genre
Food & Soft Drinks
                     Sales composition by sales channel                                        (Jan- Sep)>
                               (Jan- Sep)>

                                                                                        19%                       18%
                                                           Vending                                                                              Coffee drinks
                     53%                                   machines                                                                             Lemon‐based
                             32.81million         47%                              5%
                                                           Retailer                         32.81million                                        drinks
                                                                                                                                                Tea drinks
                                 cases
                                                                                                   cases                      16%               Carbonated
                                                                                  16%                                                           Water
                                            ※Vending machines (end of Sep.)
                                             own brand machines : about 82,000
                                                                                                                  26%
                                            + Multi-brand machines
                                                                                            Copyright, 2018 SAPPORO HOLDINGS LTD. All rights reserved.   31/41
<Food & Soft Drinks segment Revenue>                        <Food & Soft Drinks segment
                     (billions of Yen)                 (Jan- Sep)                               Revenue break down by geographic area>
                       120
                                   ※April 2011 Consolidation of
                                                                             J GAAP   IFRS
                       100                POKKA CORPORATION

                         80
                                                                                                    85%
                         60
                                                                              101.5 97.2 94.2
                                                          93.4 95.9 97.6 99.3
                         40                        74.7                                                                                   15%
                         20
  Appendix                 0
                                  28.6 23.5 25.4

Food & Soft Drinks               2008 2009 2010 2011 2012 2013 2014 2015 2016 2017 2018
                                                                                                            Japan        Overseas

                                                  <Japanese soft drinks                                  <Overseas soft drinks
                                             POKKA SAPPORO Food & Beverage                           POKKA Corporation (Singapore)
                                              Sales composition (Jan- Sep)>                          Sales composition (Jan- Sep)>
                                                            3%
                                               22%                                                    34%
                                                           ¥60.1                                                     152
                                                                                                             SG$ million
                                                           billion
                                                                             75%                                                               66%
                                                   Soft drinks    Food    Soy milk                           Within Singapore             Export
                                                                                                             Copyright, 2018 SAPPORO HOLDINGS LTD. All rights reserved.   32/41
【Pokka Create CO., Ltd.】
                         Jan- Sep Revenue              billion
                                    unchanged y-o-y                                     <New & refurbish outlets >

                              53
                                      203
  Appendix
                                                             East Japan

                                                 112         Central Japan
Food & Soft Drinks                  outlets                  West Japan

                                                  Increased 10 outlets compared with
                               38                 2017 3Q
                                                  (East +7, Central+1,West+2)

                             96        203       107
                                                            Directory operated

                                     outlets                FC

                                                 Increased 10FC outlets compared with
                                                 2017 3Q
                                                  (Directory operated +3, FC +7)
                                                                                           Copyright, 2018 SAPPORO HOLDINGS LTD. All rights reserved.   33/41
<Jul-Sep Major New products > Drink *incl. improved products (※I)

                   Left:Chocolate drink                                             Café de Crie Black coffee
                   Rght:Milk shake
参考資料                                                        JELEETS Crush Pudding
                                                               (Pudding shake)
                                                                                                                                      Pear drink

Appendix

                                              Unsweetened tea
                                                                                     Lavender tea

                                                                   Tea latte (※I)

                 Kireto lemon calcium drink
                                                                                                                    Hibiscus tea
                                                                                                Copyright, 2018 SAPPORO HOLDINGS LTD. All rights reserved.   34/41
<Jul-Sep Major New products > Foods

                                                                                        Risorante and other soups

参考資料
Appendix
                                    Jikkuri-kotokoto Soup series

                                                                   Copyright, 2018 SAPPORO HOLDINGS LTD. All rights reserved.   35/41
[Activities to expand Pokka Lemon brand contacts]
                                                  Lemon Sour Grand Prix 2018 in Kanto
                                                   POKKA SAPPORO Food & Beverages Ltd. in collaboration with Gurunavi, Inc. held Lemon Sour
                                                   Grand Prix 2018 in Kanto from June 18 to July 18, 2018. From the 121 original lemon sour menu
                                                   items entered by the participating restaurants, Kanto’s No. 1 lemon sour was decided based on voting
                                                   from general customers and comprehensive examination by external judges and the company.
                                                   https://www.pokkasapporo-fb.jp/company/news/release/180618_01.html

                                                  *Name of menu items, restaurants: https://www.pokkasapporo-fb.jp/company/news/release/180821_01.html
                                                                                     (From left) Grand Prix, second place, chicken best match prize, 2018 trend prize

Appendix

                                                Lemon healthy stand limited to summer
                                                 installed in Tokyo, Ebisu, and Nagoya
                                                                                                Lemon healthy stand offers healthy drinks that helps
                                                                                                people to experience the deliciousness of lemon. All
                                                                                                items on the menu including Lemonade with Selectable
                                                                                                Lemon Content and Frozen Lemonade use lemon and
                                                                                                are unique to Pokka Sapporo, with emphasis on the
                                                                                                deliciousness of lemon. Further, customers can enjoy
                                                                                                photogenic drinks that come with additional lemon
                                                                                                toppings and in frozen form.
                                                                                                https://www.pokkasapporo-
                                                                                                fb.jp/company/news/release/180712_01.html
            
                                                                                                                Copyright, 2018 SAPPORO HOLDINGS LTD. All rights reserved.   36/41
Construction of new soymilk yogurt production line
           POKKA SAPPORO Food & Beverages Ltd. has been creating new business and product fields while
           expanding its beverage brands leveraging strengths in the lemon and soup businesses. In October 2015, it
           purchased the business rights to soymilk drinks and soymilk yogurt from Toraku Foods Co., Ltd. and began the
           soy beans and chilled business.
           While Toraku has been manufacturing soymilk yogurt, the company decided that it is necessary to manufacture
           it in-house to expand the market. The line it is newly installing can produce both existing small sized containers
           and additionally large-sized containers and enables the company to deploy soymilk yogurt products that even
           more reflect customer needs.

Appendix   Going forward, the company will aim for further growth of the soy beans and chilled business by producing
           soymilk yogurt products at its own plant and offering new values to consumers.
           
           Manufacturing item:   soymilk yogurt
           Number of lines:      2 (large container of about 400g, small container of
                                    about 100g)
           Production capacity: 3.8 million cases per year
                                (a case has 12 small-sized containers)
                                 3.4 million cases per year
                                 (a case has 6 large-sized containers)
           Investment:            ¥5.3 billion
           Location:             Gunma Plant, POKKA SAPPORO Food & Beverages Ltd.
                                 Sakai Hokubu Industrial Park, Sakai Higashi Arai 1301-1, Isesaki-shi,
                                 Gunma Prefecture
           Scheduled completion: March 2019
           https://www.pokkasapporo-fb.jp/company/news/release/180926_02.html
                                                                                        Copyright, 2018 SAPPORO HOLDINGS LTD. All rights reserved.   37/41
(billions
              of yen)        Trends of net sales and number of                              <Sapporo Lion outlets >
                                   Sapporo Lion Outlets *before rebate deduction              As of Sep 30, 2017
              25.0                                                   220

              20.0        195 194
                                                                            200             7 10
                                      186 188                               180        14                                                   Tokyo Metroporitan
              15.0                                  177 173
                                                168         170
                                                                            160    4                                                        Kanto(excl.Tokyo)

              10.0                                                                                                                          Hokkaido
                          17.9 19.3 19.6 19.0 18.9 18.7 19.0 18.1           140
                                                                                                  170
                                                                                                   173                                      Tohoku
               5.0                                                          120                                                             Nagoya
                                                                                                                                            Kansai
               0.0                                                          100    25
Appendix                  2011 2012 2013 2014 2015 2016 2017 2018                                                               86
                                                                                                                                            Other

Restaurants                         Net Sales   Number of outlets
                                                                                        24
                  <Restaurants segment total number of outlets>
<Major rental properties & occupancy rates:(Averages for 2018 3Q )                                                                        <Information about
                                                                                                                                                        Real Estate for lease>
                                                                                             Occupancy
                                                        Site area         Floor area                                                                                         (billions of yen)
                                                                                                rate               No. of floors               400
                                                         (㎡)                (㎡)
                                                                                               (%)
                                                                                                                                               350
                                                                                                             40 floors above
                Yebisu Garden       Place(1)             56,943          298,007                  100                                          300
                                                                                                             ground, 5 below
                                                                                                             12 floors above                   250
                Ebisu First Square                         2,596           16,012                 100                                                           389.1
                                                                                                             ground, 1 below                   200                                      397.6
                                                                                                             7 floors above                    150
                Ebisu Square                               1,561             8,644                100        ground, 1 below
                                                                                                                                               100         201.8                 200.0
                                                                                                             11 floors above
                Ginza Place                                   645            7,350                100                                           50
                                                                                                             ground, 2 below
                                                                                                             13 floors above                      0
                Strata Ginza(2)                            1,117           11,411                 100
Appendix
                                                                                                             ground, 1 below                            As of December As of December
               *1: The number of floors is for the office block only. Occupancy rates are for office areas only.
                                                                                                                                                            31, 2016       31, 2017
Real Estate
               *2: Figures are for entire property. Sapporo owns 922m2 of the site (sectional ownership) and 89.72% of the building
                (joint management)                                                                                                                     Balance sheet value            Fair value

                                                                         (billions of yen)                                                                                 (billions of yen)

                                                       2017 3Q            2018 3Q             Change                                                       2017 3Q          2018 3Q              Change
               <Operating income>                                                                                       <EBITDA>

               Yebisu Garden Place, etc.                        -              5.8                     -             Yebisu Garden Place, etc.                     -              8.2                  -

               Hokkaido                                         -              1.0                     -             Hokkaido                                      -              0.9                  -

               Other area & other                                                                                    Other area & other                            -
                                                                -
                                                                               2.0                     -             operations                                                   3.7                  -
               operations

               General corporate                                -            (0.7)                     -             General corporate                             -           (0.7)                   -

               Total                                            -              8.2                     -             Total                                         -            12.1                   -
               ※Thereʼs no disclosure of operating income for 2017.3Q                                              ※Under IFRS,
                                                                                                                   EBITDA=Profit from operations before non-recurring items+ Depreciation and amortization
                                                                                                                                                                                                   39/41
                                                                                                                                              Copyright, 2018 SAPPORO HOLDINGS LTD. All rights reserved.
Various Initiatives by the Sapporo Group
              Selected as component for FTSE4Good Index Series and FTSE Blossom Japan Index, major
               indexes of ESG investment.
               http://www.sapporoholdings.jp/news_release/0000020447/index.html

              Prior start of joint collection of beer pallets in 6 prefectures in Tohoku
                http://www.sapporobeer.jp/news_release/0000022035/index.html

              Donations to the afflicted areas of 2018 Hokkaido Eastern Iburi earthquake
                http://www.sapporoholdings.jp/news_release/0000020452/index.html

              Tohoku restoration support with shareholder special benefit plan
                      〜Utilization in education support for children who will play major roles in
               restoration of Tohoku〜
Appendix         http://www.sapporoholdings.jp/news_release/0000020443/index.html
                                                                                                       Photo 1                                   Photo 2

              Donation of part of sales to Chiba Environment Restoration Fund
                http://www.sapporobeer.jp/news_release/0000021987/index.html
                *Photos 1, 2

                                                                                                         Photo 3
                                                                                                                                                  Photo 4
              The 10th Yebisu Beer Festival themed on “Beer festival of grown-ups’ city”
                〜 Restoration Support Marché was held
                commemorating the 10th anniversary 〜
                http://www.sapporoholdings.jp/news_release/0000020449/index.html
                 *Photos 3, 4

                                                                                                    Copyright, 2018 SAPPORO HOLDINGS LTD. All rights reserved.   40/41
As an intrinsic part of people's lives, Sapporo will contribute to
 the evolution of creative, enriching and rewarding lifestyles.

                                                       Copyright, 2018 SAPPORO HOLDINGS LTD. All rights reserved.   41/41
You can also read